| Param | Original file | Final file |
|---|---|---|
| Filename | modeM0/AS1A04_160T01_9000001798_12189cztM0_level2.evt | modeM0/AS1A04_160T01_9000001798_12189cztM0_level2_quad_clean.evt |
| Size (bytes) | 541,097,280 | 127,249,920 |
| Size | 516.0 MB | 121.4 MB |
| Events in quadrant A | 3,593,815 | 877,567 |
| Events in quadrant B | 5,472,027 | 815,874 |
| Events in quadrant C | 3,118,412 | 867,567 |
| Events in quadrant D | 3,750,729 | 828,274 |
| Mode SS | |||
|---|---|---|---|
| Quadrant | BADHDUFLAG | Total packets | Discarded packets |
| A | 0 | 136 | 0 |
| B | 0 | 136 | 0 |
| C | 0 | 136 | 0 |
| D | 0 | 136 | 0 |
| Mode M9 | |||
|---|---|---|---|
| Quadrant | BADHDUFLAG | Total packets | Discarded packets |
| A | 0 | 10 | 0 |
| B | 0 | 10 | 0 |
| C | 0 | 10 | 0 |
| D | 0 | 10 | 0 |
| Mode M0 | |||
|---|---|---|---|
| Quadrant | BADHDUFLAG | Total packets | Discarded packets |
| A | 0 | 15069 | 2 |
| B | 0 | 20785 | 1 |
| C | 0 | 13843 | 1 |
| D | 0 | 15643 | 1 |
| Quadrant | Total seconds | Saturated seconds | Saturation percentage |
|---|---|---|---|
| A | 6660 | 113 | 1.696697% |
| B | 6660 | 869 | 13.048048% |
| C | 6660 | 63 | 0.945946% |
| D | 6660 | 144 | 2.162162% |
Noise dominated data is calculated using 1-second bins in cleaned event files. If a bin has >2000 counts, and if more than 50% of those come from <1% of pixels, then it is considered to be noise-dominated and hence unusable.
| Quadrant | # 1 sec bins | Bins with >0 counts | Bins with >2000 counts | High rate bins dominated by noise | Noise dominated (total time) | Noise dominated (detector-on time) | Marked lightcurve |
|---|---|---|---|---|---|---|---|
| A | 7696 | 6663 | 5 | 5 | 0.06% | 0.08% | 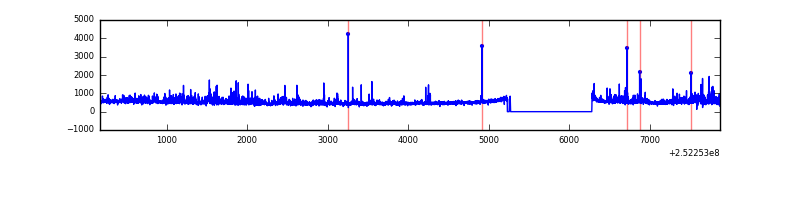 |
| B | 7696 | 6663 | 486 | 486 | 6.31% | 7.29% | 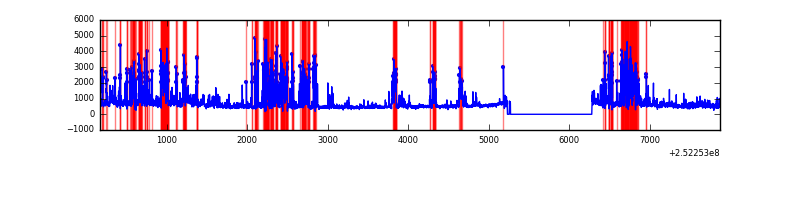 |
| C | 7696 | 6663 | 11 | 11 | 0.14% | 0.17% | 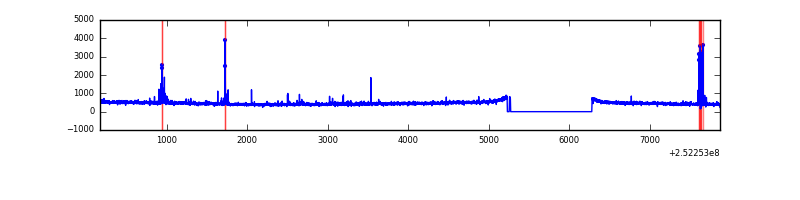 |
| D | 7696 | 6663 | 67 | 67 | 0.87% | 1.01% | 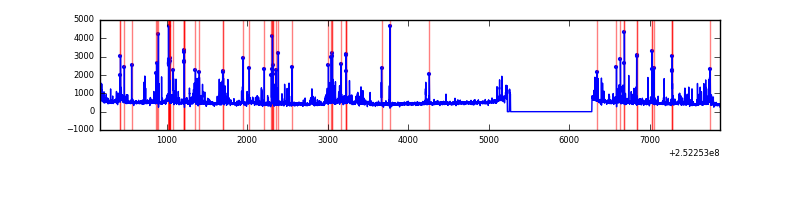 |
Top three noisy pixels from each quadrant. If the there are fewer than three noisy pixels in the level2.evt file, extra rows are filled as -1
| Pixel properties | Quadrant properties | ||||||
|---|---|---|---|---|---|---|---|
| Quadrant | DetID | PixID | Counts | Sigma | Mean | Median | Sigma |
| A | 1 | 162 | 173730 | 1071.03 | 796 | 780 | 161.5 |
| A | 1 | 178 | 89103 | 546.96 | 796 | 780 | 161.5 |
| A | 1 | 161 | 79002 | 484.41 | 796 | 780 | 161.5 |
| B | 4 | 239 | 1685178 | 12215.43 | 742 | 723 | 137.9 |
| B | 10 | 16 | 408163 | 2954.7 | 742 | 723 | 137.9 |
| B | 15 | 204 | 244309 | 1766.45 | 742 | 723 | 137.9 |
| C | 0 | 207 | 66167 | 372.84 | 763 | 766 | 175.4 |
| C | 15 | 208 | 45714 | 256.24 | 763 | 766 | 175.4 |
| C | 4 | 175 | 17005 | 92.58 | 763 | 766 | 175.4 |
| D | 10 | 157 | 242913 | 1343.65 | 760 | 738 | 180.2 |
| D | 1 | 52 | 189713 | 1048.48 | 760 | 738 | 180.2 |
| D | 13 | 104 | 125469 | 692.04 | 760 | 738 | 180.2 |
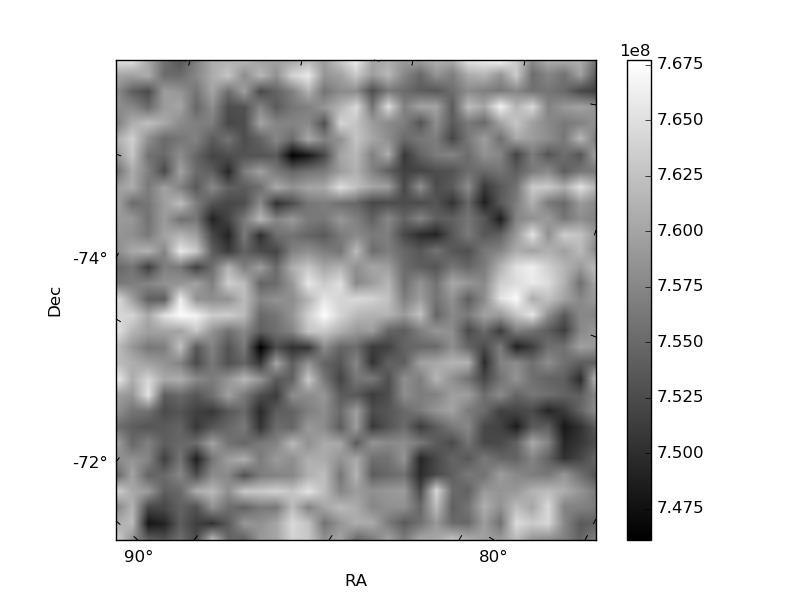
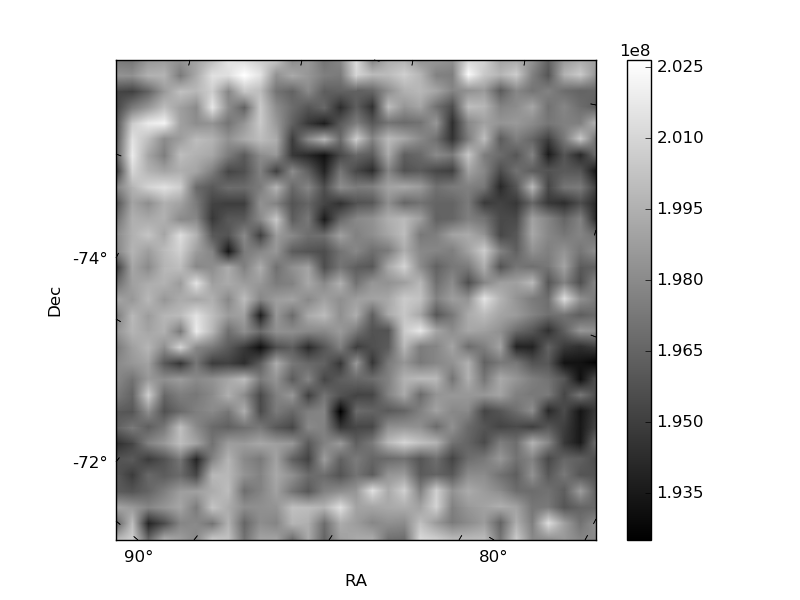
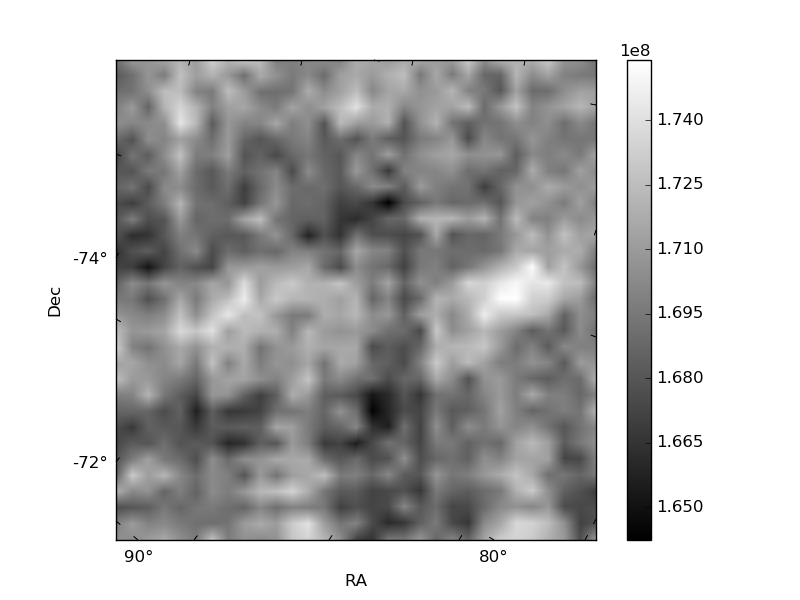
Histogram calculated using DETX and DETY for each event in the final _common_clean file
| Quadrant A | 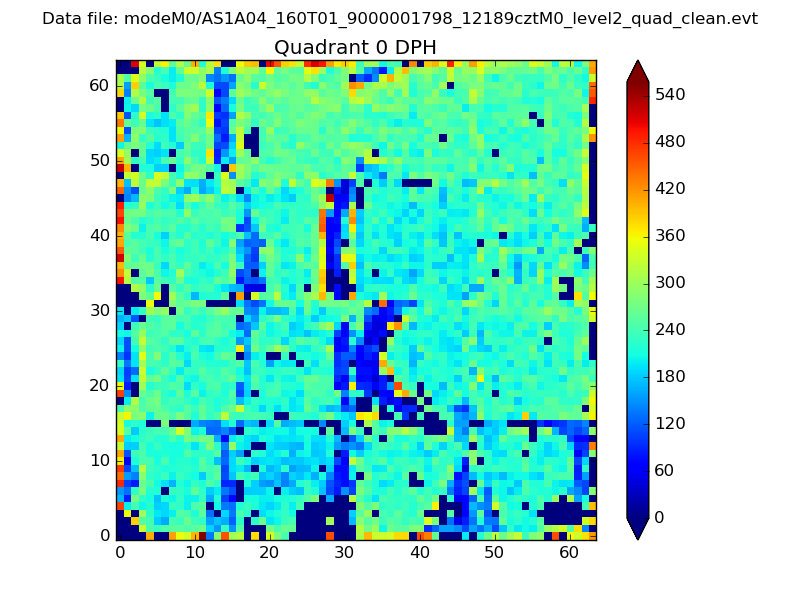 |
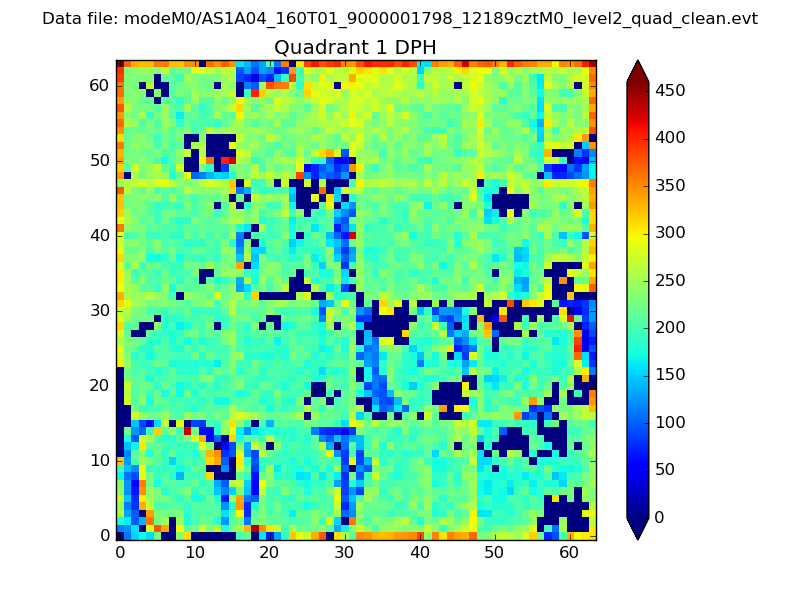 |
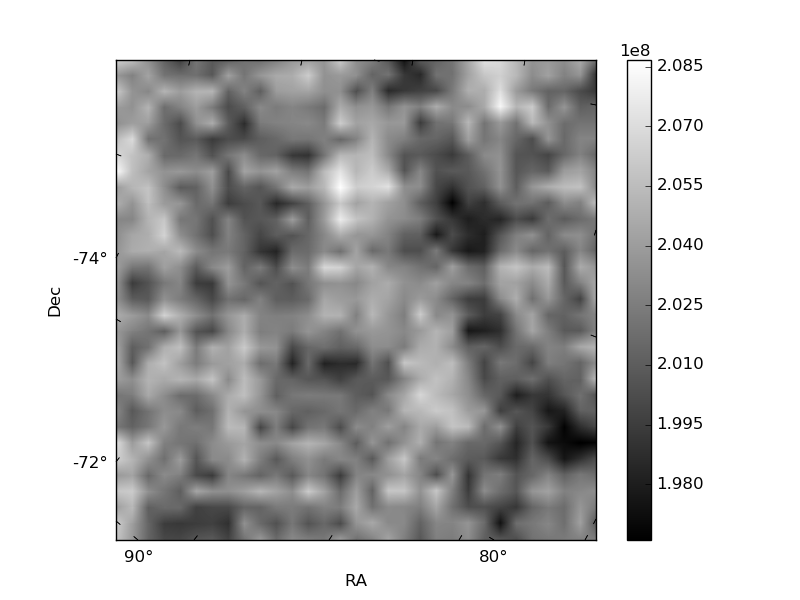
Quadrant B |
|---|---|---|---|
| Quadrant D | 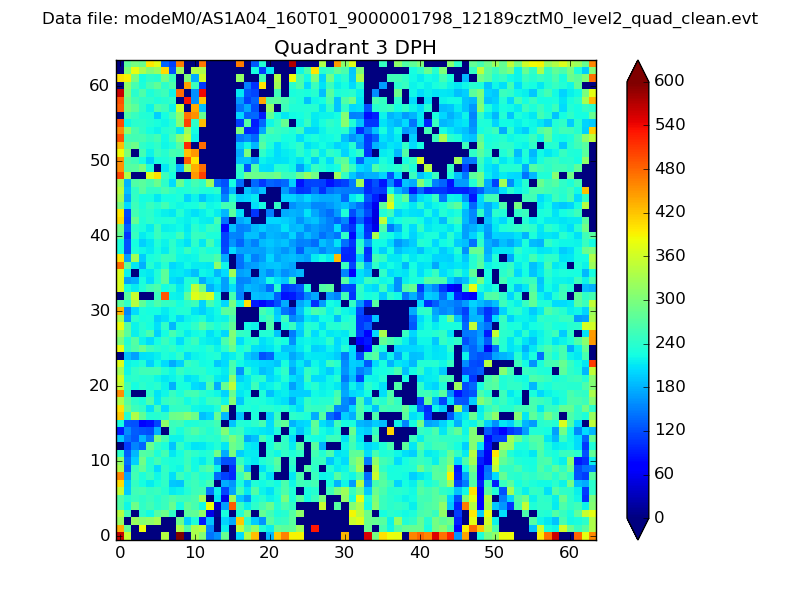 |
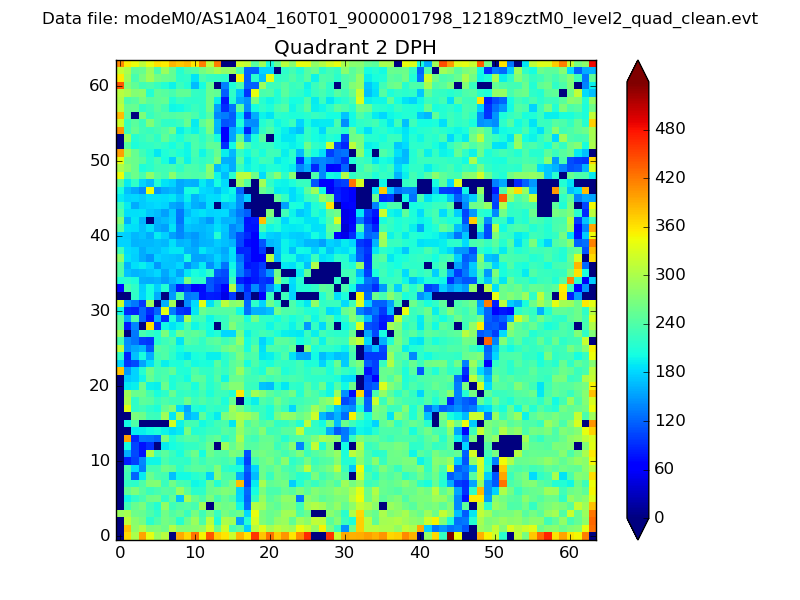 |
Quadrant C |
| Plot type | Count rate plots | Images |
|---|---|---|
| Comparison with Poisson distribution Blue bars denote a histogram of data divided into 1 sec bins. Red curve is a Poisson curve with rate = median count rate of data. |
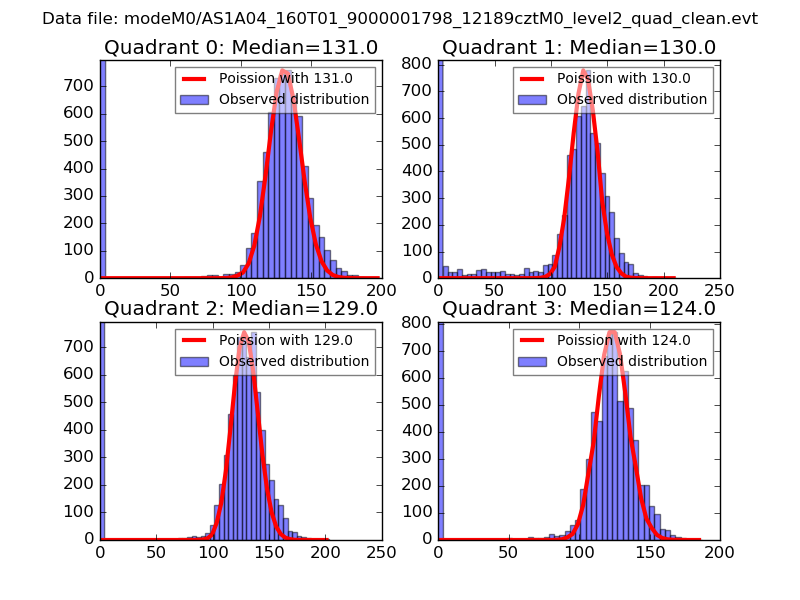 |
 |
| Quadrant-wise count rates Data is divided into 100 sec bins |
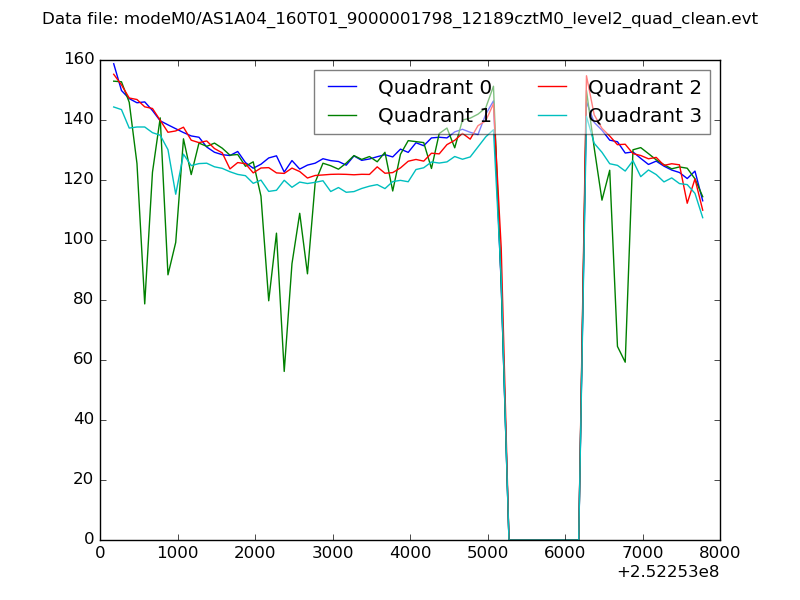 |
|
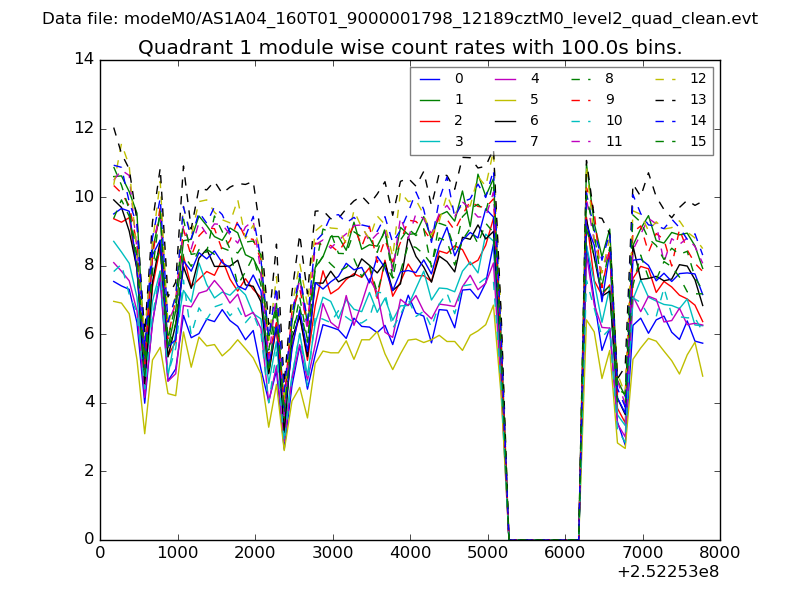
| Module-wise count rates for Quadrant A Data is divided into 100 sec bins |
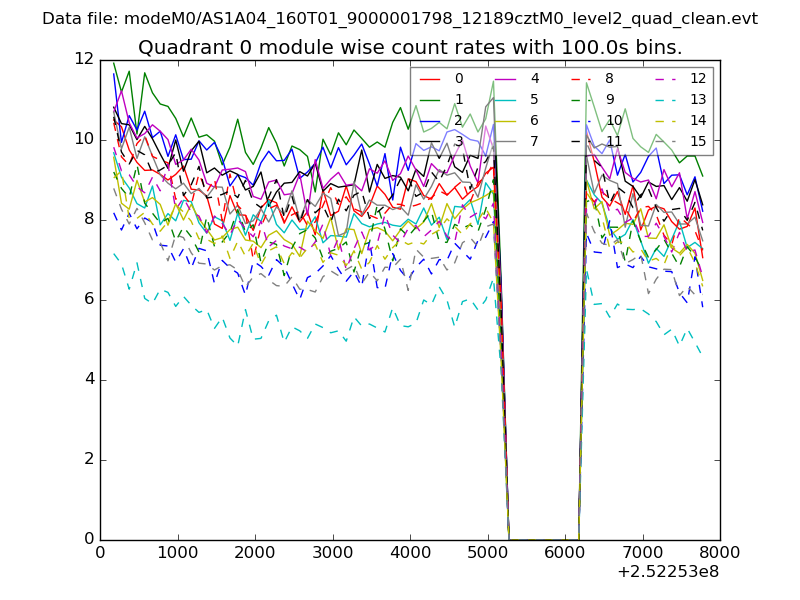 |
 |
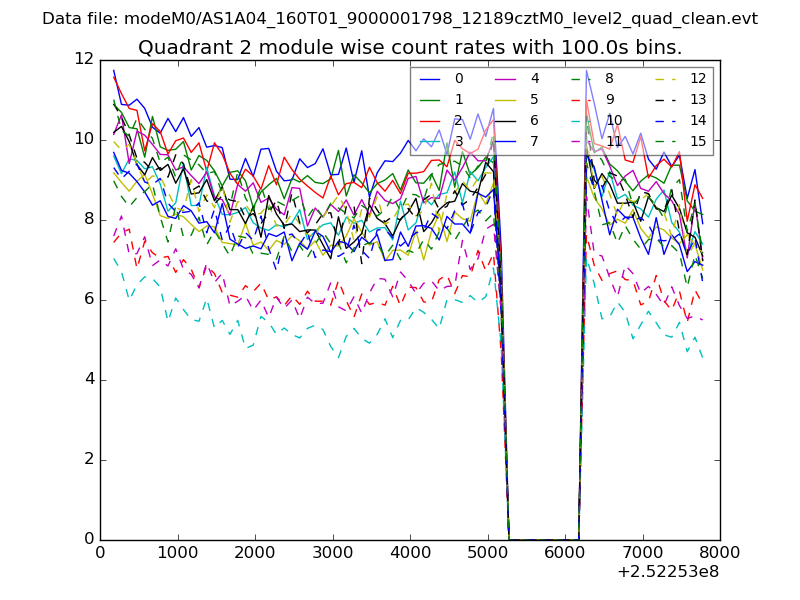
| Module-wise count rates for Quadrant B Data is divided into 100 sec bins |
 |
 |
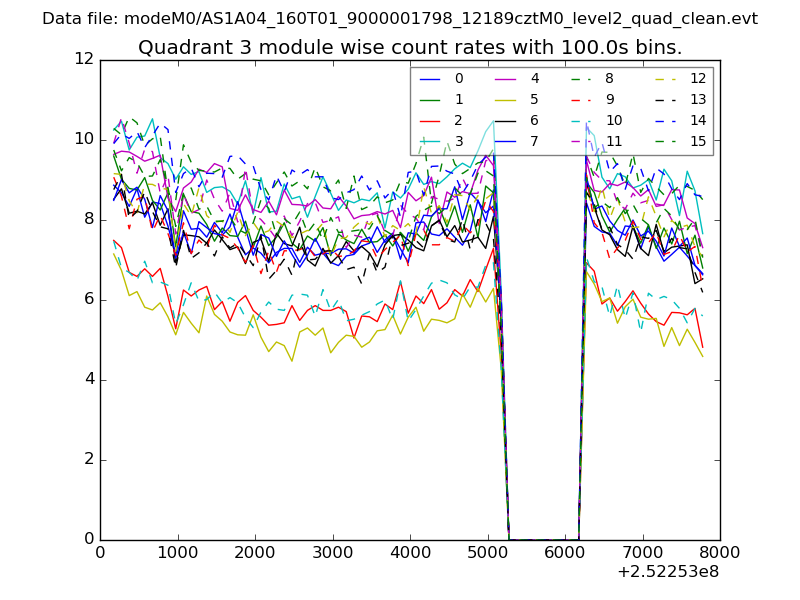
| Module-wise count rates for Quadrant C Data is divided into 100 sec bins |
 |
 |
| Module-wise count rates for Quadrant D Data is divided into 100 sec bins |
 |
 |
| Parameter | Plot |
|---|---|
| CZT HV Monitor | 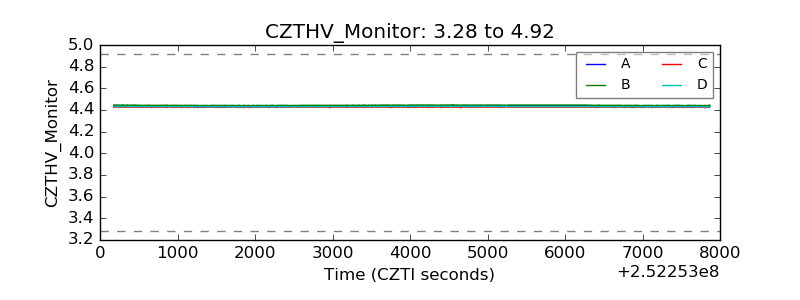 |
| D_VDD | 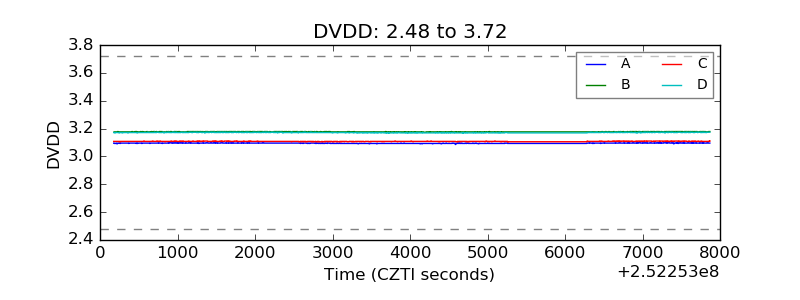 |
| Temperature 1 |  |
| Veto HV Monitor | 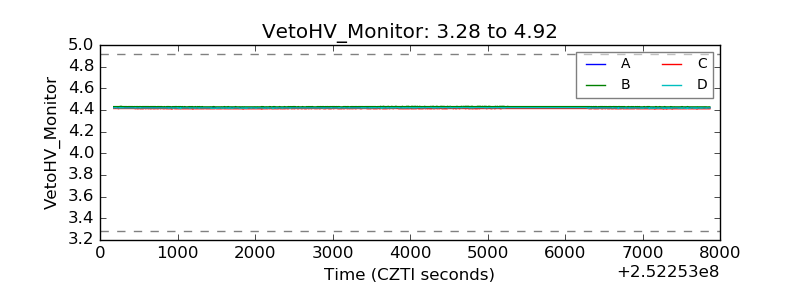 |
| Veto LLD | 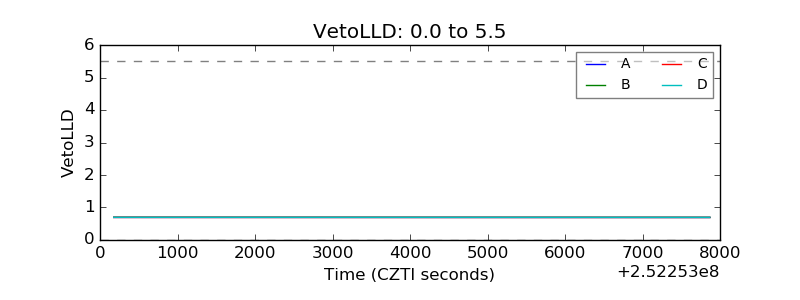 |
| Alpha Counter | 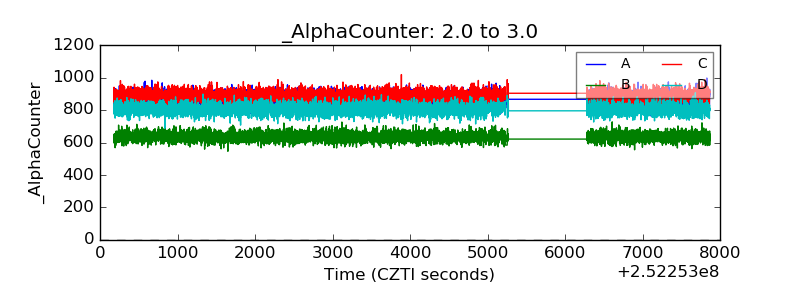 |
| _CPM_Rate | 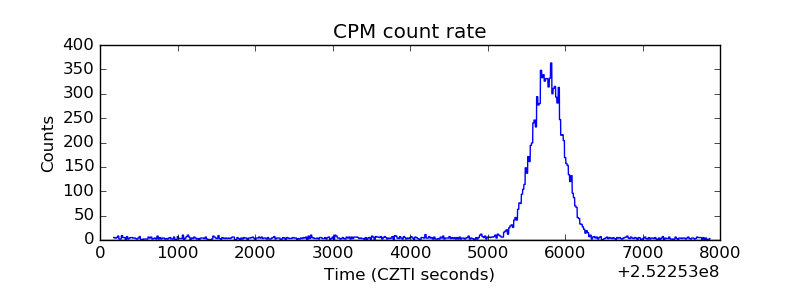 |
| CZT Counter | 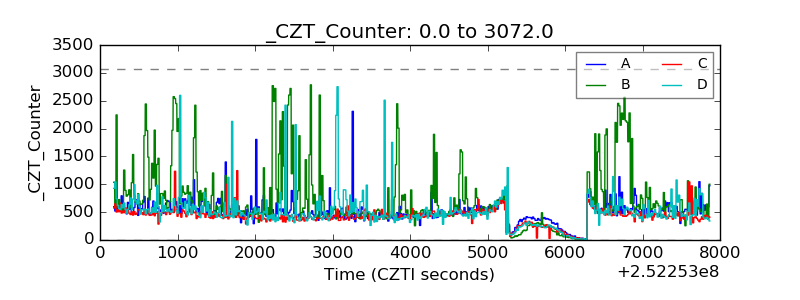 |
| +2.5 Volts monitor |  |
| +5 Volts monitor | 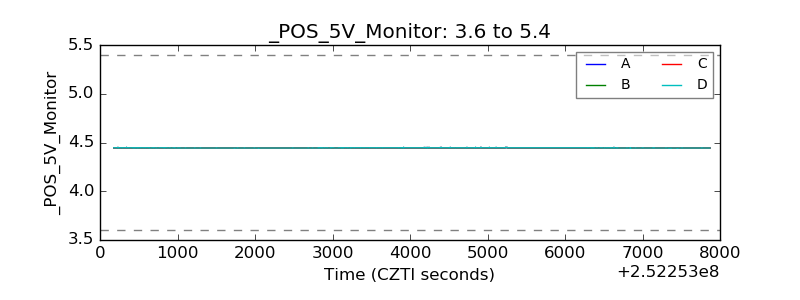 |
| _ROLL_ROT | 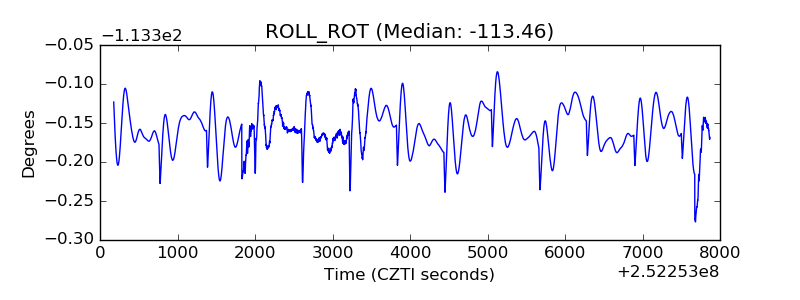 |
| _Roll_DEC | 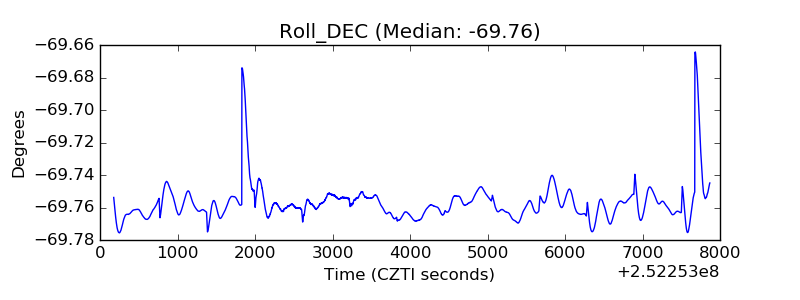 |
| _Roll_RA | 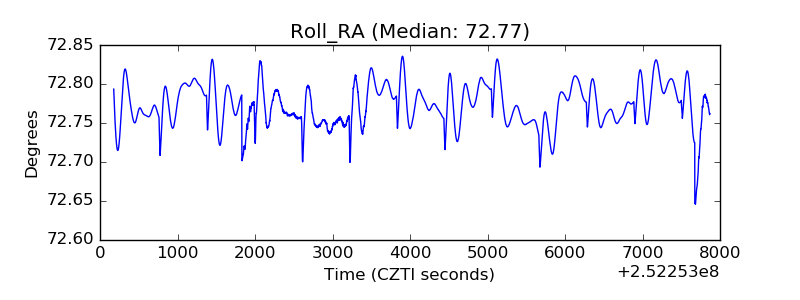 |
| Veto Counter | 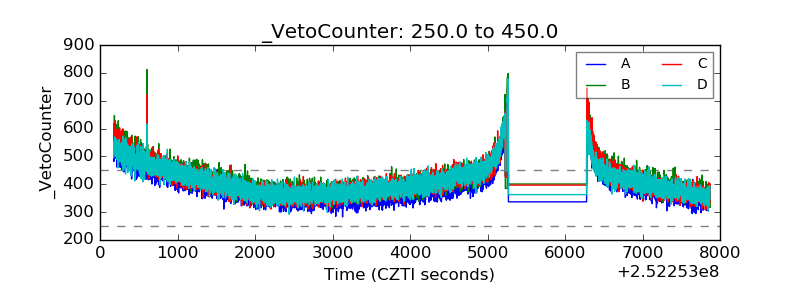 |