| Param | Original file | Final file |
|---|---|---|
| Filename | modeM0/AS1G08_010T03_9000001800cztM0_level2.fits | modeM0/AS1G08_010T03_9000001800cztM0_level2_quad_clean.evt |
| Size (bytes) | 370,621,440 | 360,097,920 |
| Size | 353.5 MB | 343.4 MB |
| Events in quadrant A | 2,246,704 | 2,160,676 |
| Events in quadrant B | 2,092,104 | 2,077,486 |
| Events in quadrant C | 2,212,210 | 2,040,218 |
| Events in quadrant D | 1,896,780 | 1,851,811 |
| Mode SS | |||
|---|---|---|---|
| Quadrant | BADHDUFLAG | Total packets | Discarded packets |
| A | 0 | 828 | 0 |
| B | 0 | 828 | 0 |
| C | 0 | 828 | 0 |
| D | 0 | 828 | 0 |
| Mode M9 | |||
|---|---|---|---|
| Quadrant | BADHDUFLAG | Total packets | Discarded packets |
| A | 0 | 46 | 0 |
| B | 0 | 46 | 0 |
| C | 0 | 46 | 0 |
| D | 0 | 46 | 0 |
| Mode M0 | |||
|---|---|---|---|
| Quadrant | BADHDUFLAG | Total packets | Discarded packets |
| A | 0 | 90974 | 0 |
| B | 0 | 106792 | 0 |
| C | 0 | 84134 | 0 |
| D | 0 | 104739 | 0 |
| Quadrant | Total seconds | Saturated seconds | Saturation percentage |
|---|---|---|---|
| A | 40394 | 597 | 1.477942% |
| B | 40394 | 2669 | 6.607417% |
| C | 40394 | 261 | 0.646136% |
| D | 40394 | 1646 | 4.074863% |
Noise dominated data is calculated using 1-second bins in cleaned event files. If a bin has >2000 counts, and if more than 50% of those come from <1% of pixels, then it is considered to be noise-dominated and hence unusable.
| Quadrant | # 1 sec bins | Bins with >0 counts | Bins with >2000 counts | High rate bins dominated by noise | Noise dominated (total time) | Noise dominated (detector-on time) | Marked lightcurve |
|---|---|---|---|---|---|---|---|
| A | 45274 | 40393 | 0 | 0 | 0.00% | 0.00% |  |
| B | 45274 | 40267 | 0 | 0 | 0.00% | 0.00% |  |
| C | 45274 | 40394 | 0 | 0 | 0.00% | 0.00% |  |
| D | 45273 | 40313 | 0 | 0 | 0.00% | 0.00% |  |
Top three noisy pixels from each quadrant. If the there are fewer than three noisy pixels in the level2.evt file, extra rows are filled as -1
| Pixel properties | Quadrant properties | ||||||
|---|---|---|---|---|---|---|---|
| Quadrant | DetID | PixID | Counts | Sigma | Mean | Median | Sigma |
| A | 0 | 29 | 2159 | 11.02 | 585 | 548 | 146.2 |
| A | 7 | 110 | 1817 | 8.68 | 585 | 548 | 146.2 |
| A | 9 | 19 | 1747 | 8.2 | 585 | 548 | 146.2 |
| B | 2 | 9 | 1858 | 11.84 | 552 | 525 | 112.6 |
| B | 3 | 17 | 1435 | 8.08 | 552 | 525 | 112.6 |
| B | 14 | 254 | 1383 | 7.62 | 552 | 525 | 112.6 |
| C | 1 | 80 | 1623 | 7.08 | 584 | 542 | 152.6 |
| C | 12 | 241 | 1586 | 6.84 | 584 | 542 | 152.6 |
| C | 1 | 81 | 1582 | 6.82 | 584 | 542 | 152.6 |
| D | 3 | 14 | 1441 | 6.58 | 541 | 493 | 144.1 |
| D | 6 | 231 | 1342 | 5.89 | 541 | 493 | 144.1 |
| D | 7 | 3 | 1329 | 5.8 | 541 | 493 | 144.1 |
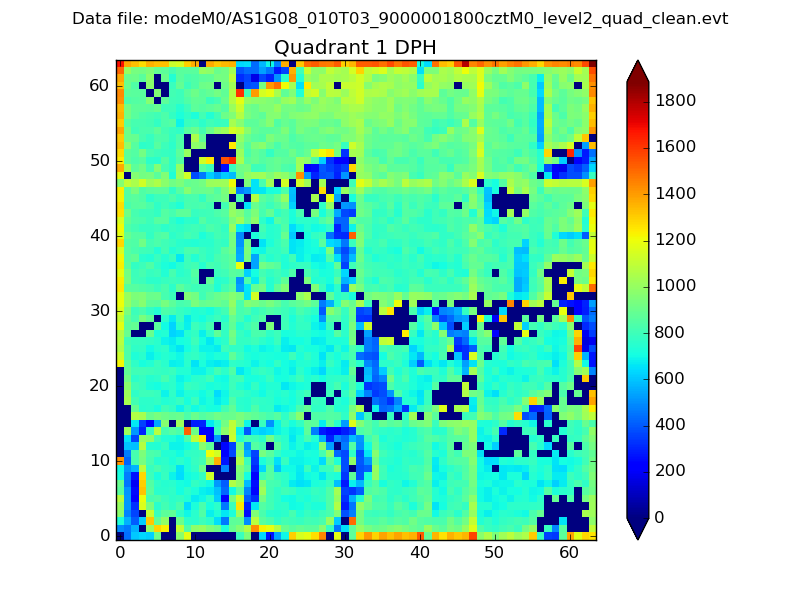
Histogram calculated using DETX and DETY for each event in the final _common_clean file
| Quadrant A |  |
 |
Quadrant B |
|---|---|---|---|
| Quadrant D |  |
 |
Quadrant C |
| Plot type | Count rate plots | Images |
|---|---|---|
| Comparison with Poisson distribution Blue bars denote a histogram of data divided into 1 sec bins. Red curve is a Poisson curve with rate = median count rate of data. |
 |
 |
| Quadrant-wise count rates Data is divided into 100 sec bins |
 |
|
| Module-wise count rates for Quadrant A Data is divided into 100 sec bins |
 |
 |
| Module-wise count rates for Quadrant B Data is divided into 100 sec bins |
 |
 |
| Module-wise count rates for Quadrant C Data is divided into 100 sec bins |
 |
 |
| Module-wise count rates for Quadrant D Data is divided into 100 sec bins |
 |
 |
| Parameter | Plot |
|---|---|
| CZT HV Monitor |  |
| D_VDD |  |
| Temperature 1 |  |
| Veto HV Monitor |  |
| Veto LLD |  |
| Alpha Counter |  |
| _CPM_Rate |  |
| CZT Counter |  |
| +2.5 Volts monitor |  |
| +5 Volts monitor |  |
| _ROLL_ROT |  |
| _Roll_DEC |  |
| _Roll_RA |  |
| Veto Counter |  |