| Param | Original file | Final file |
|---|---|---|
| Filename | modeM0/AS1G08_010T03_9000001800_12195cztM0_level2.evt | modeM0/AS1G08_010T03_9000001800_12195cztM0_level2_quad_clean.evt |
| Size (bytes) | 978,503,040 | 178,329,600 |
| Size | 933.2 MB | 170.1 MB |
| Events in quadrant A | 6,736,336 | 1,147,926 |
| Events in quadrant B | 8,133,373 | 1,130,780 |
| Events in quadrant C | 5,896,662 | 1,138,777 |
| Events in quadrant D | 7,981,764 | 1,078,192 |
| Mode SS | |||
|---|---|---|---|
| Quadrant | BADHDUFLAG | Total packets | Discarded packets |
| A | 0 | 270 | 0 |
| B | 0 | 270 | 0 |
| C | 0 | 270 | 0 |
| D | 0 | 270 | 0 |
| Mode M9 | |||
|---|---|---|---|
| Quadrant | BADHDUFLAG | Total packets | Discarded packets |
| A | 0 | 16 | 0 |
| B | 0 | 16 | 0 |
| C | 0 | 16 | 0 |
| D | 0 | 16 | 0 |
| Mode M0 | |||
|---|---|---|---|
| Quadrant | BADHDUFLAG | Total packets | Discarded packets |
| A | 0 | 28986 | 4 |
| B | 0 | 33178 | 3 |
| C | 0 | 27067 | 3 |
| D | 0 | 33257 | 3 |
| Quadrant | Total seconds | Saturated seconds | Saturation percentage |
|---|---|---|---|
| A | 13093 | 130 | 0.992897% |
| B | 13093 | 570 | 4.353471% |
| C | 13093 | 55 | 0.420072% |
| D | 13093 | 528 | 4.032689% |
Noise dominated data is calculated using 1-second bins in cleaned event files. If a bin has >2000 counts, and if more than 50% of those come from <1% of pixels, then it is considered to be noise-dominated and hence unusable.
| Quadrant | # 1 sec bins | Bins with >0 counts | Bins with >2000 counts | High rate bins dominated by noise | Noise dominated (total time) | Noise dominated (detector-on time) | Marked lightcurve |
|---|---|---|---|---|---|---|---|
| A | 14749 | 13097 | 5 | 5 | 0.03% | 0.04% | 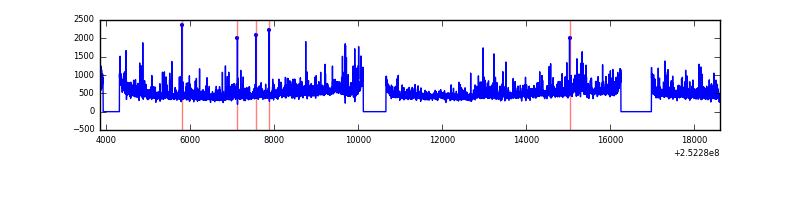 |
| B | 14749 | 13097 | 279 | 279 | 1.89% | 2.13% | 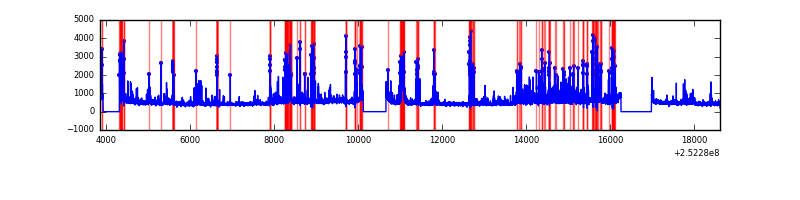 |
| C | 14749 | 13097 | 6 | 6 | 0.04% | 0.05% | 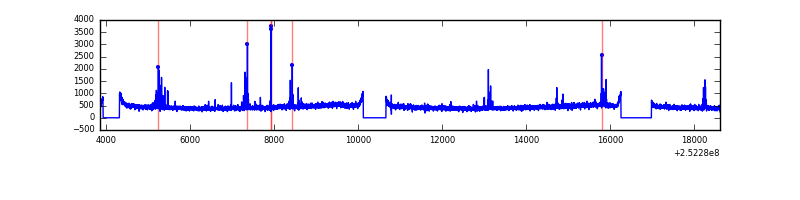 |
| D | 14749 | 13097 | 421 | 421 | 2.85% | 3.21% | 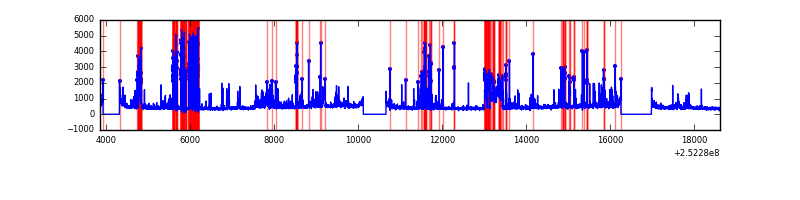 |
Top three noisy pixels from each quadrant. If the there are fewer than three noisy pixels in the level2.evt file, extra rows are filled as -1
| Pixel properties | Quadrant properties | ||||||
|---|---|---|---|---|---|---|---|
| Quadrant | DetID | PixID | Counts | Sigma | Mean | Median | Sigma |
| A | 1 | 162 | 244509 | 795.92 | 1507 | 1475 | 305.3 |
| A | 8 | 15 | 182429 | 592.61 | 1507 | 1475 | 305.3 |
| A | 1 | 178 | 124508 | 402.93 | 1507 | 1475 | 305.3 |
| B | 4 | 239 | 1571910 | 5542.84 | 1487 | 1451 | 283.3 |
| B | 15 | 204 | 473578 | 1666.34 | 1487 | 1451 | 283.3 |
| B | 11 | 51 | 102911 | 358.1 | 1487 | 1451 | 283.3 |
| C | 15 | 208 | 148291 | 436.61 | 1462 | 1466 | 336.3 |
| C | 14 | 234 | 11980 | 31.26 | 1462 | 1466 | 336.3 |
| C | 13 | 61 | 10877 | 27.98 | 1462 | 1466 | 336.3 |
| D | 1 | 52 | 1462272 | 4234.79 | 1434 | 1390 | 345.0 |
| D | 10 | 157 | 266651 | 768.94 | 1434 | 1390 | 345.0 |
| D | 13 | 104 | 196283 | 564.95 | 1434 | 1390 | 345.0 |
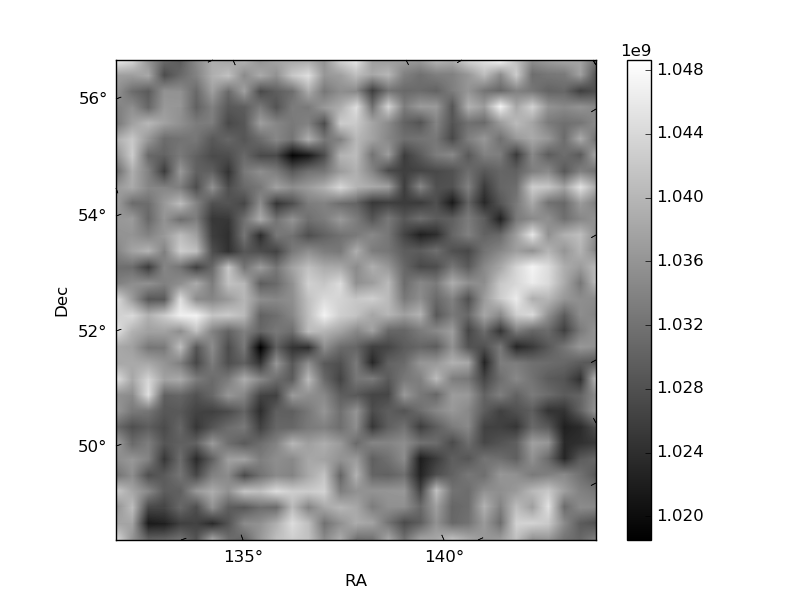
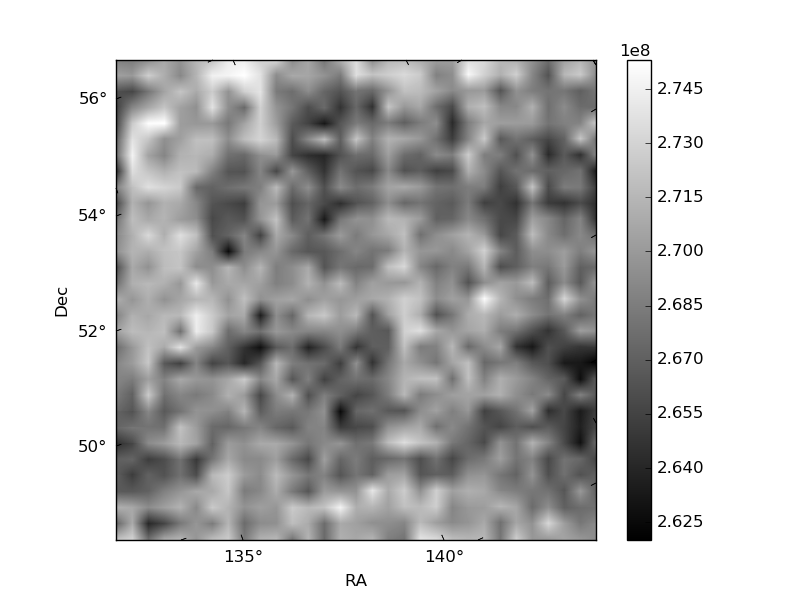
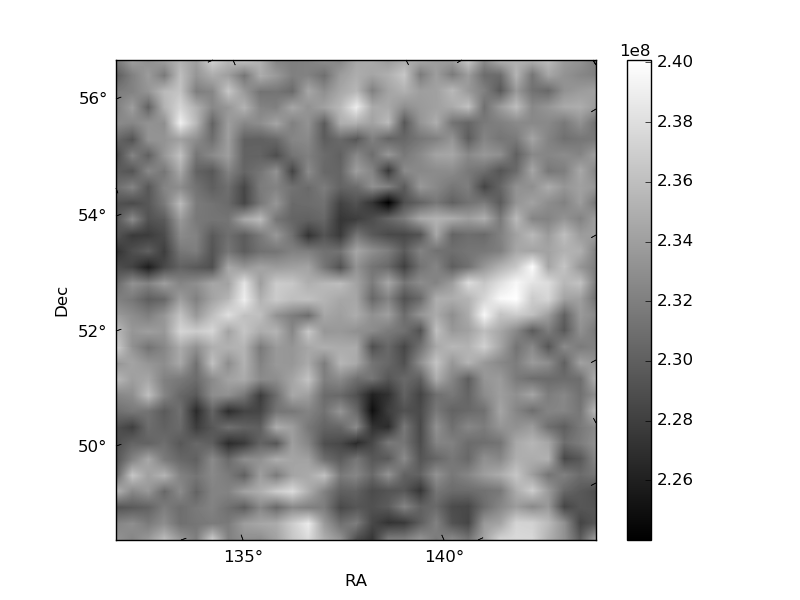
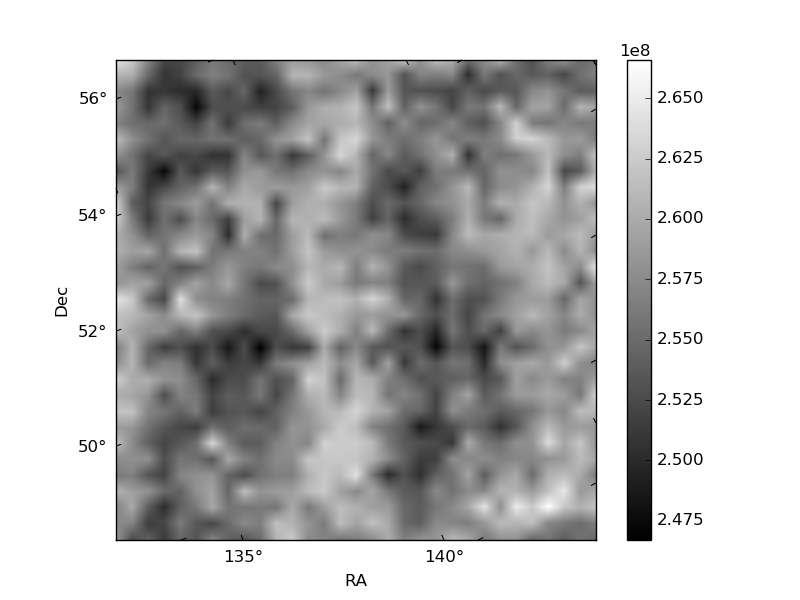
Histogram calculated using DETX and DETY for each event in the final _common_clean file
| Quadrant A | 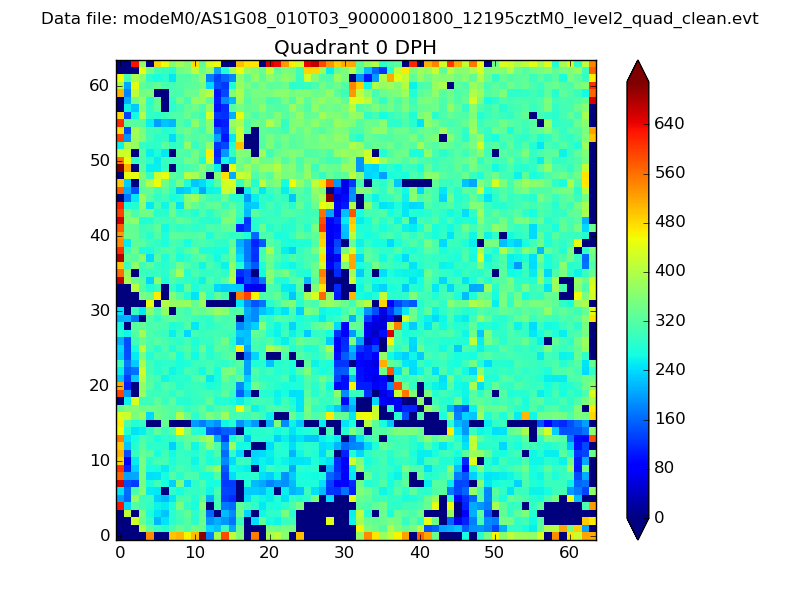 |
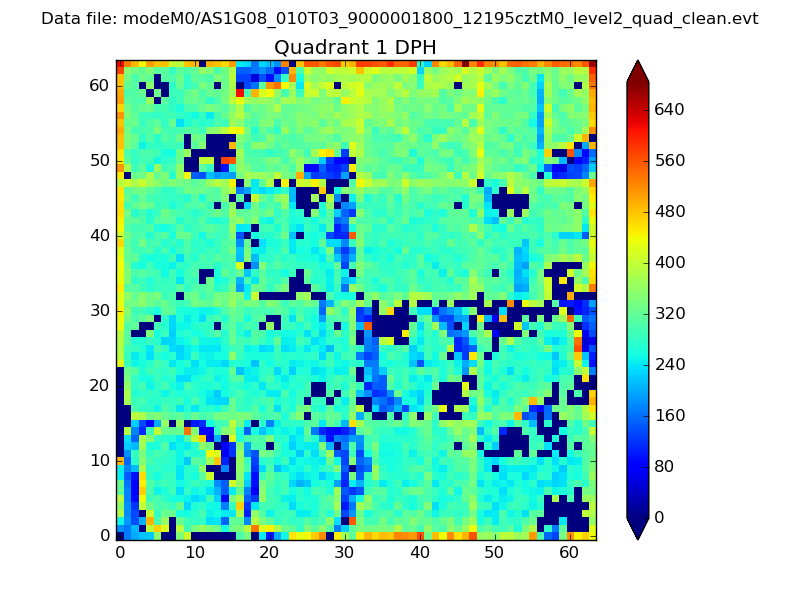 |
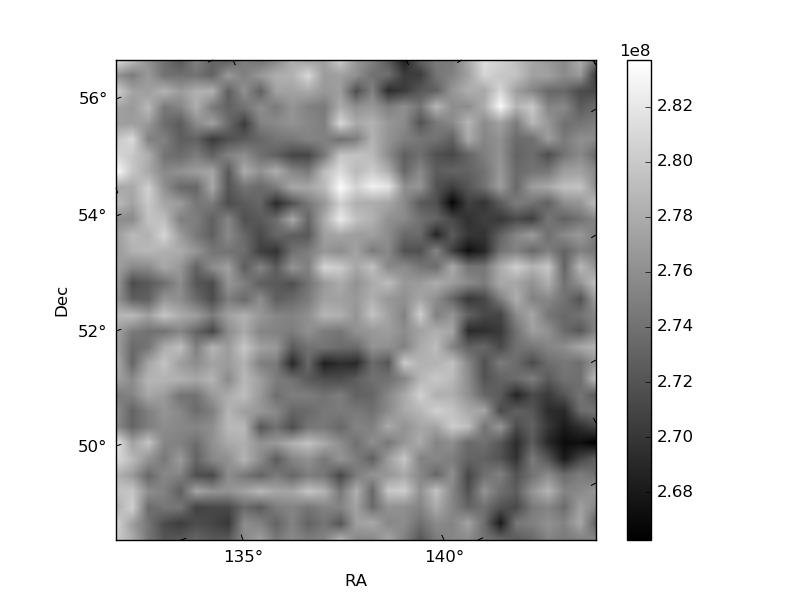
Quadrant B |
|---|---|---|---|
| Quadrant D | 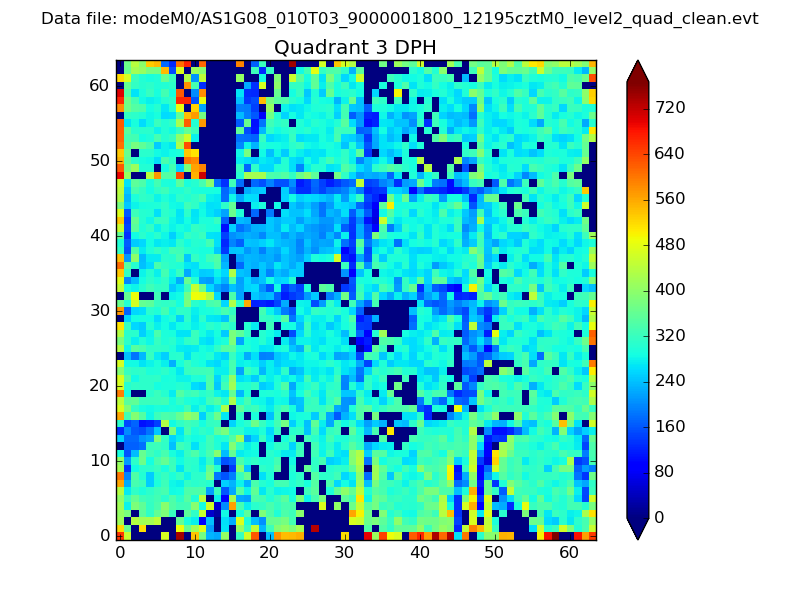 |
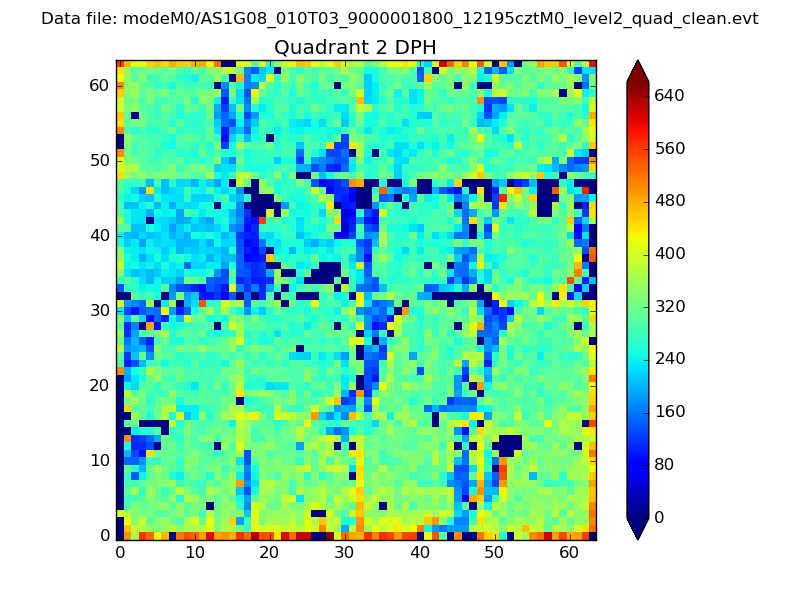 |
Quadrant C |
| Plot type | Count rate plots | Images |
|---|---|---|
| Comparison with Poisson distribution Blue bars denote a histogram of data divided into 1 sec bins. Red curve is a Poisson curve with rate = median count rate of data. |
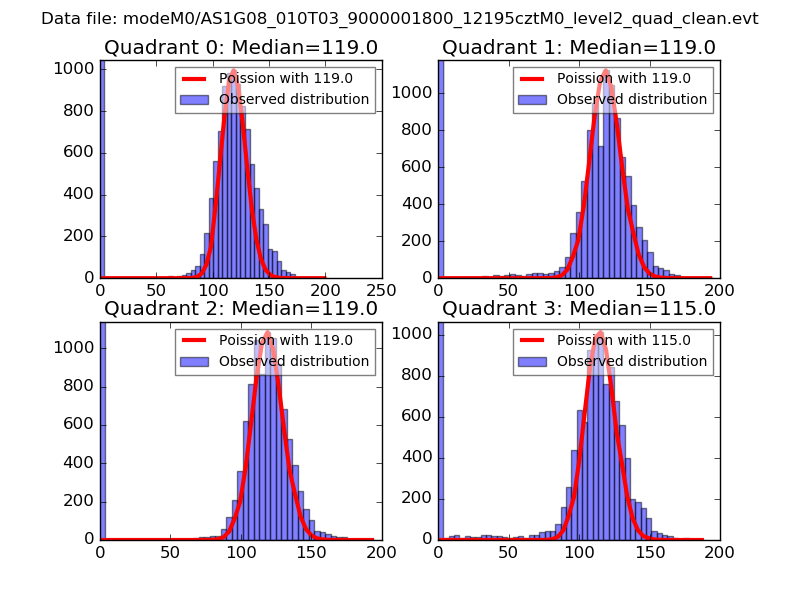 |
 |
| Quadrant-wise count rates Data is divided into 100 sec bins |
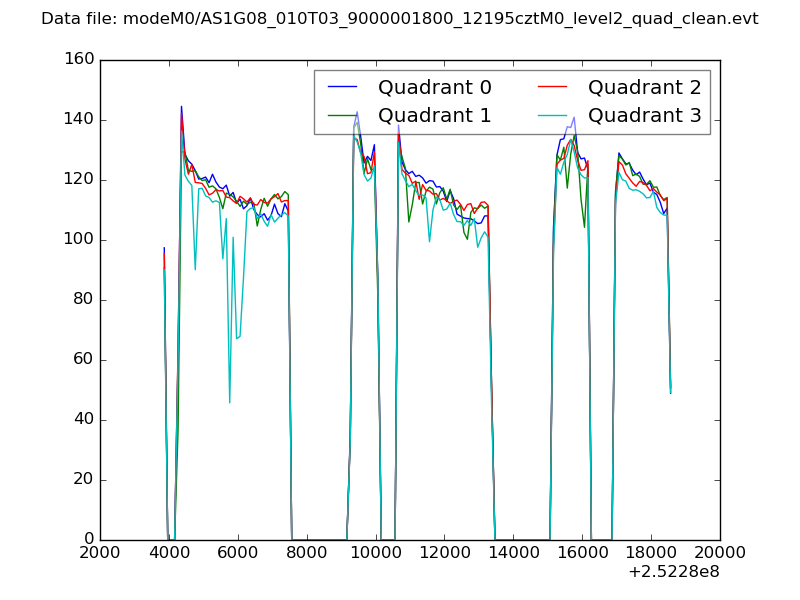 |
|
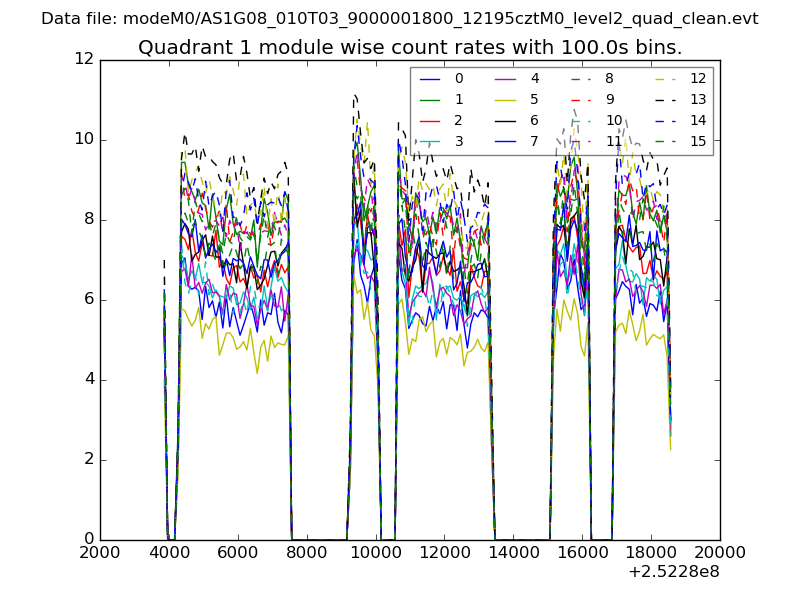
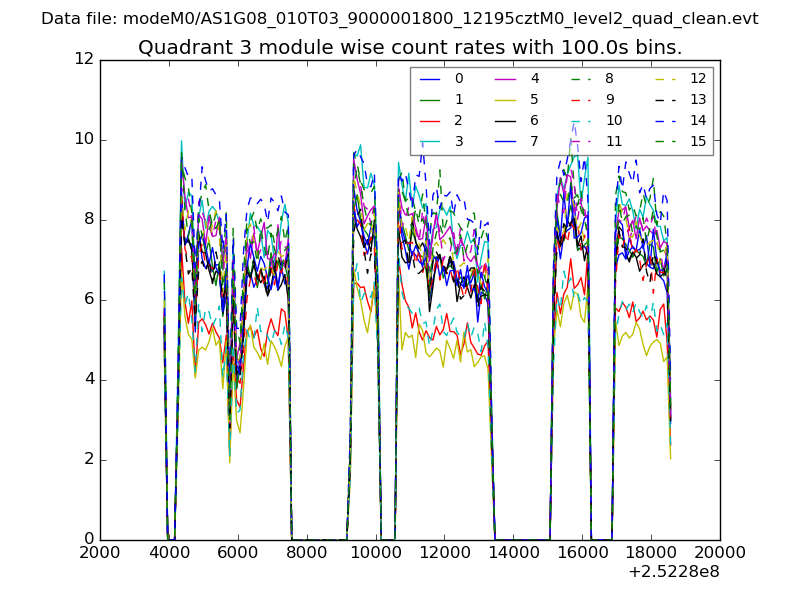
| Module-wise count rates for Quadrant A Data is divided into 100 sec bins |
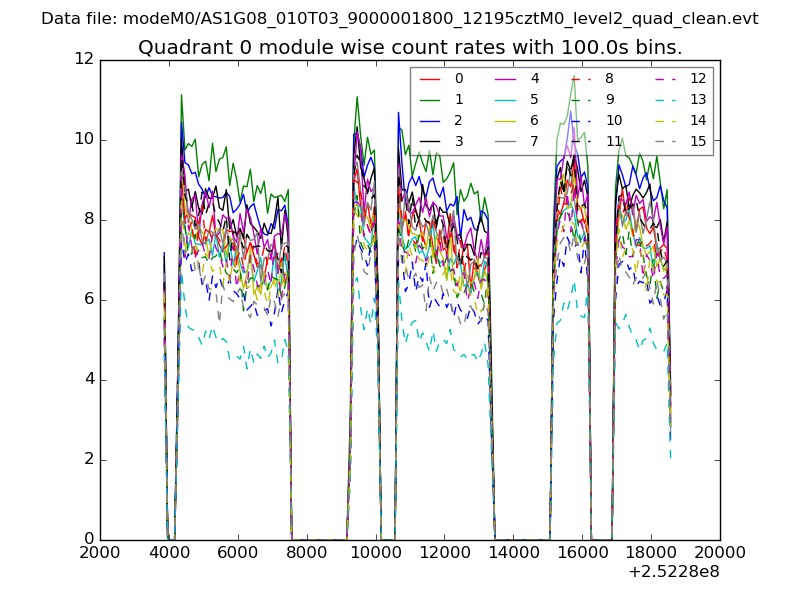 |
 |
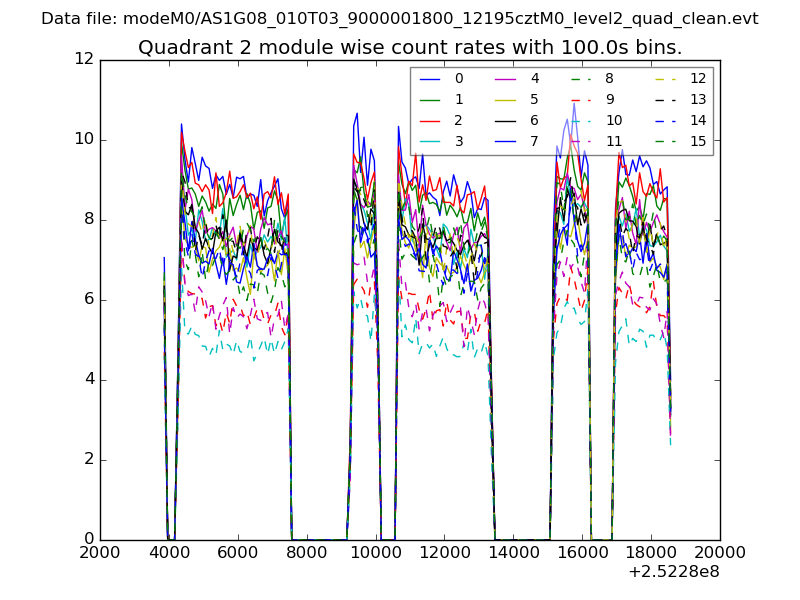
| Module-wise count rates for Quadrant B Data is divided into 100 sec bins |
 |
 |
| Module-wise count rates for Quadrant C Data is divided into 100 sec bins |
 |
 |
| Module-wise count rates for Quadrant D Data is divided into 100 sec bins |
 |
 |
| Parameter | Plot |
|---|---|
| CZT HV Monitor | 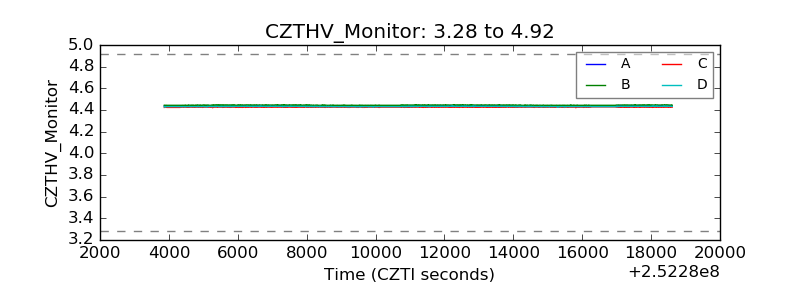 |
| D_VDD | 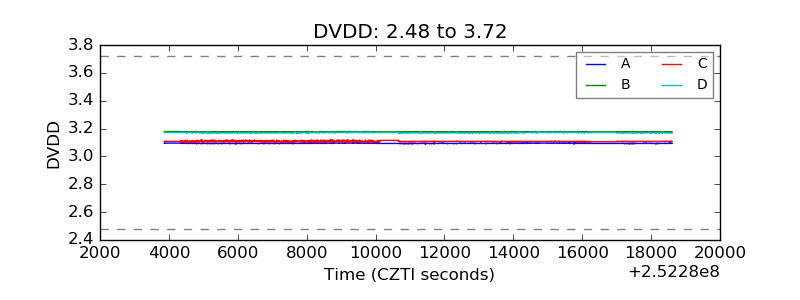 |
| Temperature 1 | 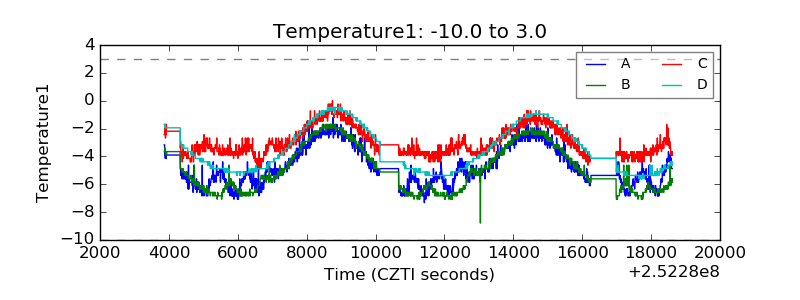 |
| Veto HV Monitor | 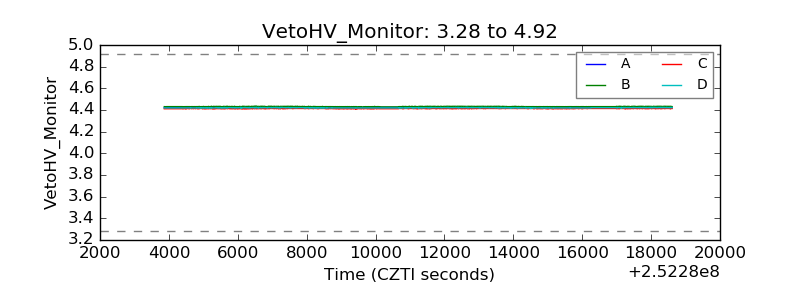 |
| Veto LLD | 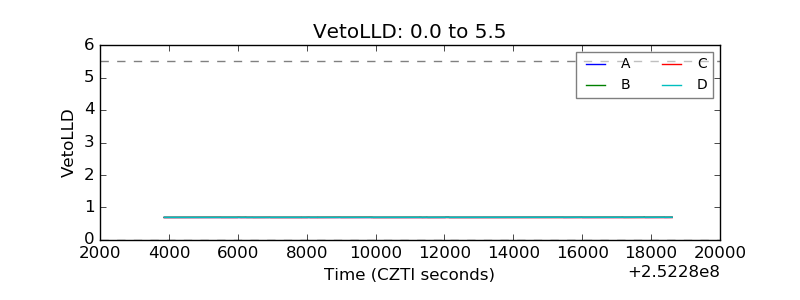 |
| Alpha Counter | 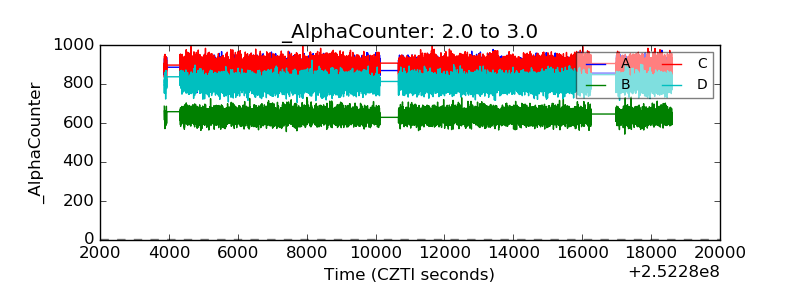 |
| _CPM_Rate | 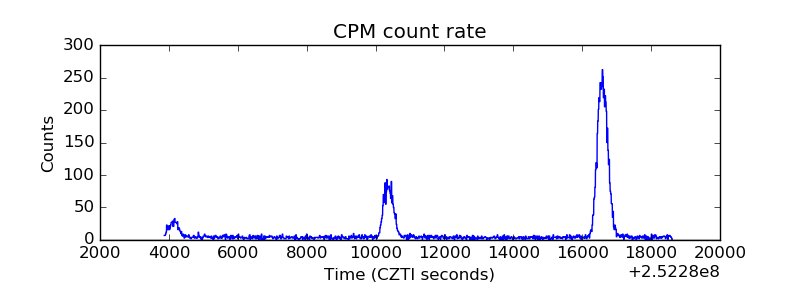 |
| CZT Counter | 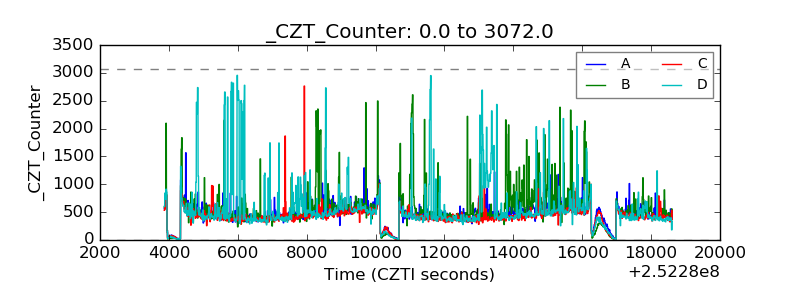 |
| +2.5 Volts monitor |  |
| +5 Volts monitor |  |
| _ROLL_ROT | 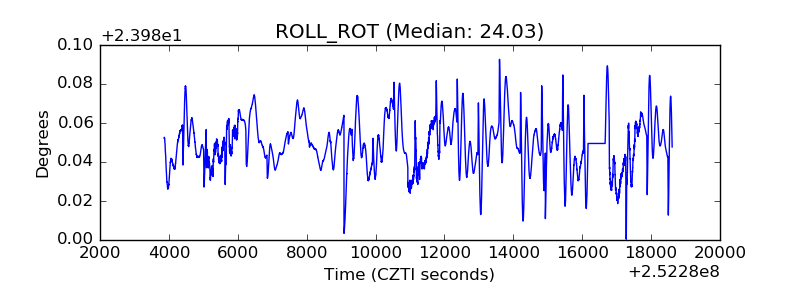 |
| _Roll_DEC | 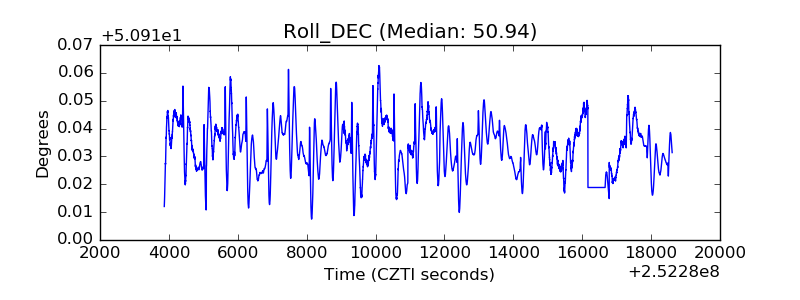 |
| _Roll_RA | 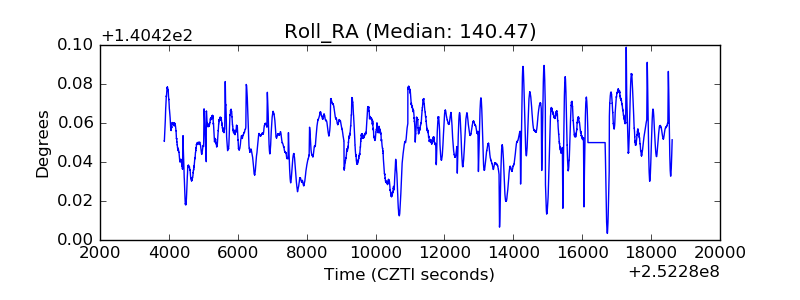 |
| Veto Counter | 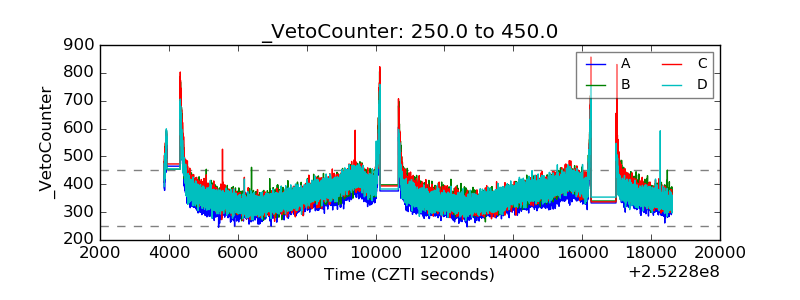 |