| Param | Original file | Final file |
|---|---|---|
| Filename | modeM0/AS1G08_010T03_9000001800_12196cztM0_level2.evt | modeM0/AS1G08_010T03_9000001800_12196cztM0_level2_quad_clean.evt |
| Size (bytes) | 472,754,880 | 89,573,760 |
| Size | 450.9 MB | 85.4 MB |
| Events in quadrant A | 3,404,091 | 574,412 |
| Events in quadrant B | 3,834,251 | 571,451 |
| Events in quadrant C | 3,018,953 | 571,007 |
| Events in quadrant D | 3,620,044 | 543,958 |
| Mode SS | |||
|---|---|---|---|
| Quadrant | BADHDUFLAG | Total packets | Discarded packets |
| A | 0 | 134 | 0 |
| B | 0 | 134 | 0 |
| C | 0 | 134 | 0 |
| D | 0 | 134 | 0 |
| Mode M9 | |||
|---|---|---|---|
| Quadrant | BADHDUFLAG | Total packets | Discarded packets |
| A | 0 | 8 | 0 |
| B | 0 | 8 | 0 |
| C | 0 | 8 | 0 |
| D | 0 | 8 | 0 |
| Mode M0 | |||
|---|---|---|---|
| Quadrant | BADHDUFLAG | Total packets | Discarded packets |
| A | 0 | 14426 | 2 |
| B | 0 | 15709 | 1 |
| C | 0 | 13725 | 1 |
| D | 0 | 15424 | 1 |
| Quadrant | Total seconds | Saturated seconds | Saturation percentage |
|---|---|---|---|
| A | 6467 | 99 | 1.530849% |
| B | 6467 | 264 | 4.082264% |
| C | 6467 | 58 | 0.896861% |
| D | 6467 | 225 | 3.479202% |
Noise dominated data is calculated using 1-second bins in cleaned event files. If a bin has >2000 counts, and if more than 50% of those come from <1% of pixels, then it is considered to be noise-dominated and hence unusable.
| Quadrant | # 1 sec bins | Bins with >0 counts | Bins with >2000 counts | High rate bins dominated by noise | Noise dominated (total time) | Noise dominated (detector-on time) | Marked lightcurve |
|---|---|---|---|---|---|---|---|
| A | 7348 | 6469 | 17 | 17 | 0.23% | 0.26% | 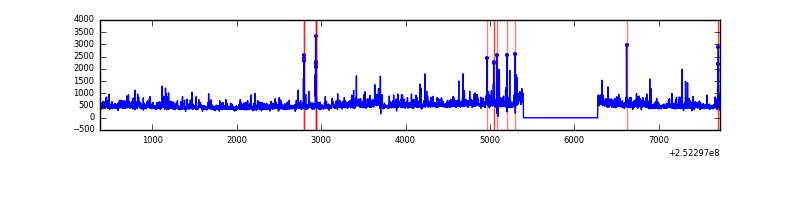 |
| B | 7348 | 6469 | 125 | 125 | 1.70% | 1.93% | 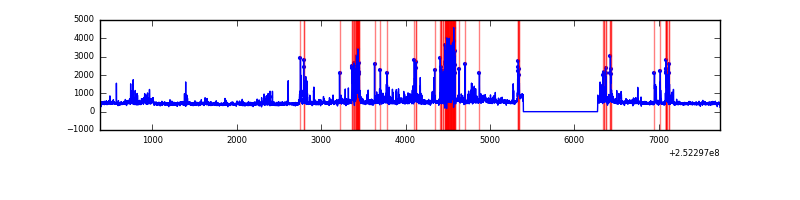 |
| C | 7348 | 6469 | 5 | 5 | 0.07% | 0.08% | 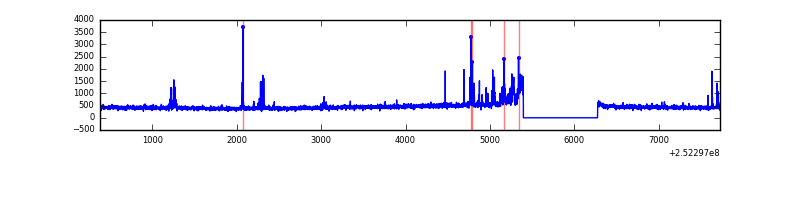 |
| D | 7348 | 6469 | 143 | 143 | 1.95% | 2.21% | 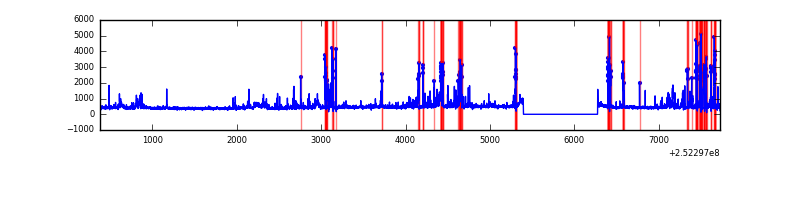 |
Top three noisy pixels from each quadrant. If the there are fewer than three noisy pixels in the level2.evt file, extra rows are filled as -1
| Pixel properties | Quadrant properties | ||||||
|---|---|---|---|---|---|---|---|
| Quadrant | DetID | PixID | Counts | Sigma | Mean | Median | Sigma |
| A | 1 | 162 | 179611 | 1192.44 | 739 | 723 | 150.0 |
| A | 1 | 178 | 94709 | 626.5 | 739 | 723 | 150.0 |
| A | 1 | 161 | 84525 | 558.61 | 739 | 723 | 150.0 |
| B | 4 | 239 | 707852 | 5075.08 | 729 | 713 | 139.3 |
| B | 15 | 204 | 166509 | 1189.9 | 729 | 713 | 139.3 |
| B | 11 | 51 | 56928 | 403.45 | 729 | 713 | 139.3 |
| C | 15 | 208 | 118975 | 716.09 | 713 | 714 | 165.1 |
| C | 5 | 112 | 111698 | 672.03 | 713 | 714 | 165.1 |
| C | 13 | 61 | 5298 | 27.76 | 713 | 714 | 165.1 |
| D | 1 | 52 | 447983 | 2655.47 | 701 | 680 | 168.4 |
| D | 10 | 50 | 168292 | 995.05 | 701 | 680 | 168.4 |
| D | 4 | 95 | 158292 | 935.68 | 701 | 680 | 168.4 |
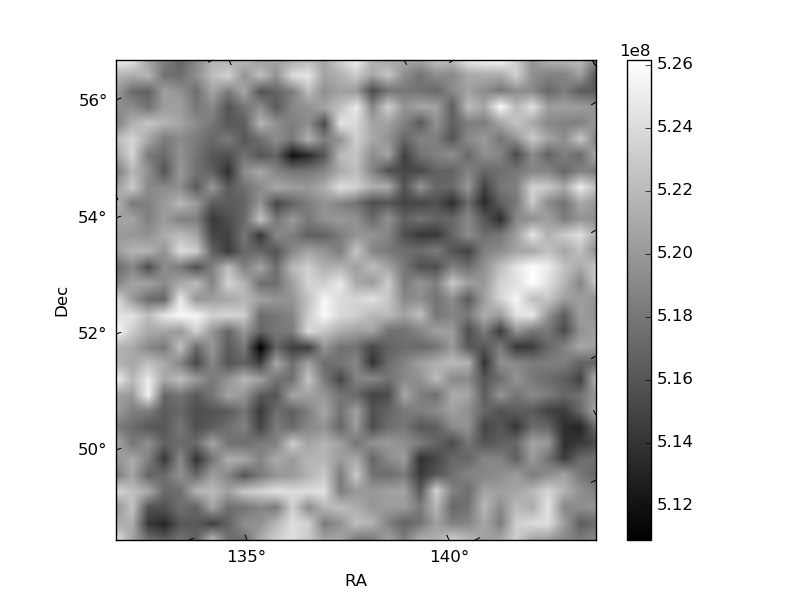
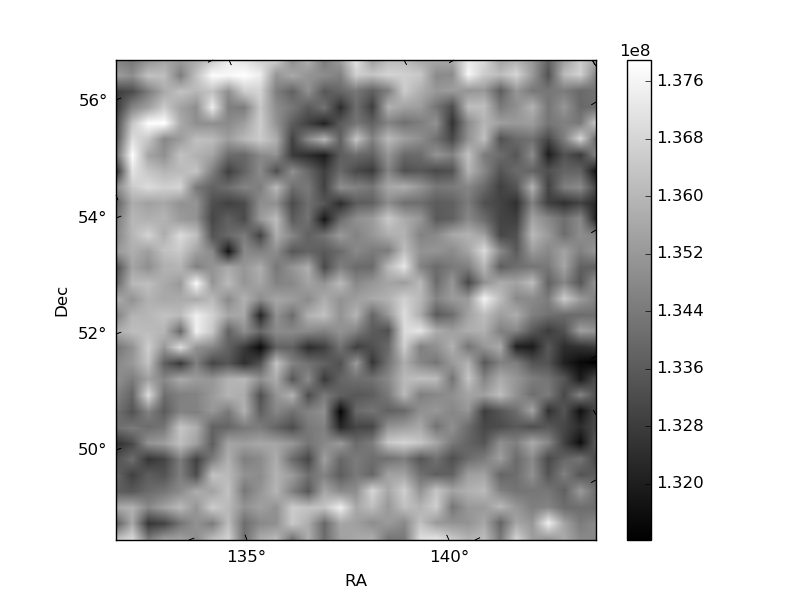
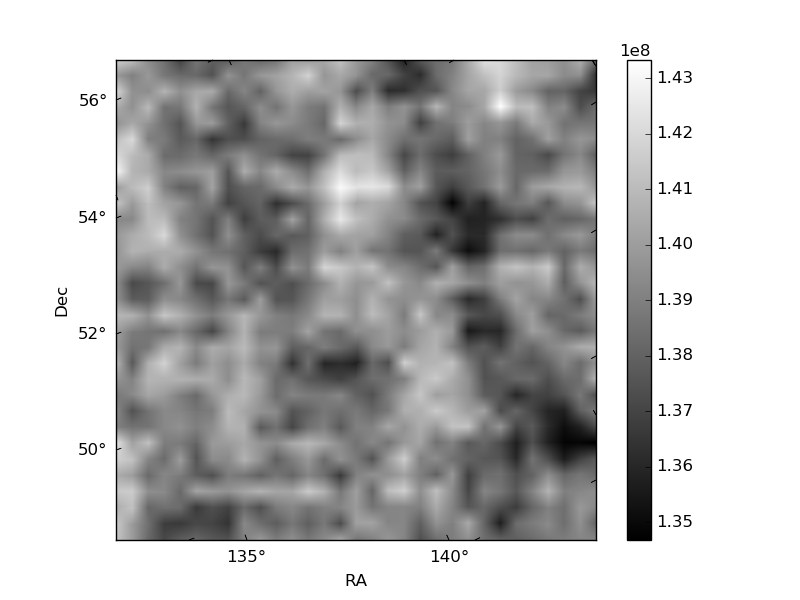
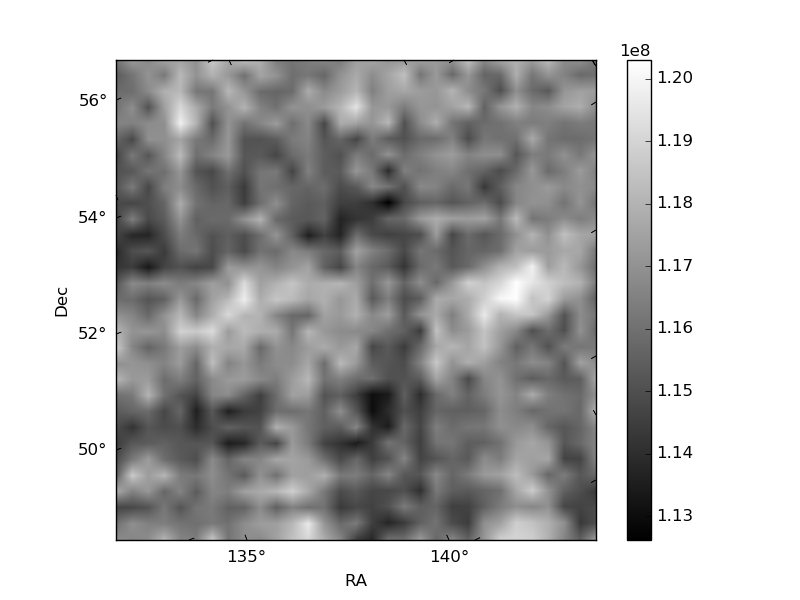
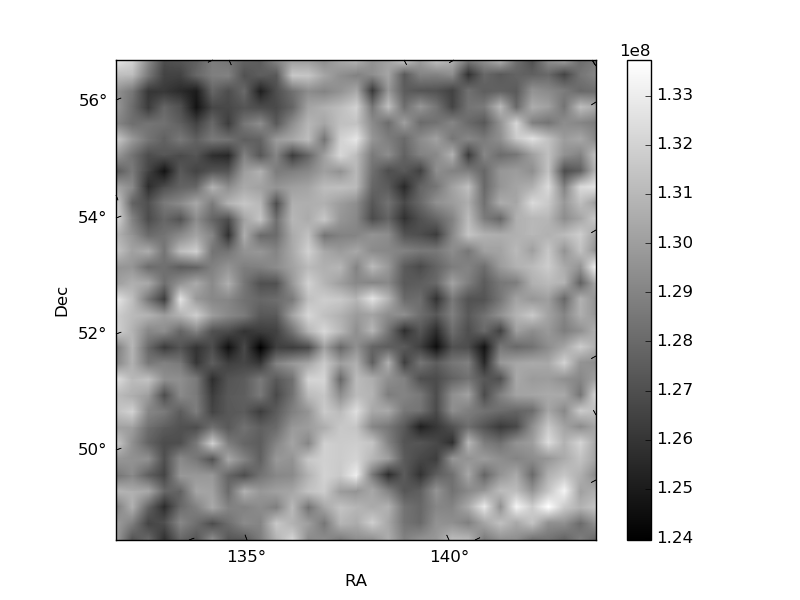
Histogram calculated using DETX and DETY for each event in the final _common_clean file
| Quadrant A | 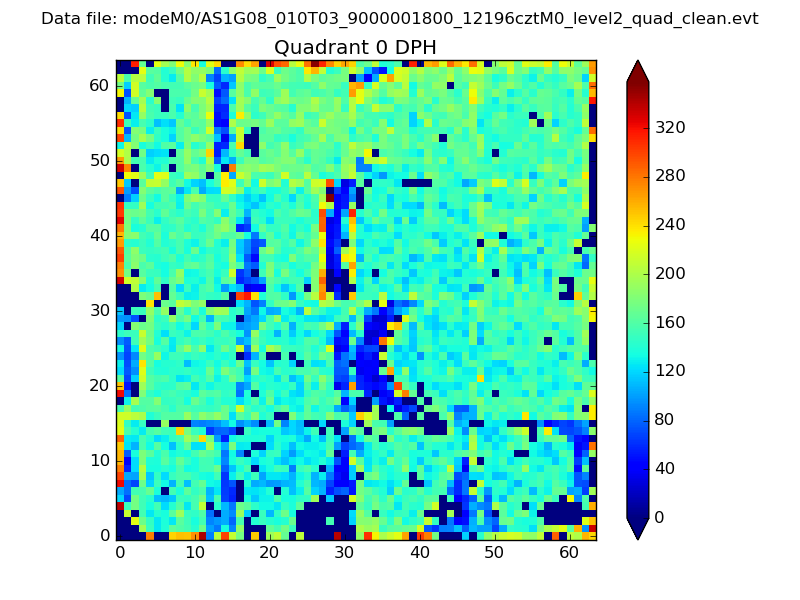 |
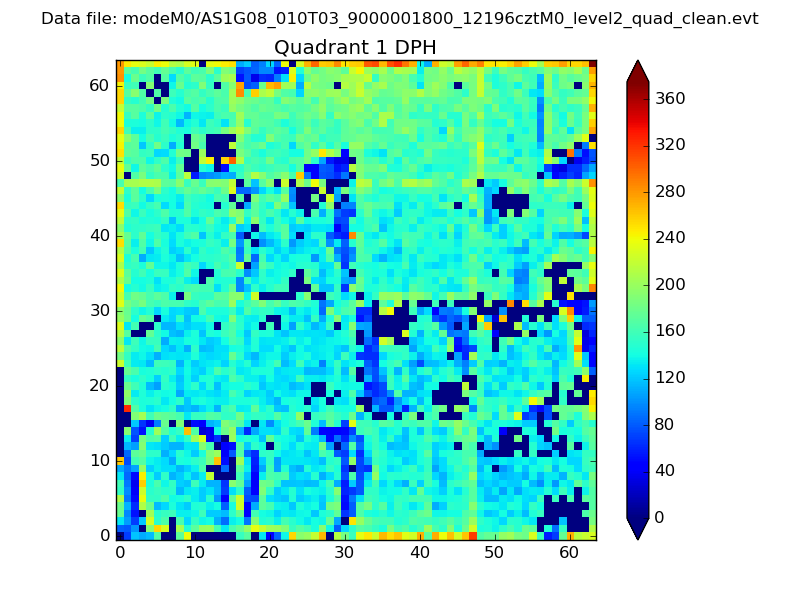 |
Quadrant B |
|---|---|---|---|
| Quadrant D | 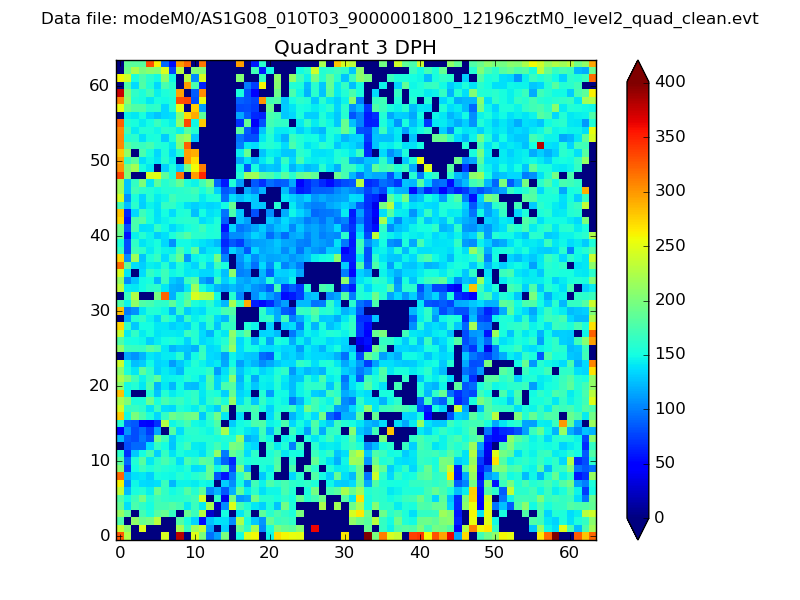 |
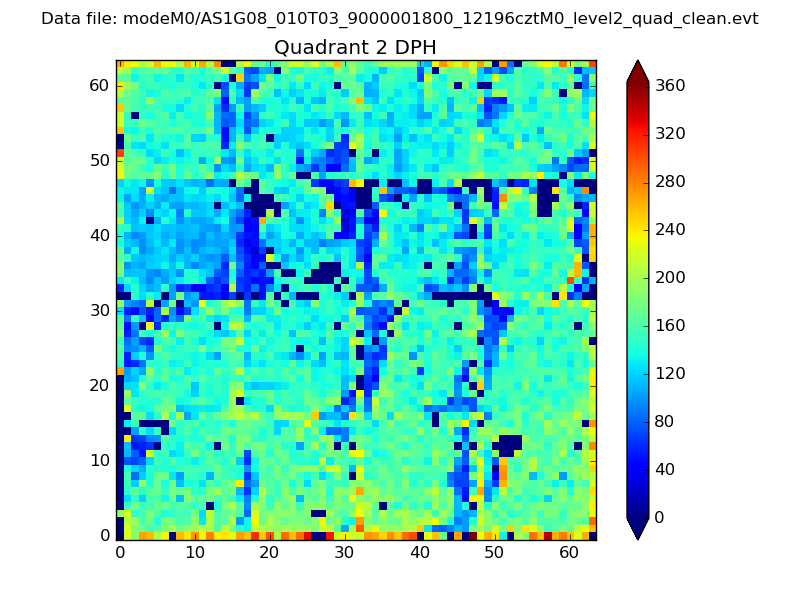 |
Quadrant C |
| Plot type | Count rate plots | Images |
|---|---|---|
| Comparison with Poisson distribution Blue bars denote a histogram of data divided into 1 sec bins. Red curve is a Poisson curve with rate = median count rate of data. |
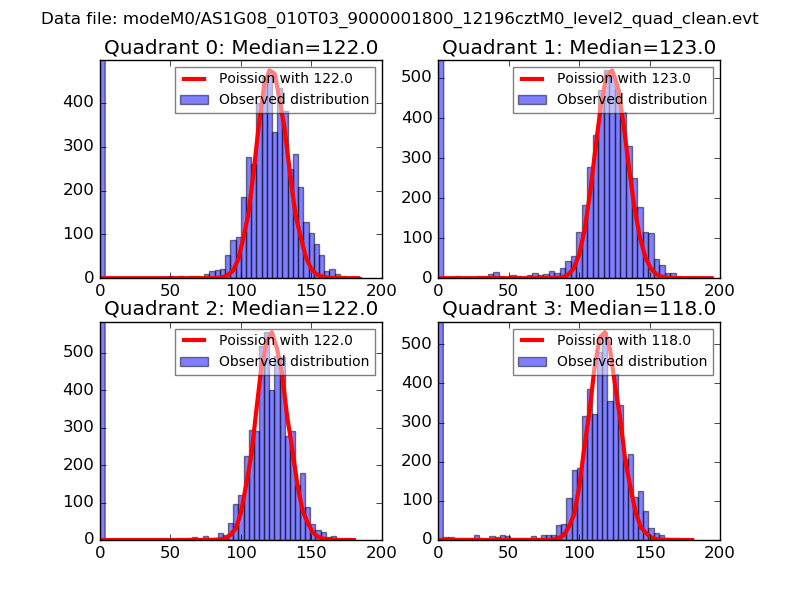 |
 |
| Quadrant-wise count rates Data is divided into 100 sec bins |
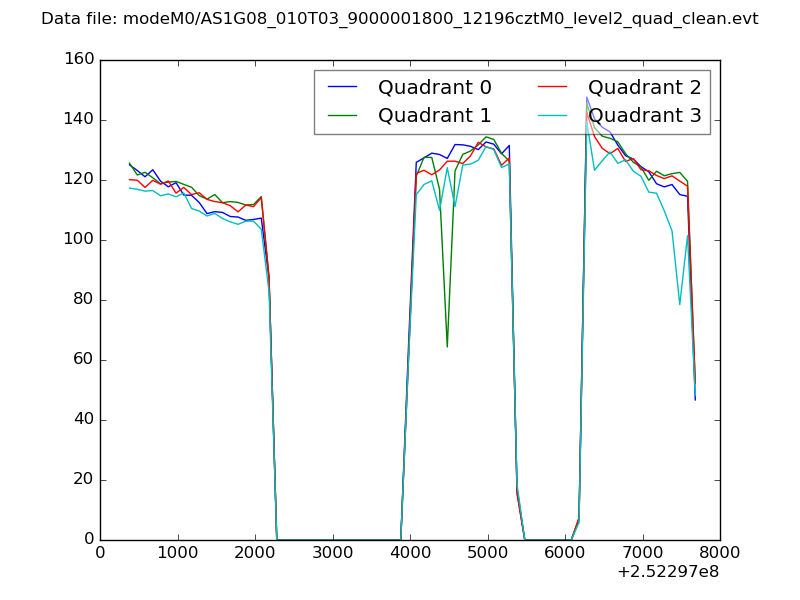 |
|
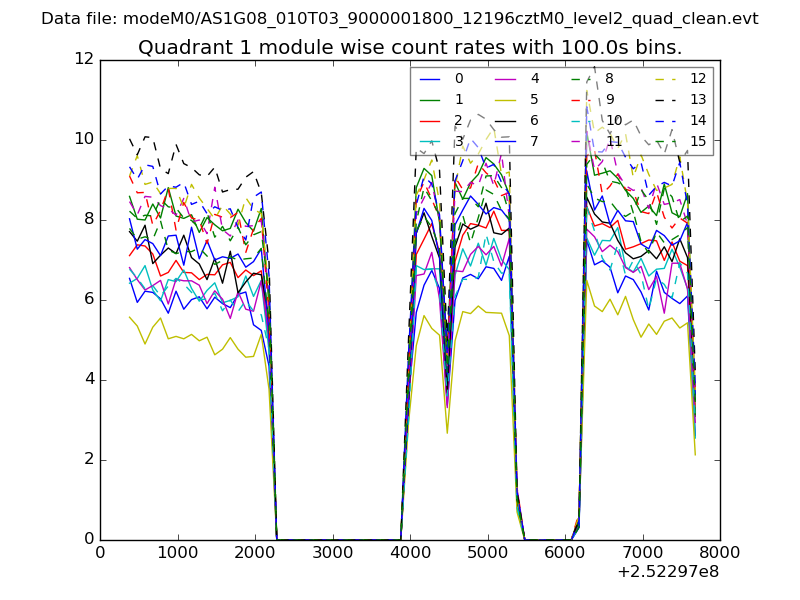
| Module-wise count rates for Quadrant A Data is divided into 100 sec bins |
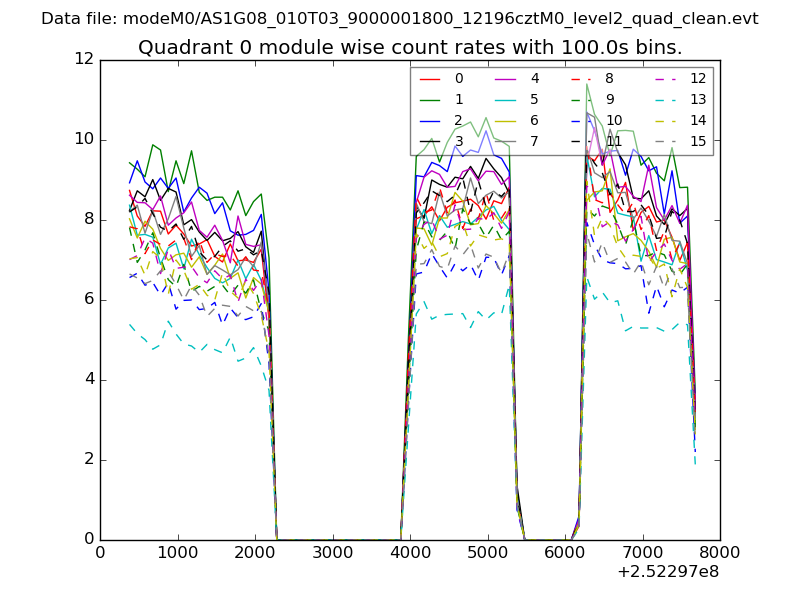 |
 |
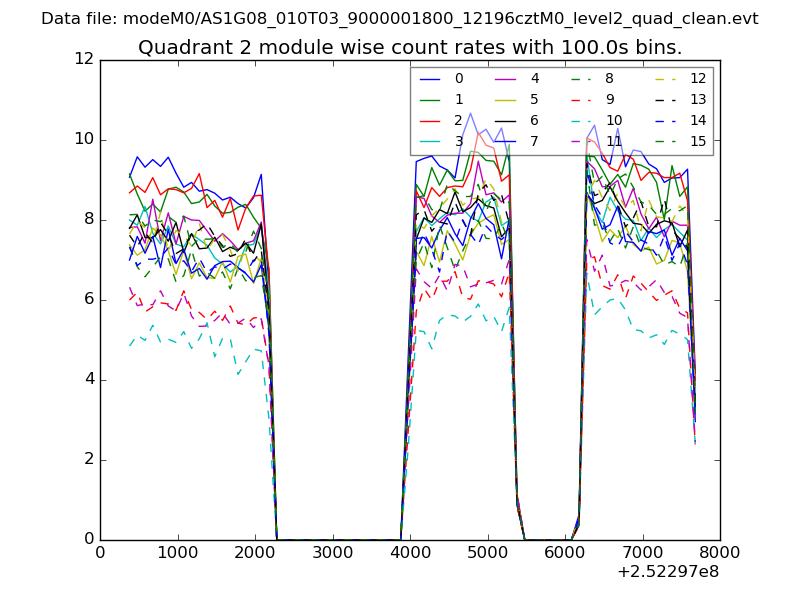
| Module-wise count rates for Quadrant B Data is divided into 100 sec bins |
 |
 |
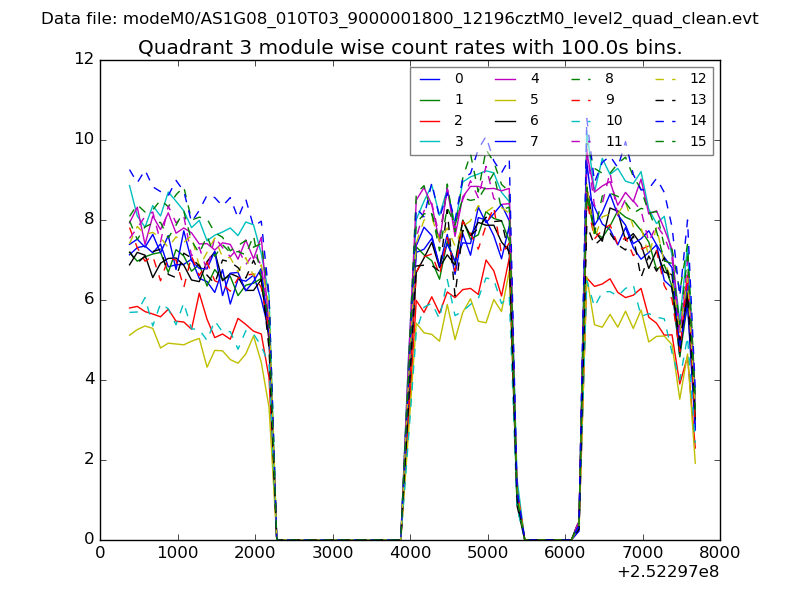
| Module-wise count rates for Quadrant C Data is divided into 100 sec bins |
 |
 |
| Module-wise count rates for Quadrant D Data is divided into 100 sec bins |
 |
 |
| Parameter | Plot |
|---|---|
| CZT HV Monitor | 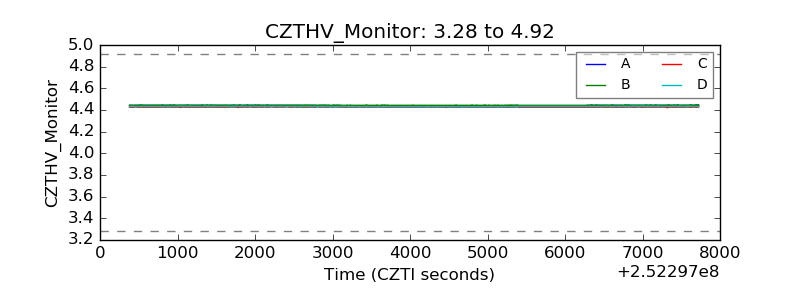 |
| D_VDD | 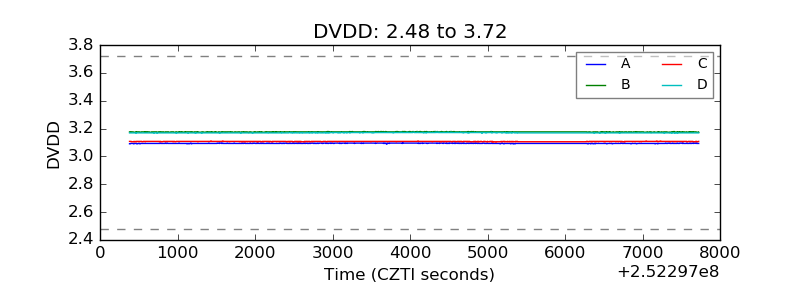 |
| Temperature 1 | 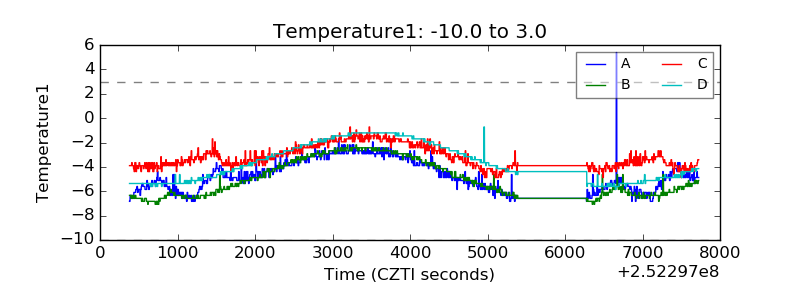 |
| Veto HV Monitor | 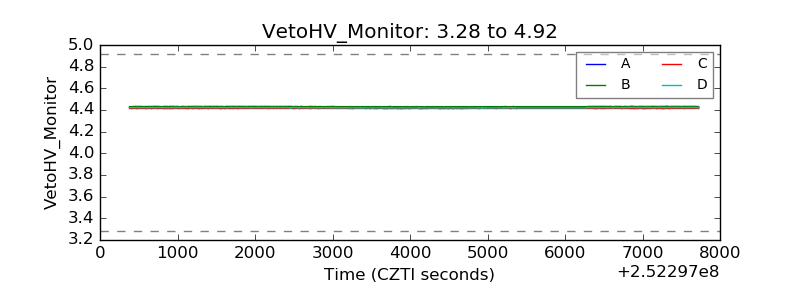 |
| Veto LLD | 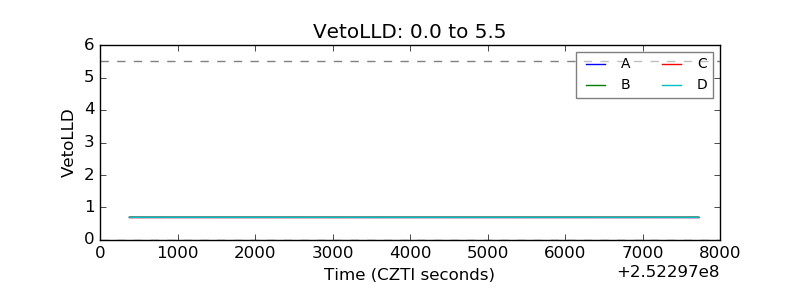 |
| Alpha Counter | 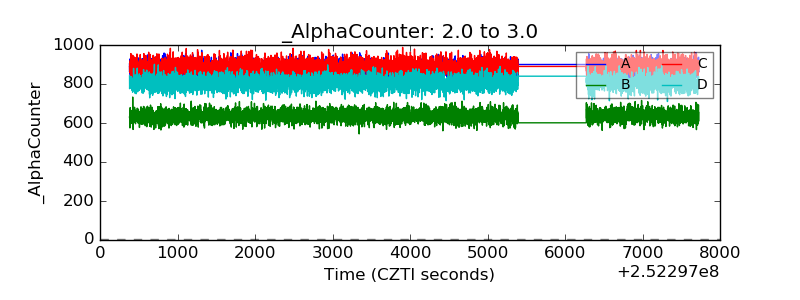 |
| _CPM_Rate | 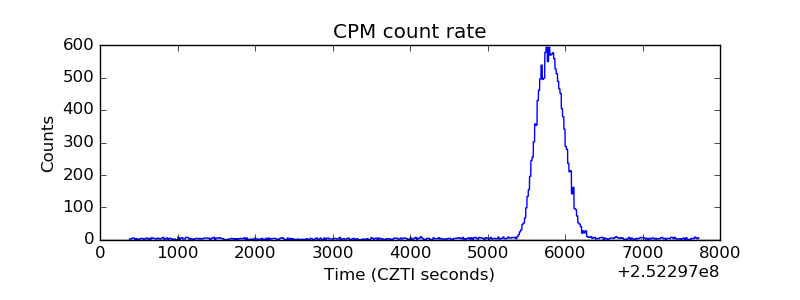 |
| CZT Counter | 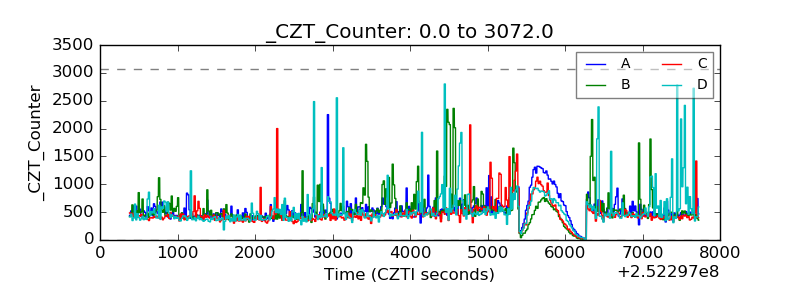 |
| +2.5 Volts monitor |  |
| +5 Volts monitor | 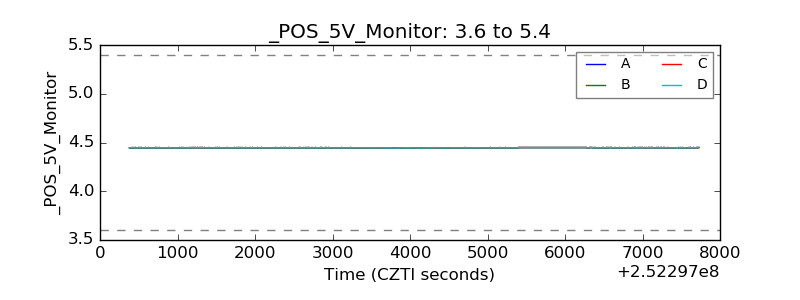 |
| _ROLL_ROT | 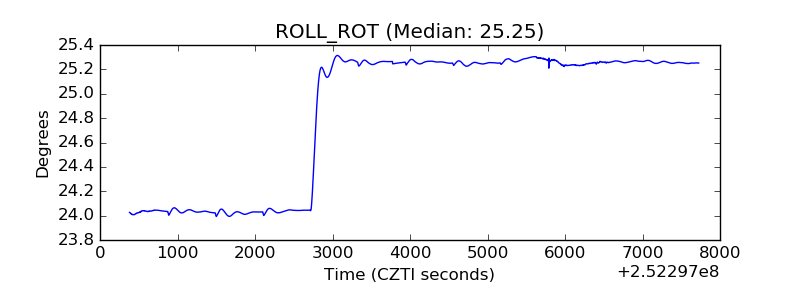 |
| _Roll_DEC | 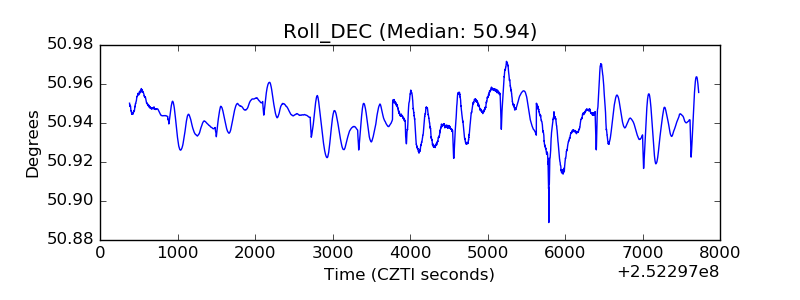 |
| _Roll_RA | 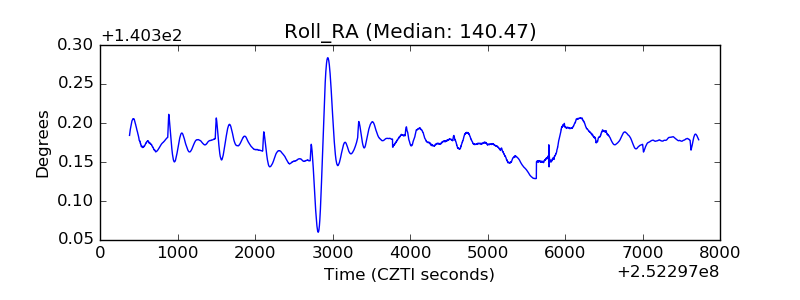 |
| Veto Counter | 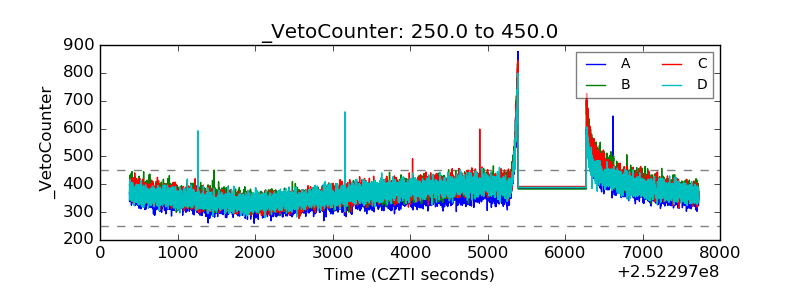 |