| Param | Original file | Final file |
|---|---|---|
| Filename | modeM0/AS1G08_010T03_9000001800_12197cztM0_level2.evt | modeM0/AS1G08_010T03_9000001800_12197cztM0_level2_quad_clean.evt |
| Size (bytes) | 464,578,560 | 84,254,400 |
| Size | 443.1 MB | 80.4 MB |
| Events in quadrant A | 3,109,172 | 544,616 |
| Events in quadrant B | 3,518,611 | 545,412 |
| Events in quadrant C | 2,865,992 | 538,897 |
| Events in quadrant D | 4,166,745 | 501,559 |
| Mode SS | |||
|---|---|---|---|
| Quadrant | BADHDUFLAG | Total packets | Discarded packets |
| A | 0 | 124 | 0 |
| B | 0 | 124 | 0 |
| C | 0 | 124 | 0 |
| D | 0 | 124 | 0 |
| Mode M9 | |||
|---|---|---|---|
| Quadrant | BADHDUFLAG | Total packets | Discarded packets |
| A | 0 | 10 | 0 |
| B | 0 | 10 | 0 |
| C | 0 | 10 | 0 |
| D | 0 | 10 | 0 |
| Mode M0 | |||
|---|---|---|---|
| Quadrant | BADHDUFLAG | Total packets | Discarded packets |
| A | 0 | 13102 | 2 |
| B | 0 | 14354 | 1 |
| C | 0 | 12739 | 1 |
| D | 0 | 16576 | 1 |
| Quadrant | Total seconds | Saturated seconds | Saturation percentage |
|---|---|---|---|
| A | 6021 | 76 | 1.262249% |
| B | 6021 | 195 | 3.238665% |
| C | 6021 | 49 | 0.813818% |
| D | 6021 | 390 | 6.477329% |
Noise dominated data is calculated using 1-second bins in cleaned event files. If a bin has >2000 counts, and if more than 50% of those come from <1% of pixels, then it is considered to be noise-dominated and hence unusable.
| Quadrant | # 1 sec bins | Bins with >0 counts | Bins with >2000 counts | High rate bins dominated by noise | Noise dominated (total time) | Noise dominated (detector-on time) | Marked lightcurve |
|---|---|---|---|---|---|---|---|
| A | 7062 | 6023 | 7 | 7 | 0.10% | 0.12% | 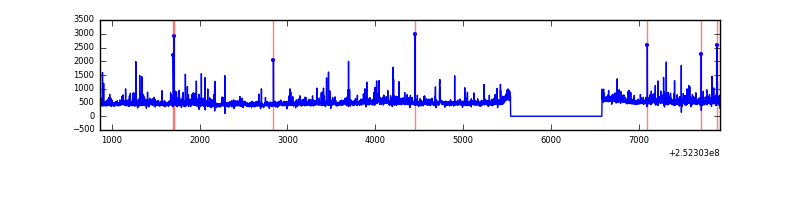 |
| B | 7062 | 6023 | 87 | 87 | 1.23% | 1.44% | 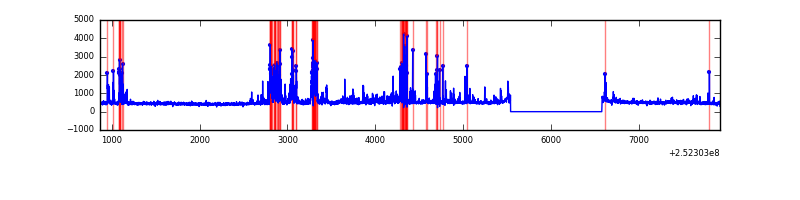 |
| C | 7062 | 6023 | 19 | 19 | 0.27% | 0.32% | 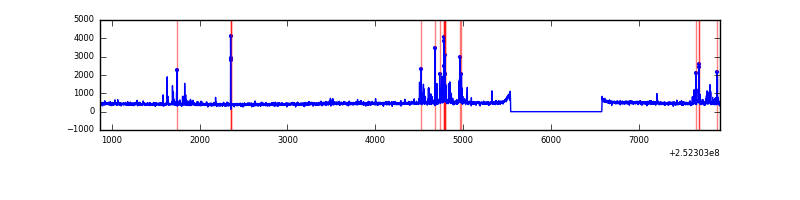 |
| D | 7062 | 6023 | 284 | 284 | 4.02% | 4.72% | 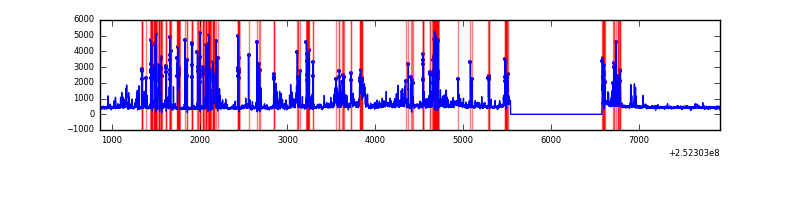 |
Top three noisy pixels from each quadrant. If the there are fewer than three noisy pixels in the level2.evt file, extra rows are filled as -1
| Pixel properties | Quadrant properties | ||||||
|---|---|---|---|---|---|---|---|
| Quadrant | DetID | PixID | Counts | Sigma | Mean | Median | Sigma |
| A | 1 | 162 | 106320 | 728.56 | 709 | 691 | 145.0 |
| A | 1 | 178 | 58704 | 400.14 | 709 | 691 | 145.0 |
| A | 1 | 161 | 50892 | 346.26 | 709 | 691 | 145.0 |
| B | 4 | 239 | 631704 | 4734.59 | 699 | 684 | 133.3 |
| B | 15 | 204 | 65820 | 488.72 | 699 | 684 | 133.3 |
| B | 11 | 51 | 49638 | 367.31 | 699 | 684 | 133.3 |
| C | 15 | 208 | 194050 | 1237.02 | 677 | 681 | 156.3 |
| C | 14 | 234 | 12771 | 77.34 | 677 | 681 | 156.3 |
| C | 4 | 175 | 6755 | 38.86 | 677 | 681 | 156.3 |
| D | 1 | 52 | 1074821 | 6816.24 | 659 | 642 | 157.6 |
| D | 4 | 95 | 280528 | 1776.03 | 659 | 642 | 157.6 |
| D | 10 | 50 | 223791 | 1416.0 | 659 | 642 | 157.6 |
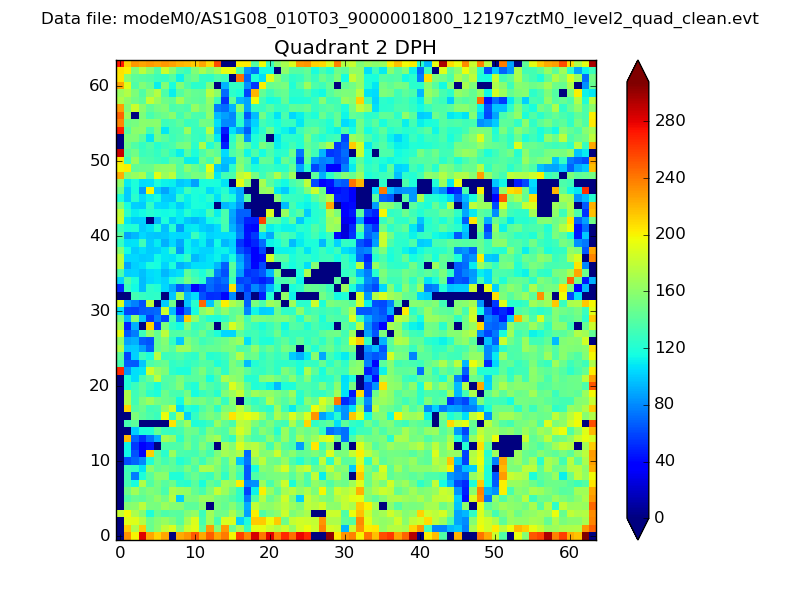
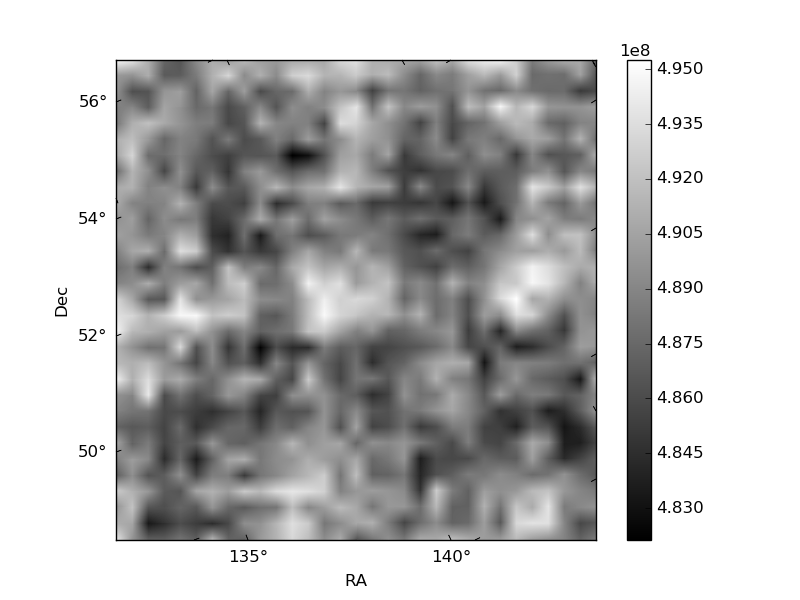
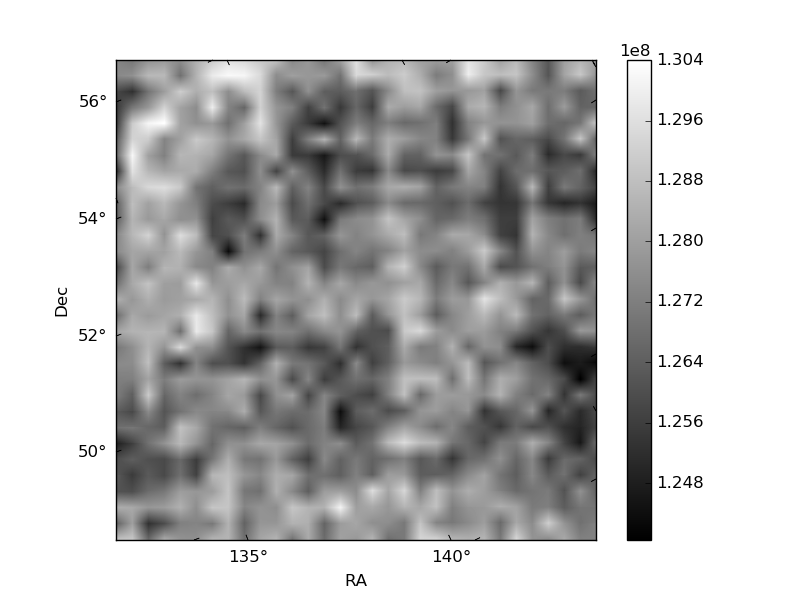
Histogram calculated using DETX and DETY for each event in the final _common_clean file
| Quadrant A | 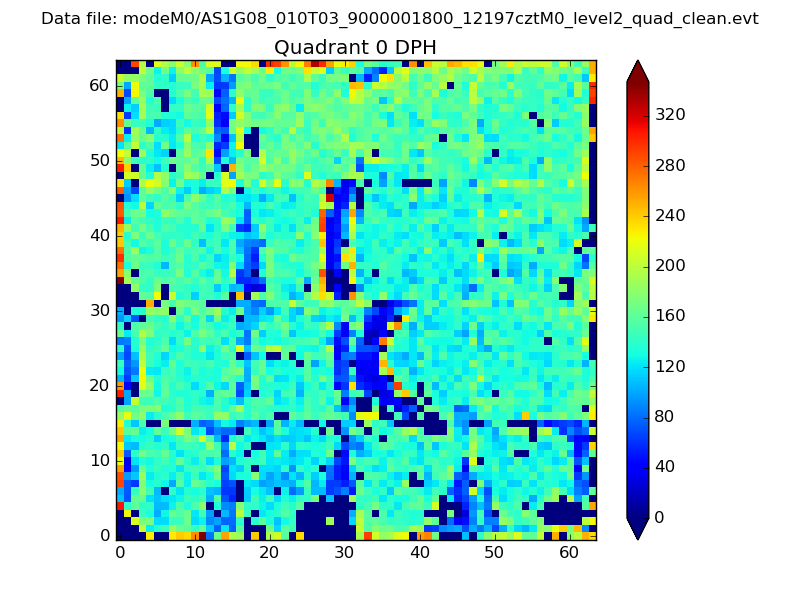 |
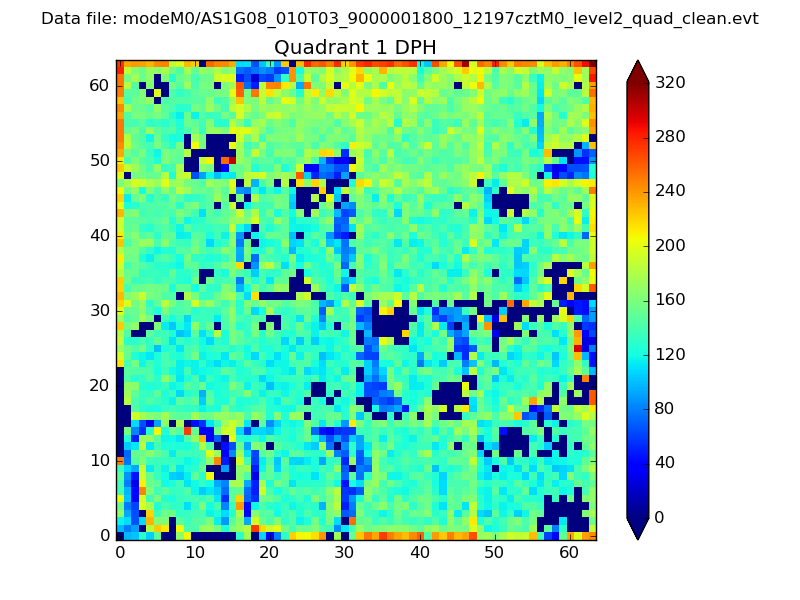 |
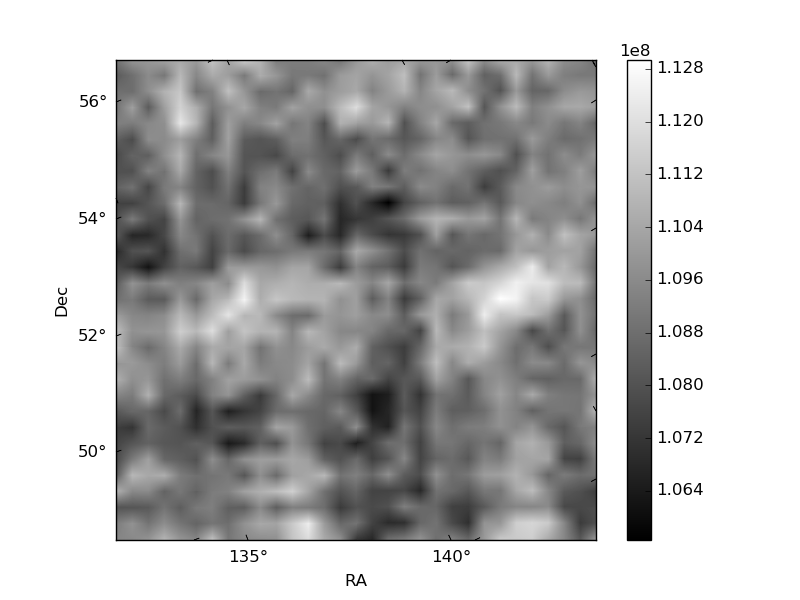
Quadrant B |
|---|---|---|---|
| Quadrant D | 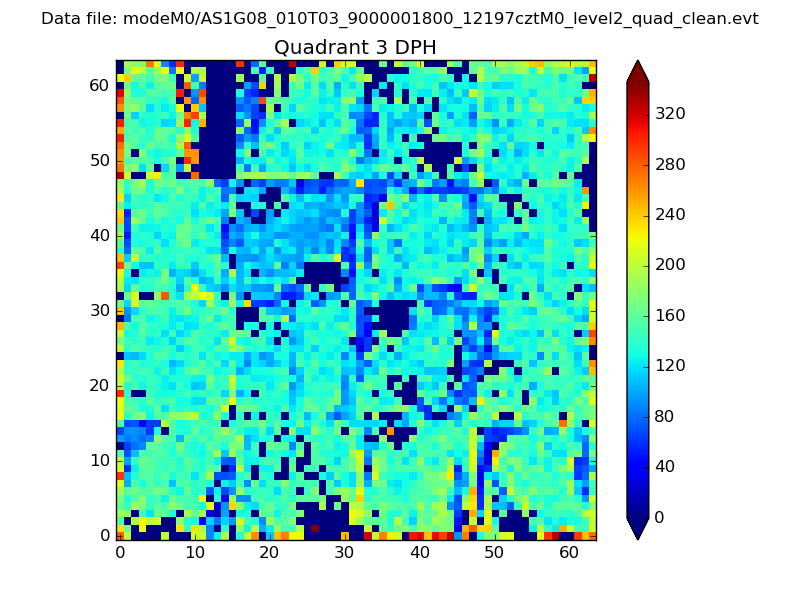 |
 |
Quadrant C |
| Plot type | Count rate plots | Images |
|---|---|---|
| Comparison with Poisson distribution Blue bars denote a histogram of data divided into 1 sec bins. Red curve is a Poisson curve with rate = median count rate of data. |
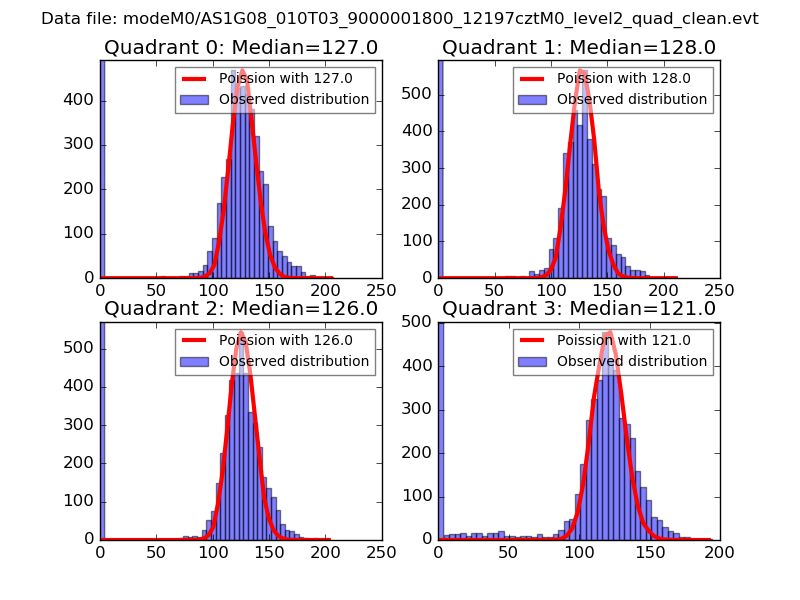 |
 |
| Quadrant-wise count rates Data is divided into 100 sec bins |
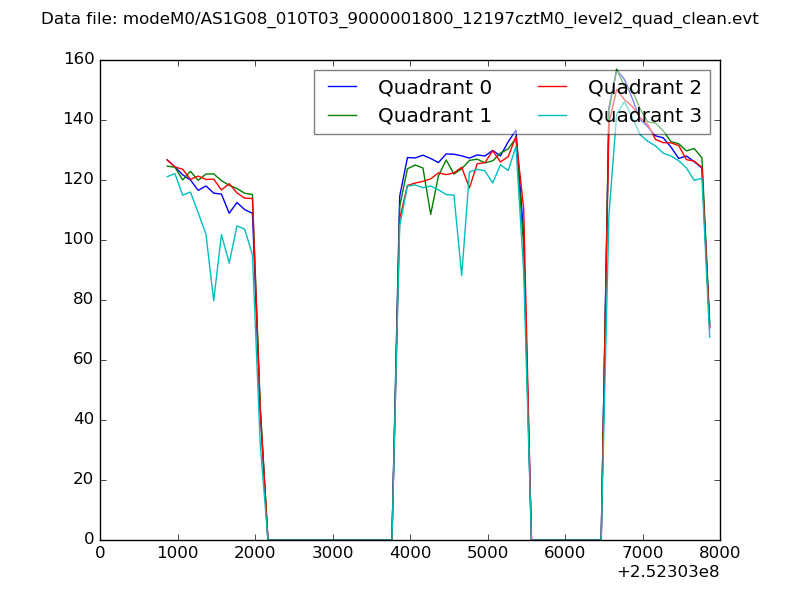 |
|
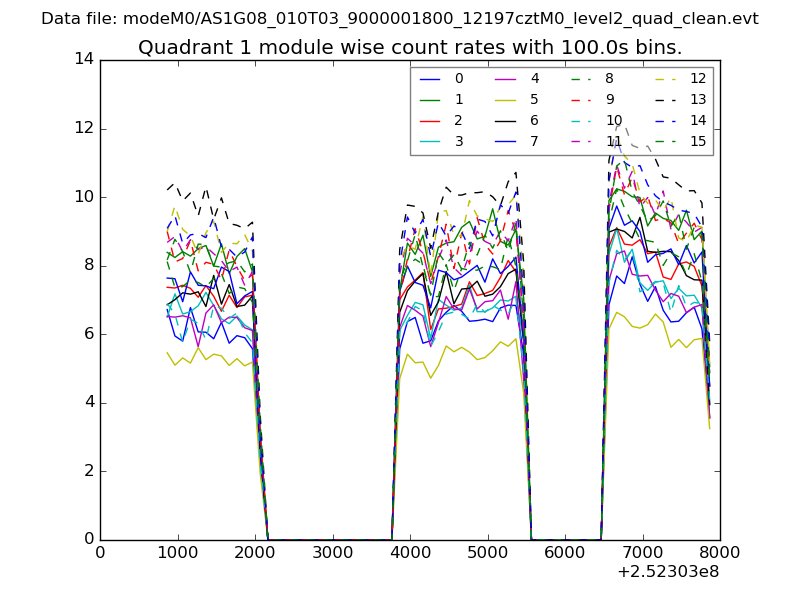
| Module-wise count rates for Quadrant A Data is divided into 100 sec bins |
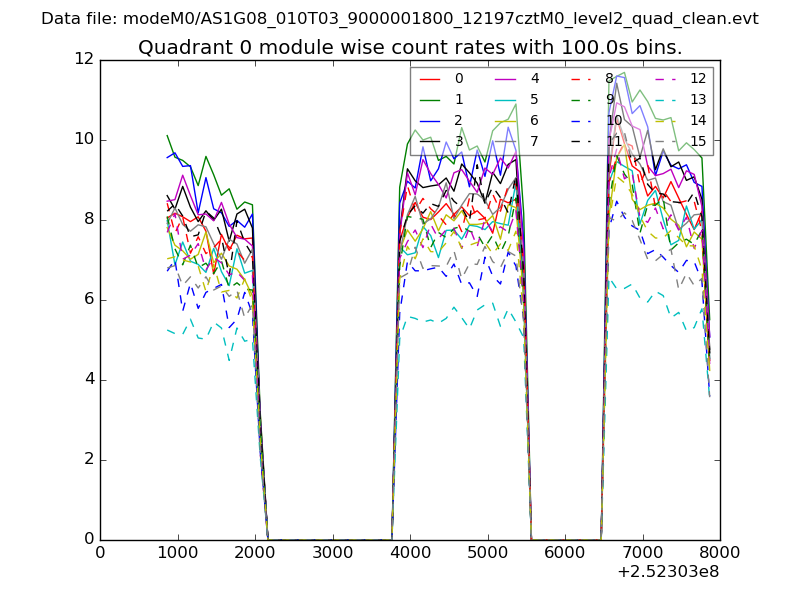 |
 |
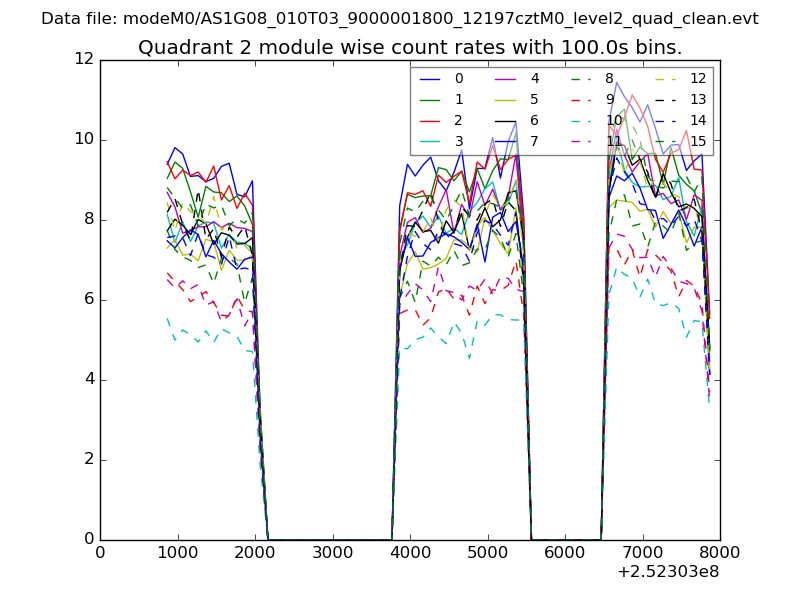
| Module-wise count rates for Quadrant B Data is divided into 100 sec bins |
 |
 |
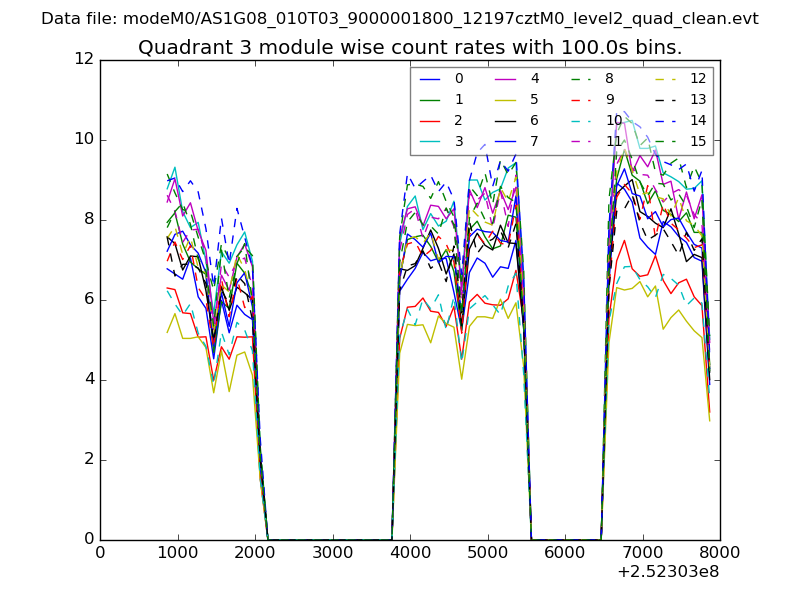
| Module-wise count rates for Quadrant C Data is divided into 100 sec bins |
 |
 |
| Module-wise count rates for Quadrant D Data is divided into 100 sec bins |
 |
 |
| Parameter | Plot |
|---|---|
| CZT HV Monitor | 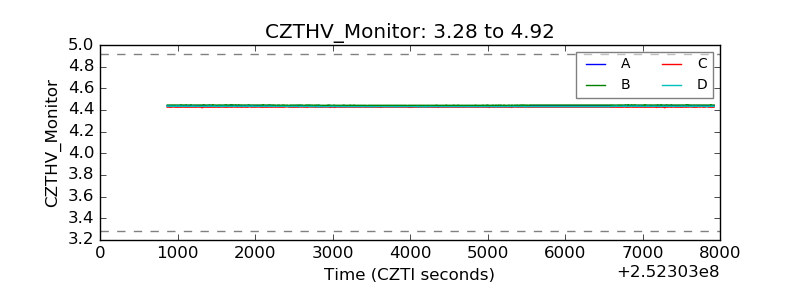 |
| D_VDD | 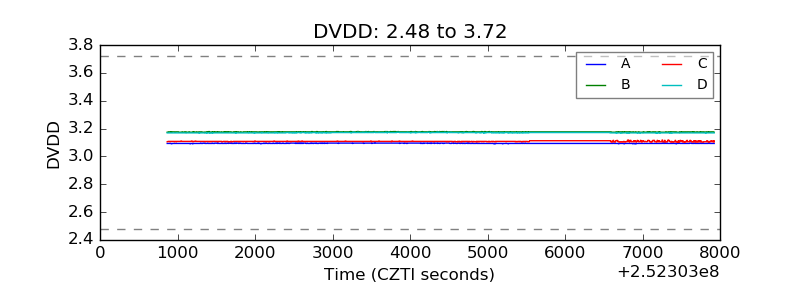 |
| Temperature 1 | 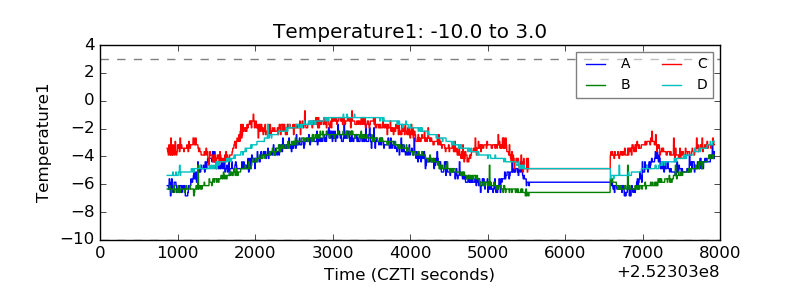 |
| Veto HV Monitor | 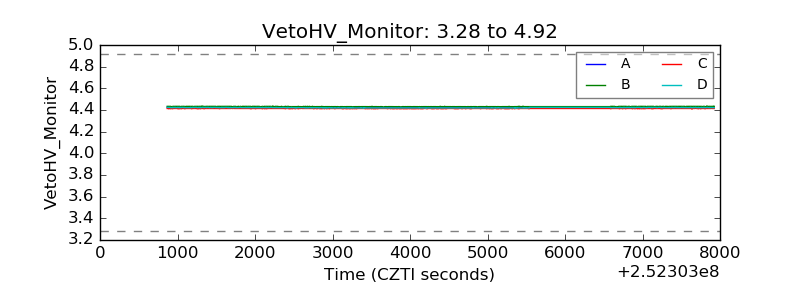 |
| Veto LLD | 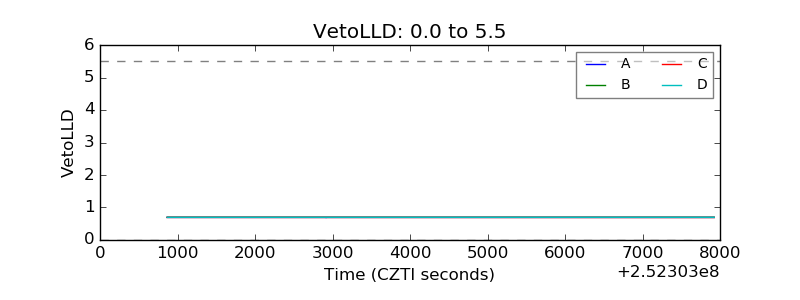 |
| Alpha Counter | 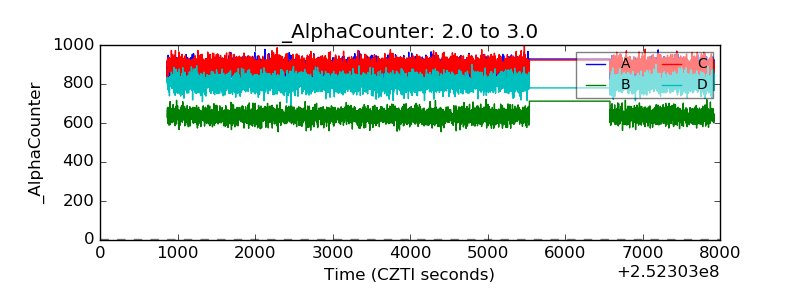 |
| _CPM_Rate | 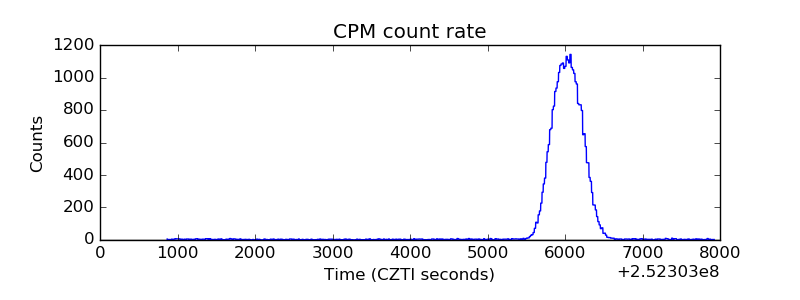 |
| CZT Counter | 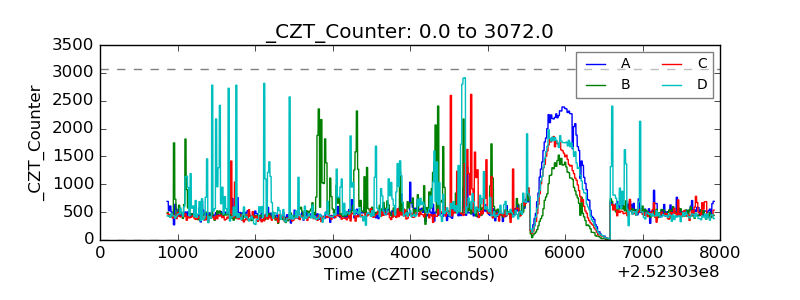 |
| +2.5 Volts monitor |  |
| +5 Volts monitor |  |
| _ROLL_ROT | 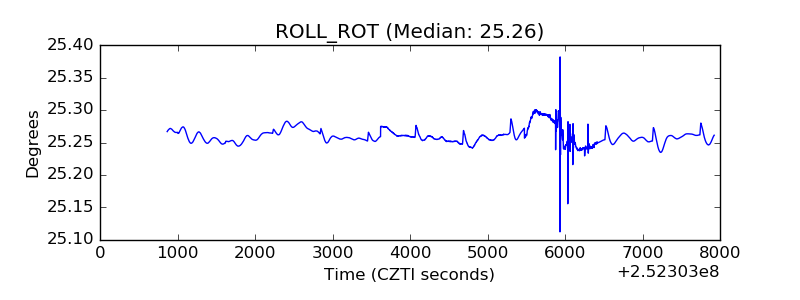 |
| _Roll_DEC | 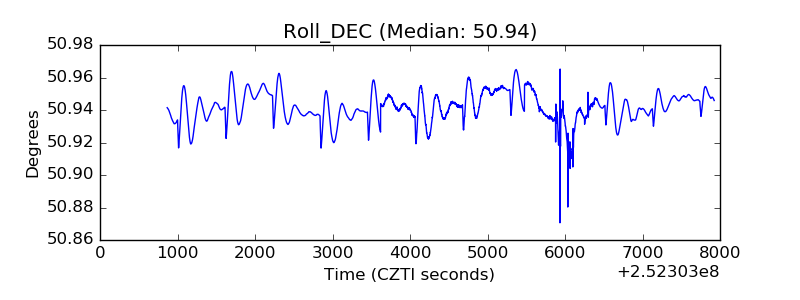 |
| _Roll_RA | 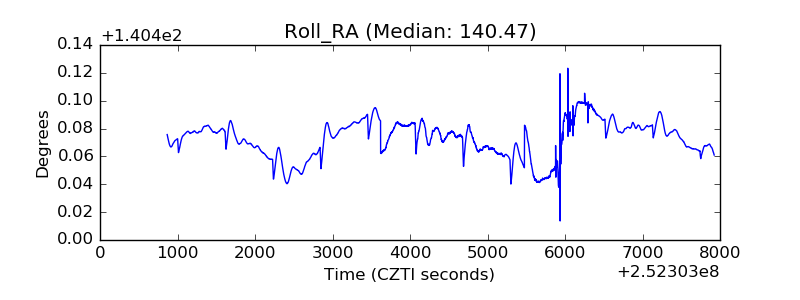 |
| Veto Counter | 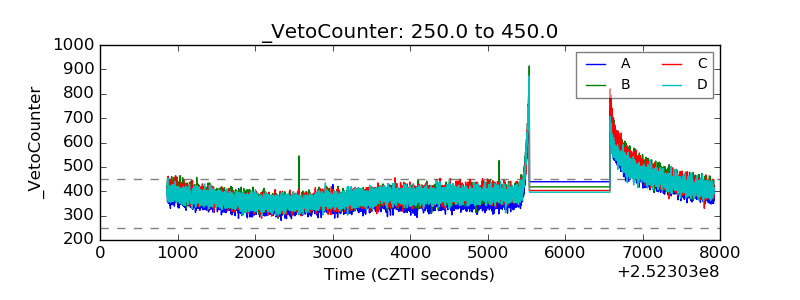 |