| Param | Original file | Final file |
|---|---|---|
| Filename | modeM0/AS1G08_010T03_9000001800_12199cztM0_level2.evt | modeM0/AS1G08_010T03_9000001800_12199cztM0_level2_quad_clean.evt |
| Size (bytes) | 458,052,480 | 86,253,120 |
| Size | 436.8 MB | 82.3 MB |
| Events in quadrant A | 3,471,313 | 554,177 |
| Events in quadrant B | 3,659,058 | 553,239 |
| Events in quadrant C | 2,902,407 | 544,443 |
| Events in quadrant D | 3,420,706 | 529,663 |
| Mode SS | |||
|---|---|---|---|
| Quadrant | BADHDUFLAG | Total packets | Discarded packets |
| A | 0 | 126 | 0 |
| B | 0 | 126 | 0 |
| C | 0 | 126 | 0 |
| D | 0 | 126 | 0 |
| Mode M9 | |||
|---|---|---|---|
| Quadrant | BADHDUFLAG | Total packets | Discarded packets |
| A | 0 | 11 | 0 |
| B | 0 | 11 | 0 |
| C | 0 | 11 | 0 |
| D | 0 | 11 | 0 |
| Mode M0 | |||
|---|---|---|---|
| Quadrant | BADHDUFLAG | Total packets | Discarded packets |
| A | 0 | 14262 | 2 |
| B | 0 | 14720 | 1 |
| C | 0 | 12712 | 1 |
| D | 0 | 14244 | 1 |
| Quadrant | Total seconds | Saturated seconds | Saturation percentage |
|---|---|---|---|
| A | 6163 | 116 | 1.882200% |
| B | 6163 | 200 | 3.245173% |
| C | 6163 | 53 | 0.859971% |
| D | 6163 | 80 | 1.298069% |
Noise dominated data is calculated using 1-second bins in cleaned event files. If a bin has >2000 counts, and if more than 50% of those come from <1% of pixels, then it is considered to be noise-dominated and hence unusable.
| Quadrant | # 1 sec bins | Bins with >0 counts | Bins with >2000 counts | High rate bins dominated by noise | Noise dominated (total time) | Noise dominated (detector-on time) | Marked lightcurve |
|---|---|---|---|---|---|---|---|
| A | 7304 | 6165 | 10 | 10 | 0.14% | 0.16% | 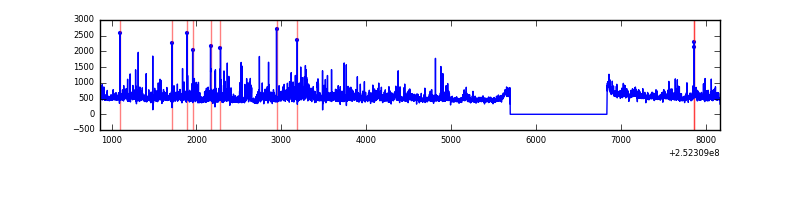 |
| B | 7304 | 6165 | 66 | 66 | 0.90% | 1.07% | 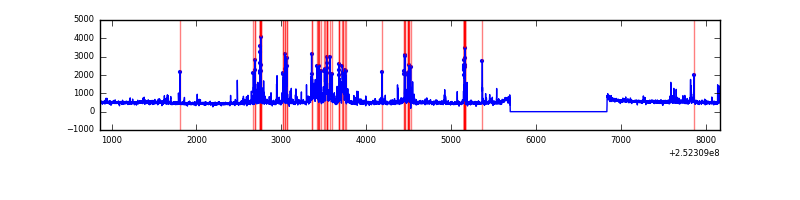 |
| C | 7304 | 6165 | 4 | 4 | 0.05% | 0.06% | 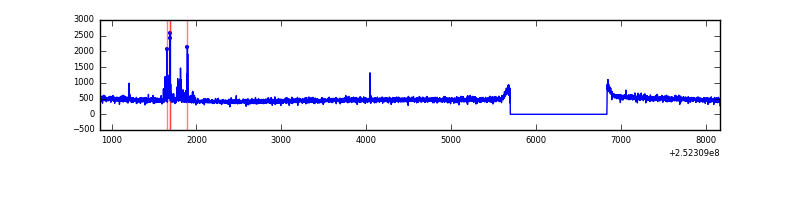 |
| D | 7304 | 6165 | 19 | 19 | 0.26% | 0.31% | 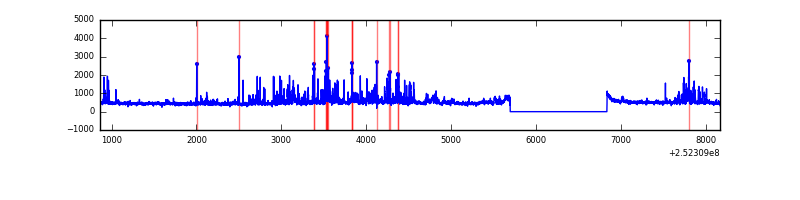 |
Top three noisy pixels from each quadrant. If the there are fewer than three noisy pixels in the level2.evt file, extra rows are filled as -1
| Pixel properties | Quadrant properties | ||||||
|---|---|---|---|---|---|---|---|
| Quadrant | DetID | PixID | Counts | Sigma | Mean | Median | Sigma |
| A | 1 | 162 | 146740 | 956.06 | 758 | 743 | 152.7 |
| A | 13 | 251 | 117651 | 765.57 | 758 | 743 | 152.7 |
| A | 1 | 178 | 89487 | 581.14 | 758 | 743 | 152.7 |
| B | 4 | 239 | 591707 | 4153.02 | 747 | 730 | 142.3 |
| B | 11 | 51 | 63889 | 443.84 | 747 | 730 | 142.3 |
| B | 0 | 219 | 25837 | 176.44 | 747 | 730 | 142.3 |
| C | 15 | 208 | 59992 | 356.19 | 723 | 726 | 166.4 |
| C | 8 | 128 | 9663 | 53.71 | 723 | 726 | 166.4 |
| C | 13 | 61 | 5212 | 26.96 | 723 | 726 | 166.4 |
| D | 1 | 52 | 523078 | 3064.84 | 726 | 707 | 170.4 |
| D | 8 | 195 | 41988 | 242.2 | 726 | 707 | 170.4 |
| D | 10 | 50 | 35973 | 206.91 | 726 | 707 | 170.4 |
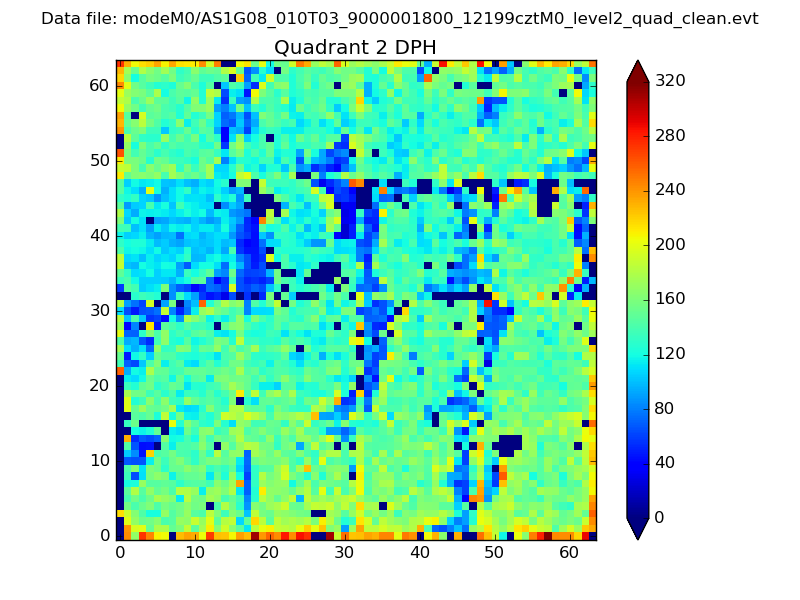
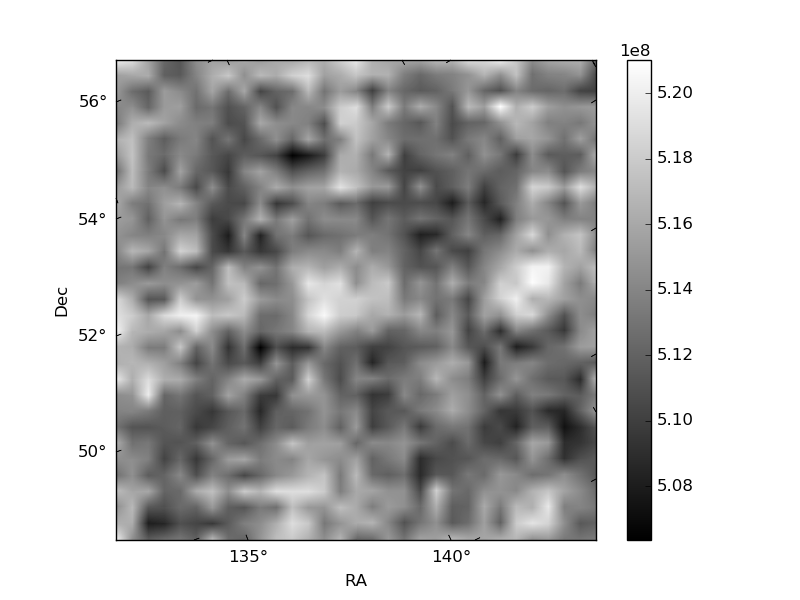
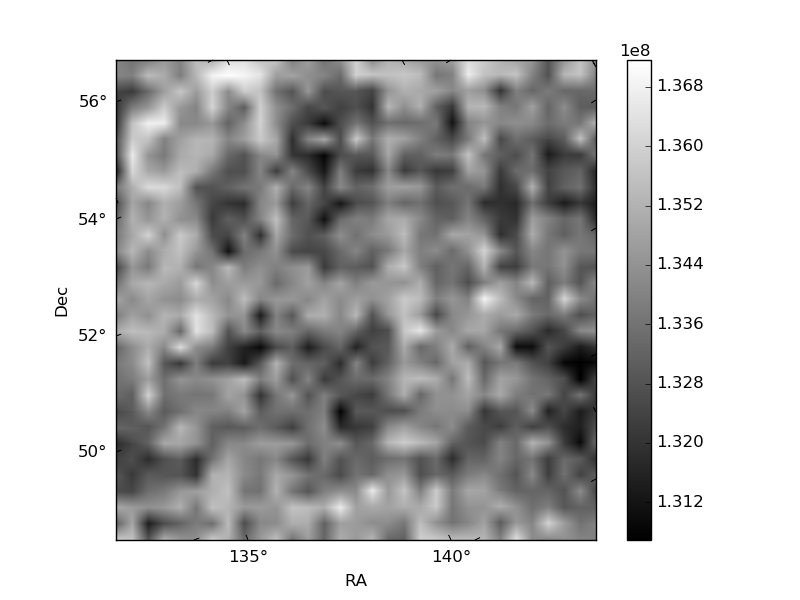
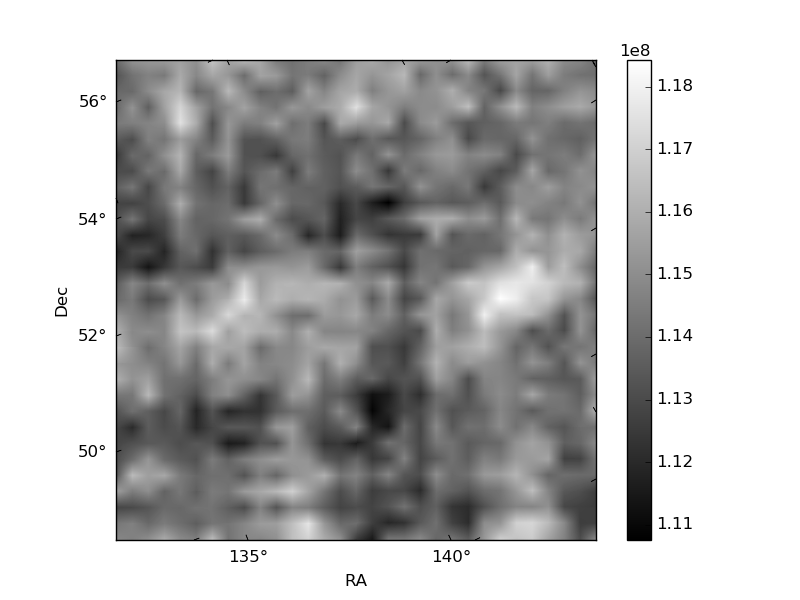
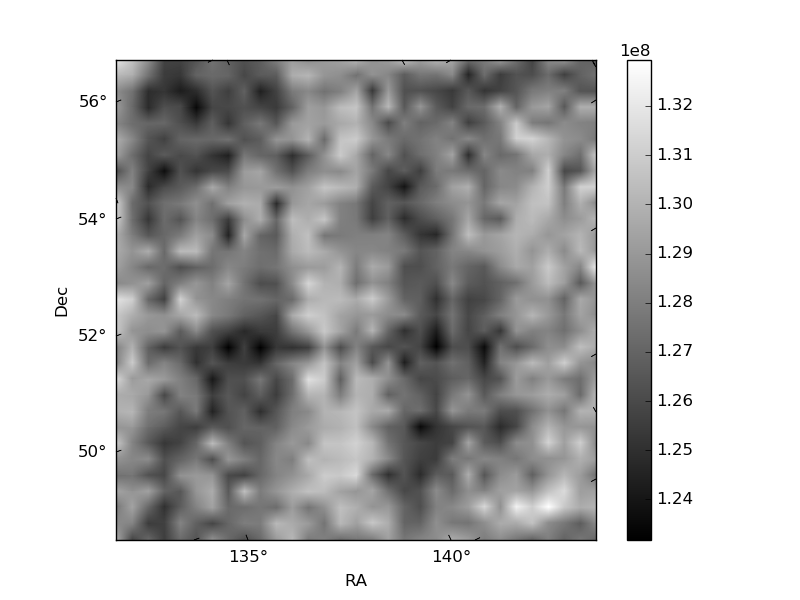
Histogram calculated using DETX and DETY for each event in the final _common_clean file
| Quadrant A | 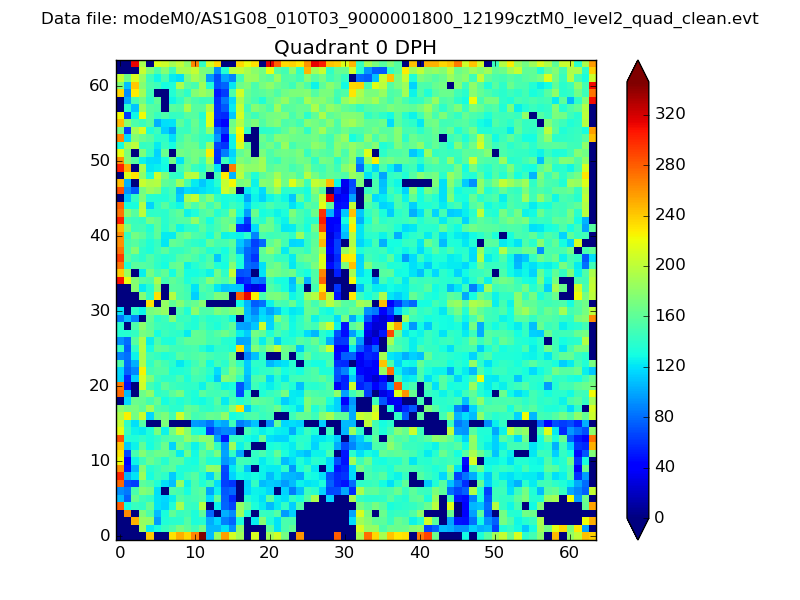 |
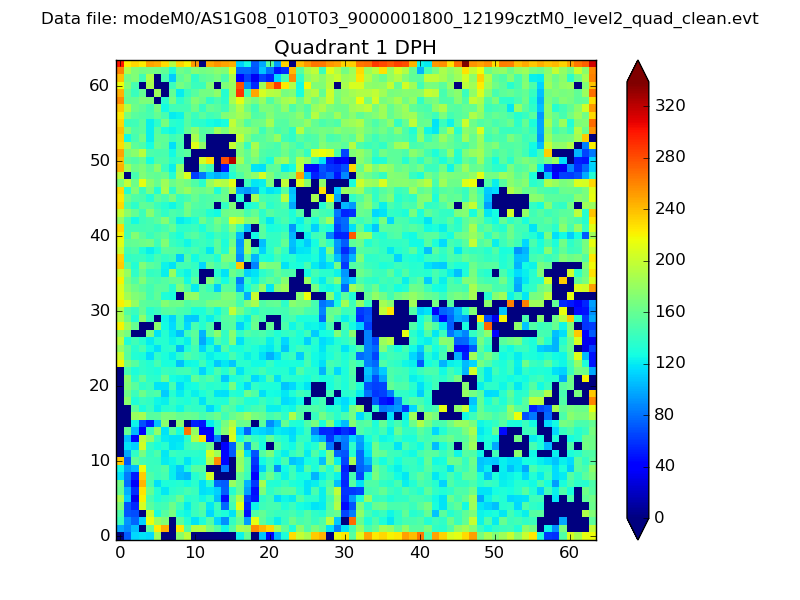 |
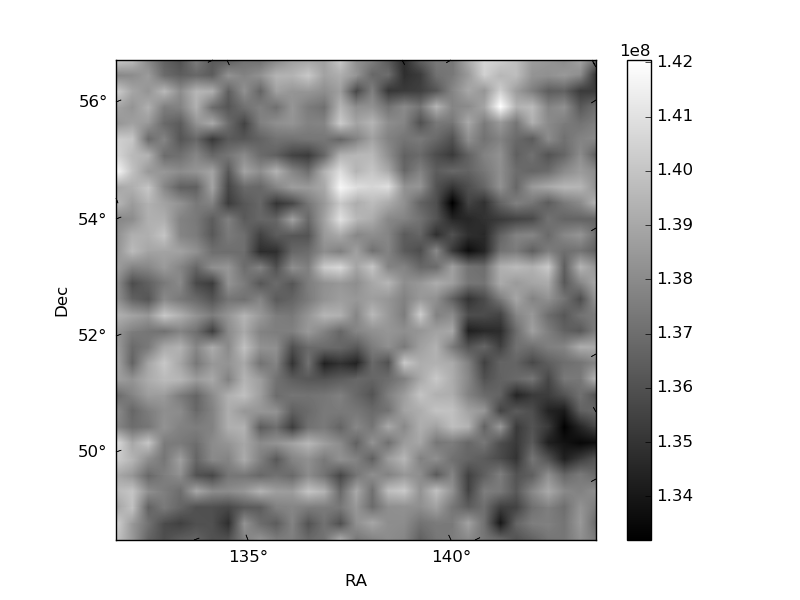
Quadrant B |
|---|---|---|---|
| Quadrant D | 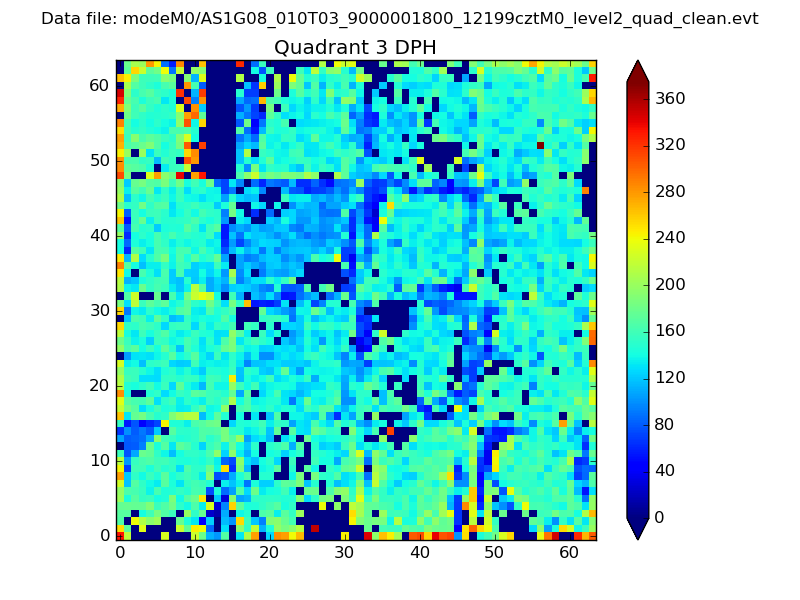 |
 |
Quadrant C |
| Plot type | Count rate plots | Images |
|---|---|---|
| Comparison with Poisson distribution Blue bars denote a histogram of data divided into 1 sec bins. Red curve is a Poisson curve with rate = median count rate of data. |
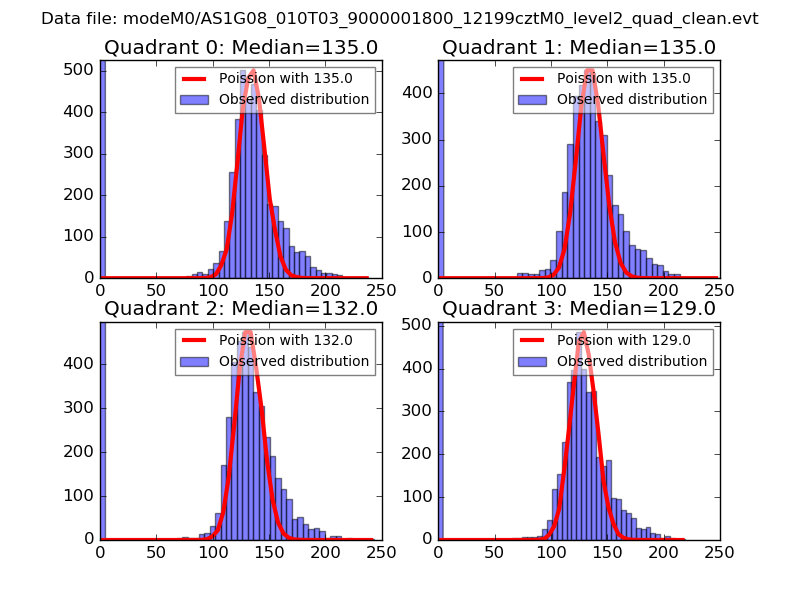 |
 |
| Quadrant-wise count rates Data is divided into 100 sec bins |
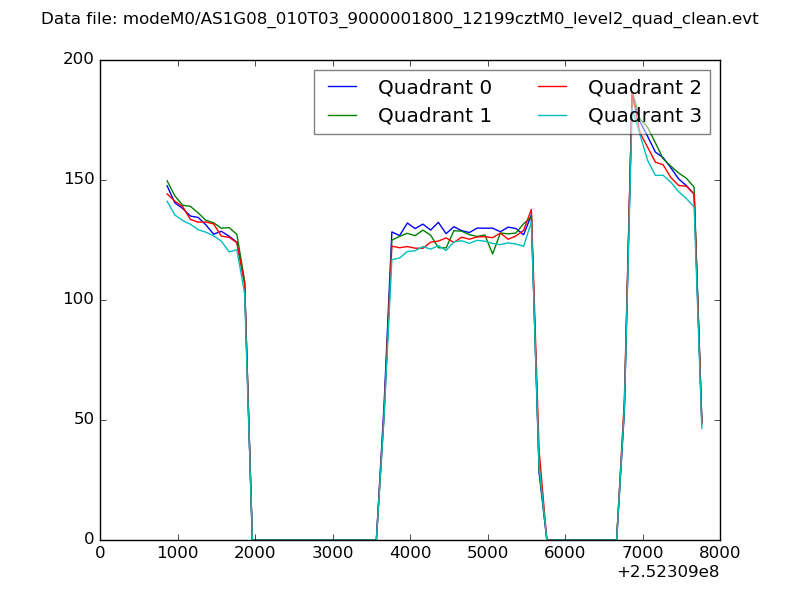 |
|
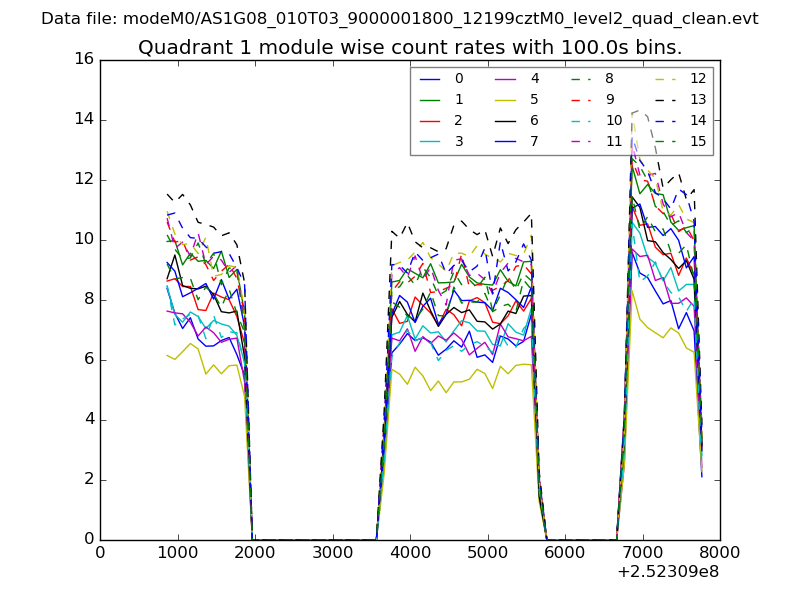
| Module-wise count rates for Quadrant A Data is divided into 100 sec bins |
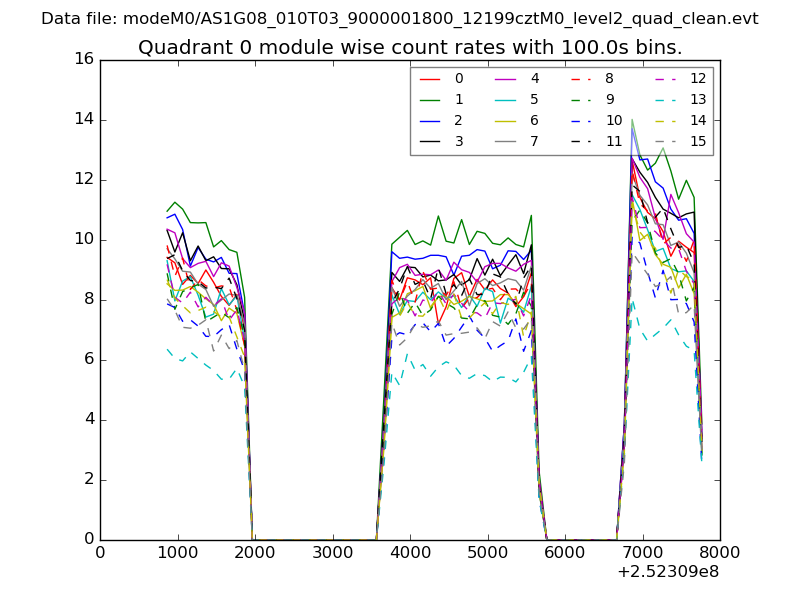 |
 |
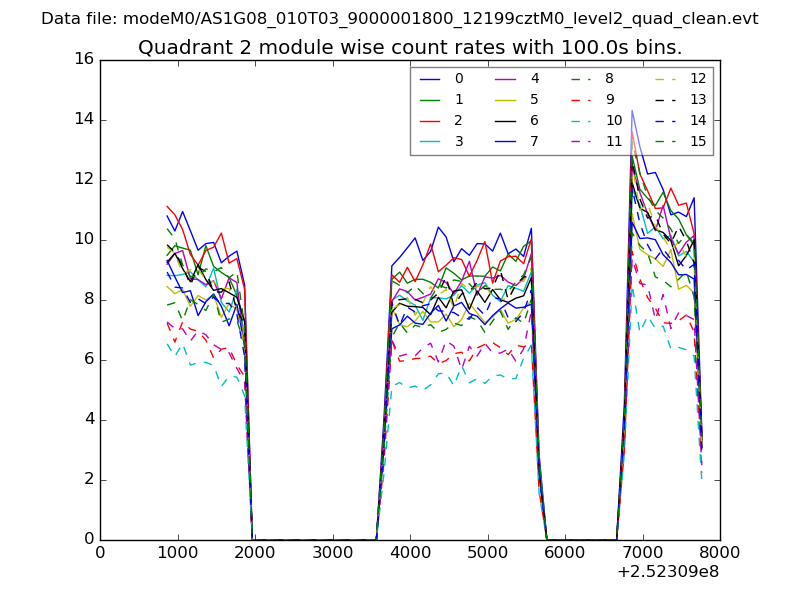
| Module-wise count rates for Quadrant B Data is divided into 100 sec bins |
 |
 |
| Module-wise count rates for Quadrant C Data is divided into 100 sec bins |
 |
 |
| Module-wise count rates for Quadrant D Data is divided into 100 sec bins |
 |
 |
| Parameter | Plot |
|---|---|
| CZT HV Monitor | 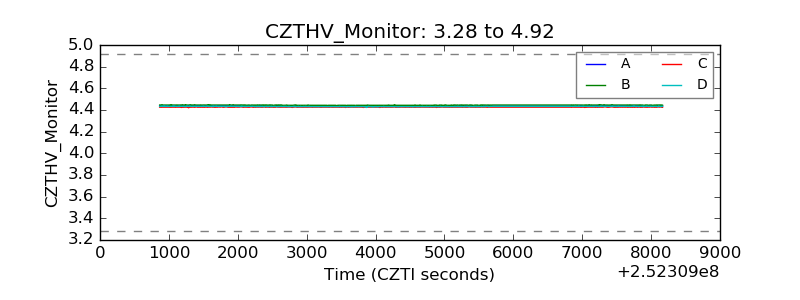 |
| D_VDD | 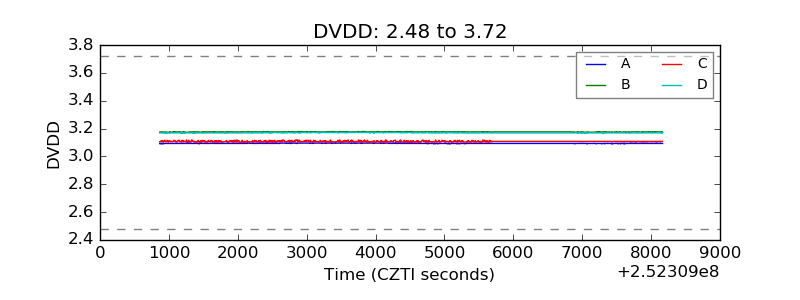 |
| Temperature 1 | 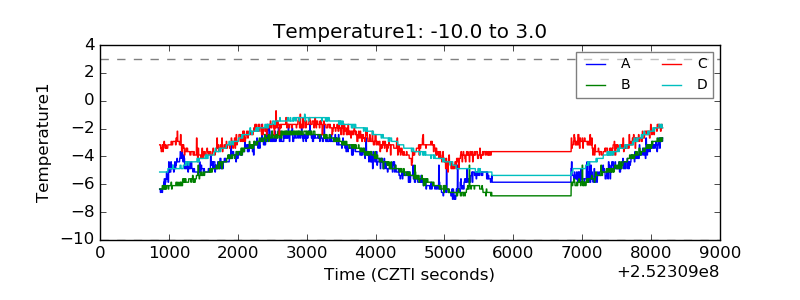 |
| Veto HV Monitor | 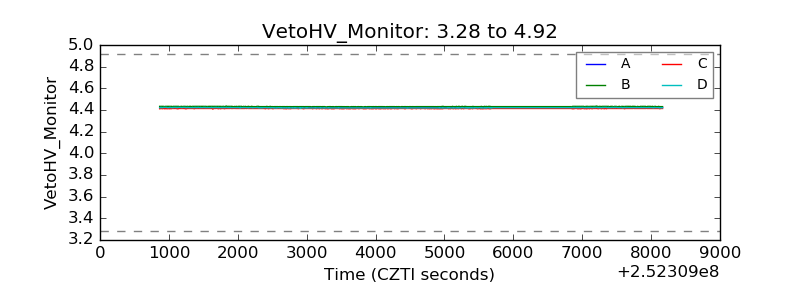 |
| Veto LLD | 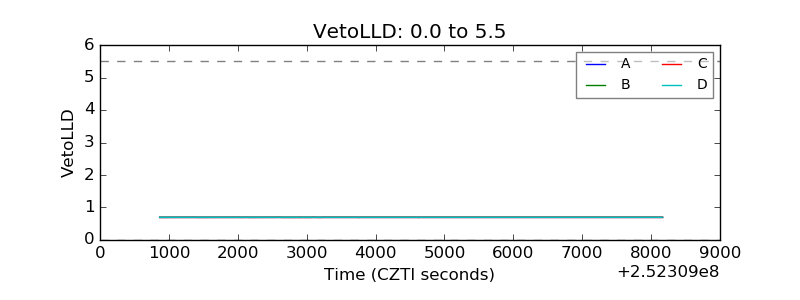 |
| Alpha Counter | 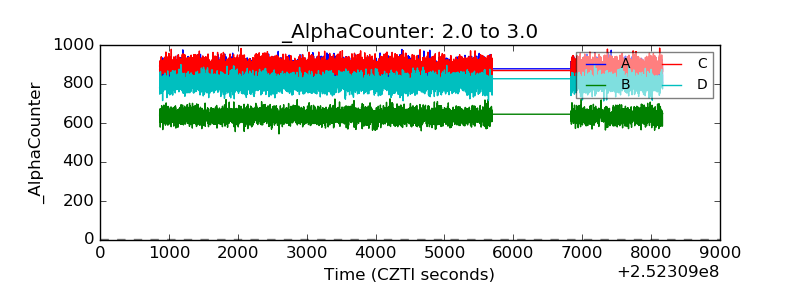 |
| _CPM_Rate | 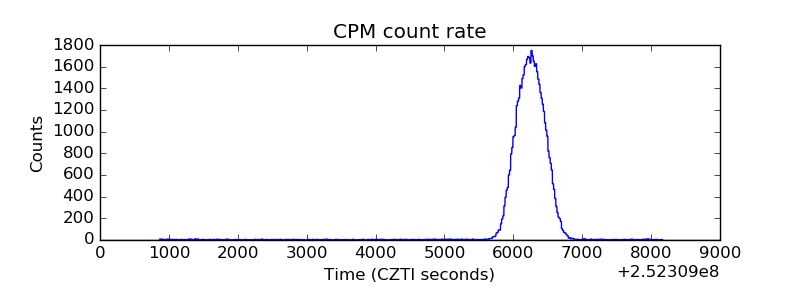 |
| CZT Counter | 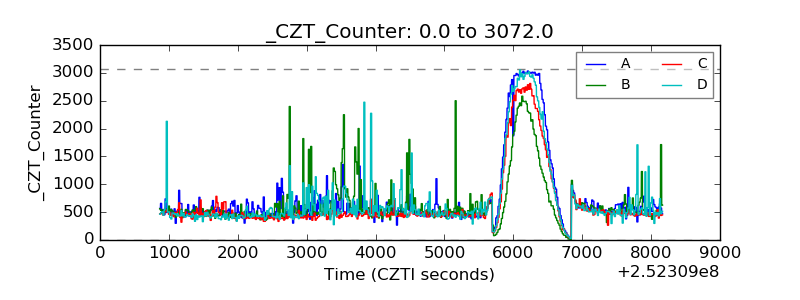 |
| +2.5 Volts monitor |  |
| +5 Volts monitor | 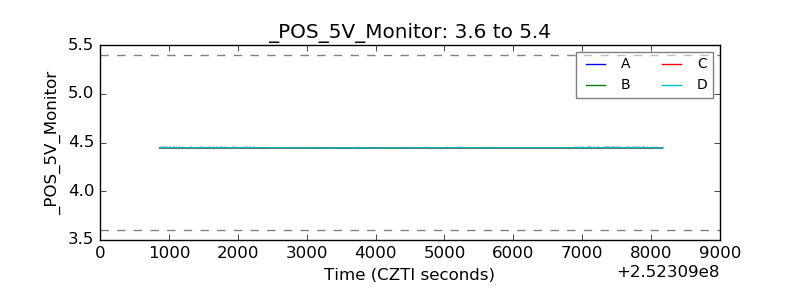 |
| _ROLL_ROT | 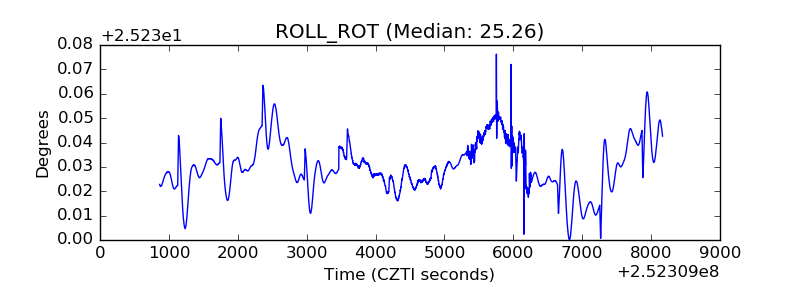 |
| _Roll_DEC | 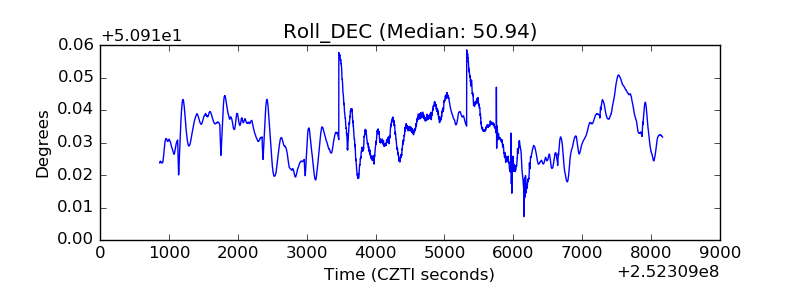 |
| _Roll_RA | 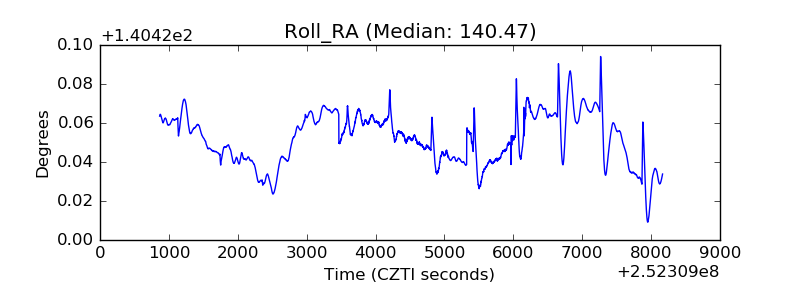 |
| Veto Counter | 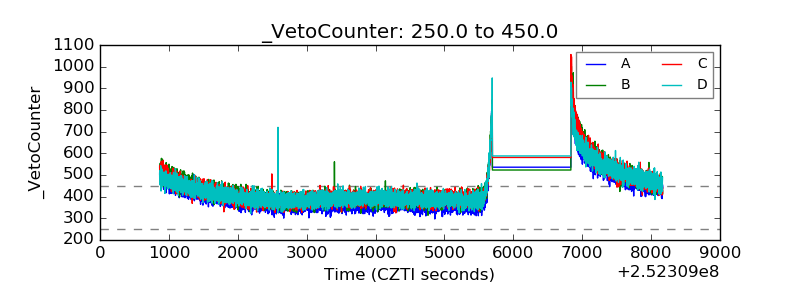 |