| Param | Original file | Final file |
|---|---|---|
| Filename | modeM0/AS1G08_010T03_9000001800_12200cztM0_level2.evt | modeM0/AS1G08_010T03_9000001800_12200cztM0_level2_quad_clean.evt |
| Size (bytes) | 311,304,960 | 49,993,920 |
| Size | 296.9 MB | 47.7 MB |
| Events in quadrant A | 2,224,083 | 319,656 |
| Events in quadrant B | 2,611,210 | 311,595 |
| Events in quadrant C | 1,878,137 | 309,413 |
| Events in quadrant D | 2,443,270 | 292,327 |
| Mode SS | |||
|---|---|---|---|
| Quadrant | BADHDUFLAG | Total packets | Discarded packets |
| A | 0 | 80 | 0 |
| B | 0 | 80 | 0 |
| C | 0 | 80 | 0 |
| D | 0 | 80 | 0 |
| Mode M0 | |||
|---|---|---|---|
| Quadrant | BADHDUFLAG | Total packets | Discarded packets |
| A | 0 | 9126 | 1 |
| B | 0 | 10177 | 1 |
| C | 0 | 8147 | 1 |
| D | 0 | 9777 | 1 |
| Quadrant | Total seconds | Saturated seconds | Saturation percentage |
|---|---|---|---|
| A | 3973 | 16 | 0.402718% |
| B | 3973 | 196 | 4.933300% |
| C | 3973 | 2 | 0.050340% |
| D | 3973 | 119 | 2.995218% |
Noise dominated data is calculated using 1-second bins in cleaned event files. If a bin has >2000 counts, and if more than 50% of those come from <1% of pixels, then it is considered to be noise-dominated and hence unusable.
| Quadrant | # 1 sec bins | Bins with >0 counts | Bins with >2000 counts | High rate bins dominated by noise | Noise dominated (total time) | Noise dominated (detector-on time) | Marked lightcurve |
|---|---|---|---|---|---|---|---|
| A | 3974 | 3974 | 2 | 2 | 0.05% | 0.05% | 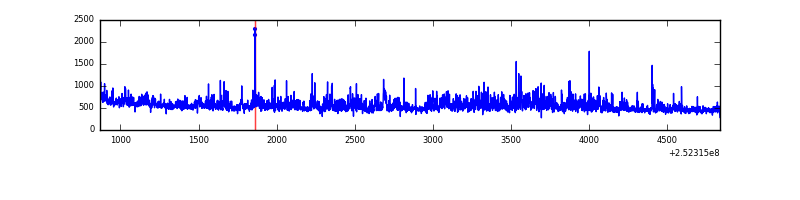 |
| B | 3974 | 3974 | 123 | 123 | 3.10% | 3.10% | 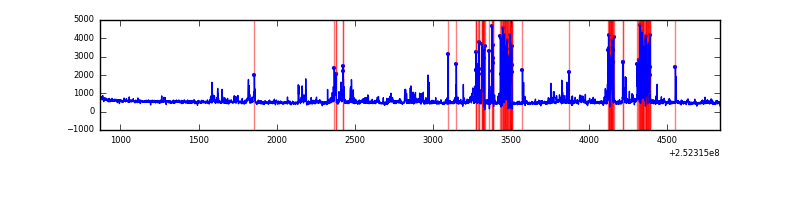 |
| C | 3974 | 3974 | 0 | 0 | 0.00% | 0.00% | 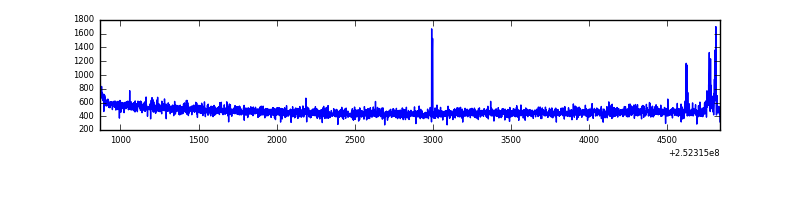 |
| D | 3974 | 3974 | 100 | 100 | 2.52% | 2.52% | 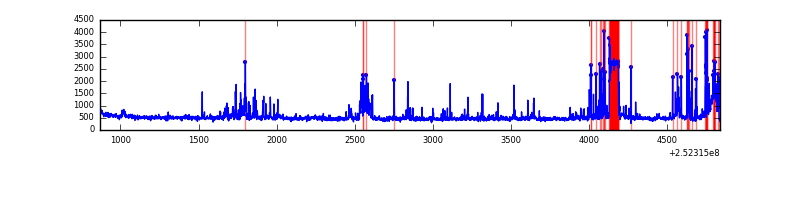 |
Top three noisy pixels from each quadrant. If the there are fewer than three noisy pixels in the level2.evt file, extra rows are filled as -1
| Pixel properties | Quadrant properties | ||||||
|---|---|---|---|---|---|---|---|
| Quadrant | DetID | PixID | Counts | Sigma | Mean | Median | Sigma |
| A | 1 | 162 | 100758 | 983.9 | 500 | 491 | 101.9 |
| A | 1 | 178 | 58550 | 569.72 | 500 | 491 | 101.9 |
| A | 1 | 161 | 50180 | 487.59 | 500 | 491 | 101.9 |
| B | 4 | 239 | 566475 | 6224.03 | 479 | 467 | 90.9 |
| B | 11 | 51 | 69552 | 759.68 | 479 | 467 | 90.9 |
| B | 15 | 204 | 49137 | 535.19 | 479 | 467 | 90.9 |
| C | 5 | 112 | 24562 | 220.38 | 473 | 476 | 109.3 |
| C | 14 | 234 | 5556 | 46.48 | 473 | 476 | 109.3 |
| C | 4 | 175 | 3483 | 27.51 | 473 | 476 | 109.3 |
| D | 2 | 33 | 403605 | 3555.83 | 471 | 460 | 113.4 |
| D | 1 | 52 | 178162 | 1567.37 | 471 | 460 | 113.4 |
| D | 10 | 50 | 28535 | 247.63 | 471 | 460 | 113.4 |
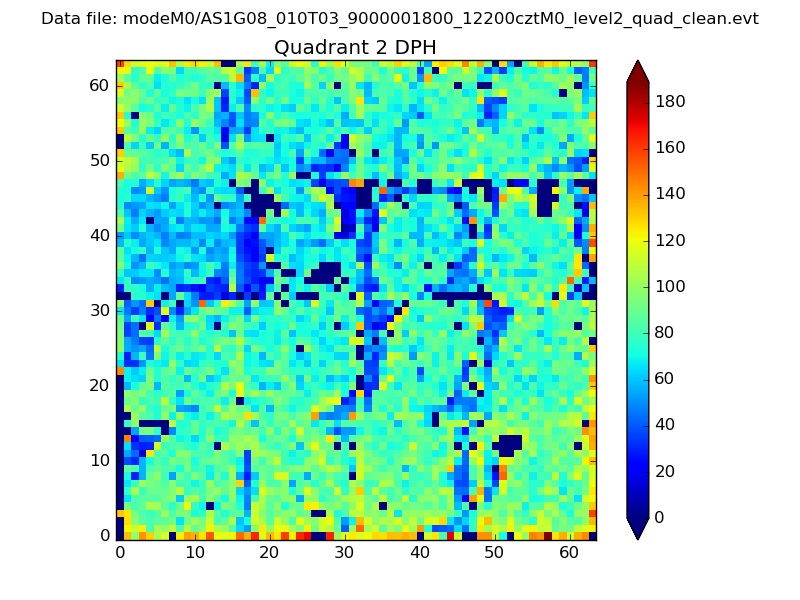
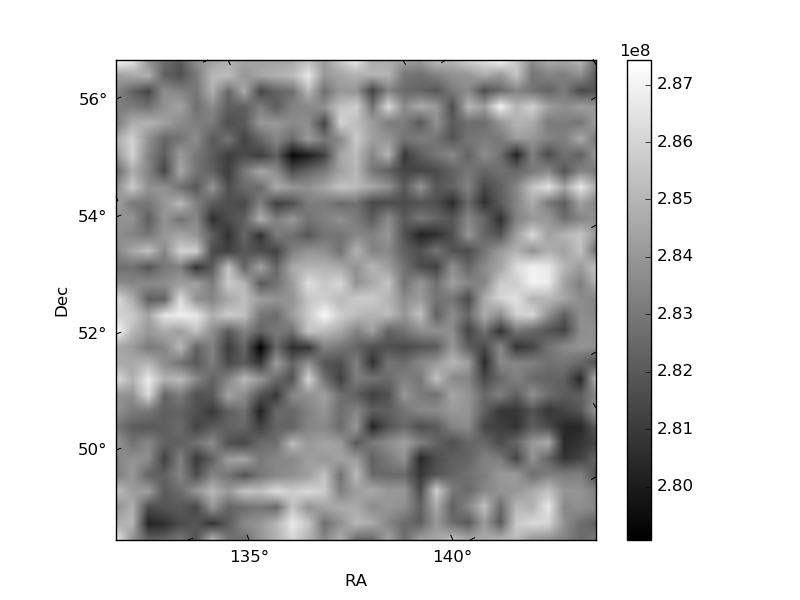
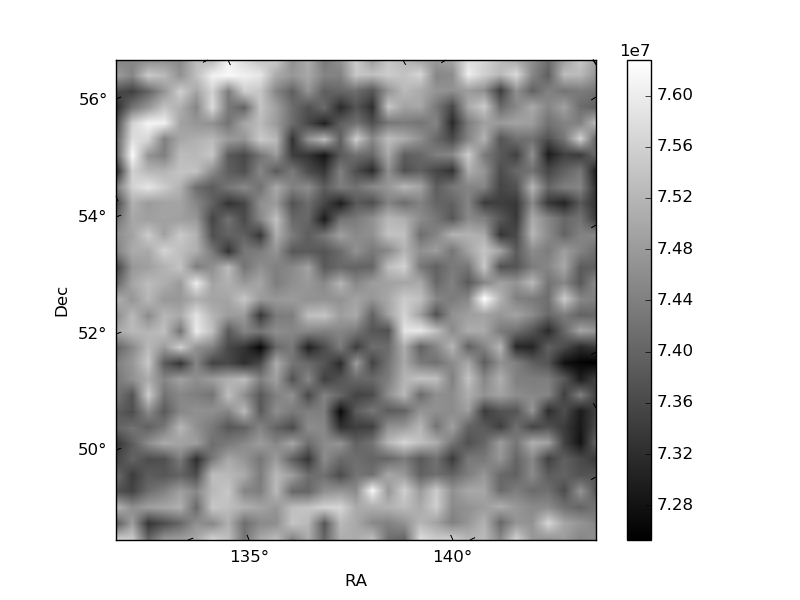
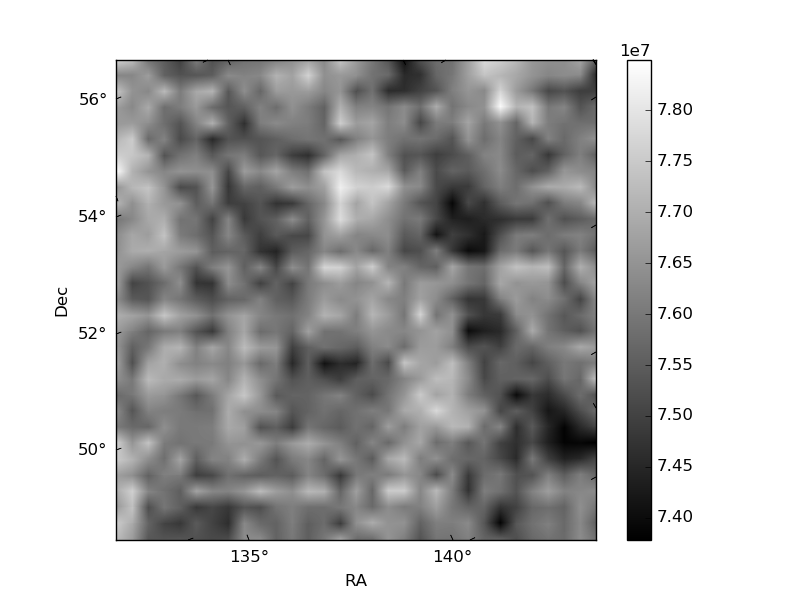
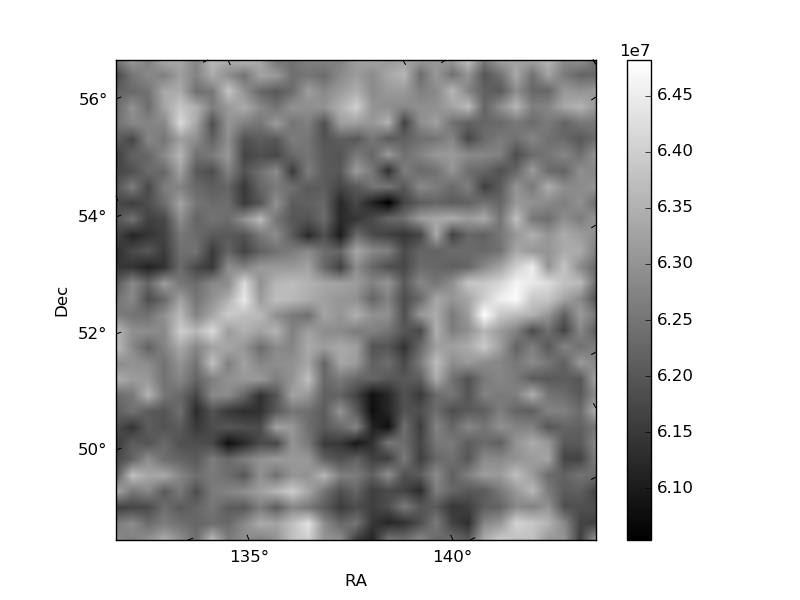
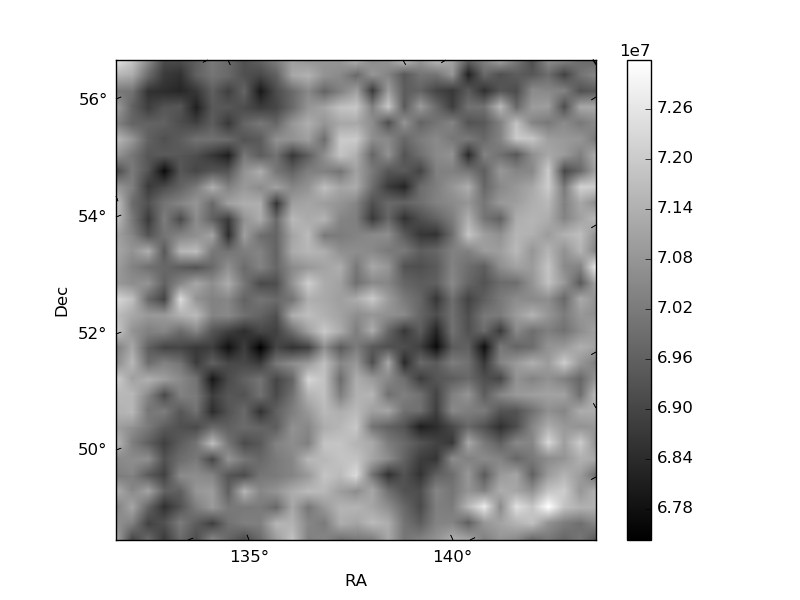
Histogram calculated using DETX and DETY for each event in the final _common_clean file
| Quadrant A | 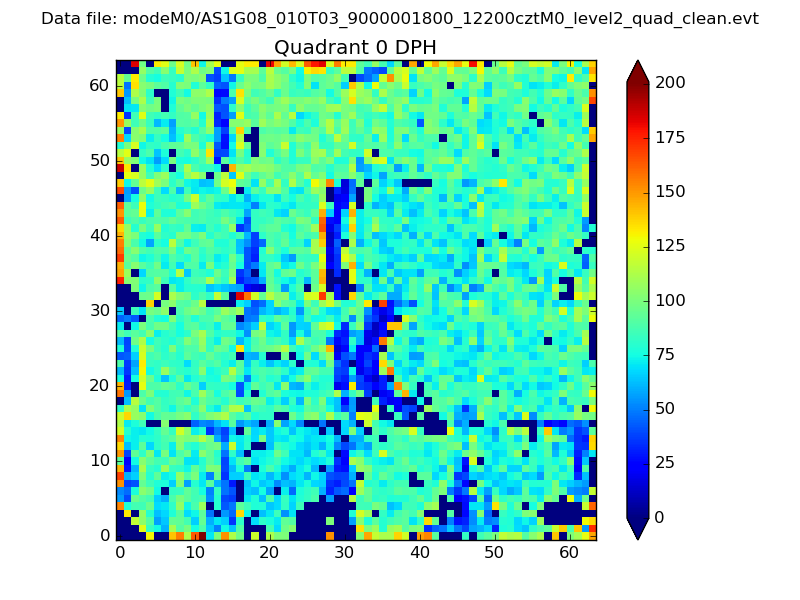 |
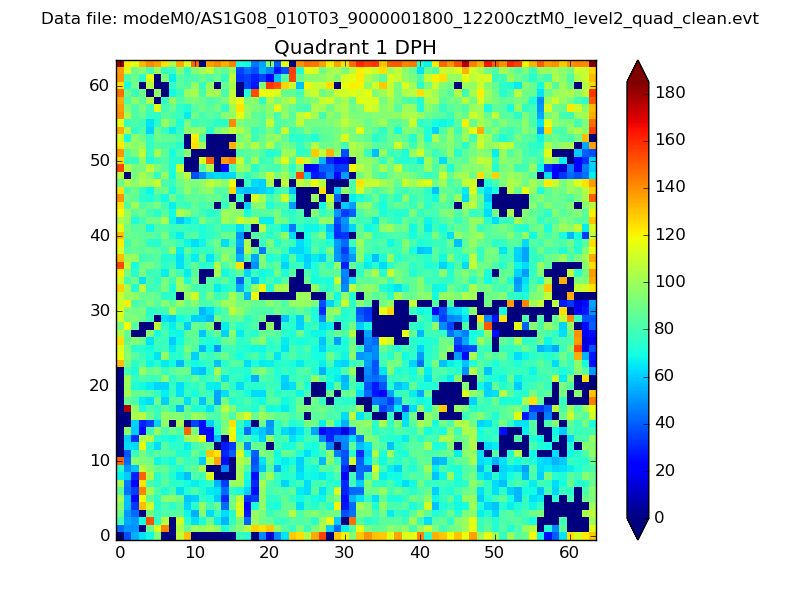 |
Quadrant B |
|---|---|---|---|
| Quadrant D | 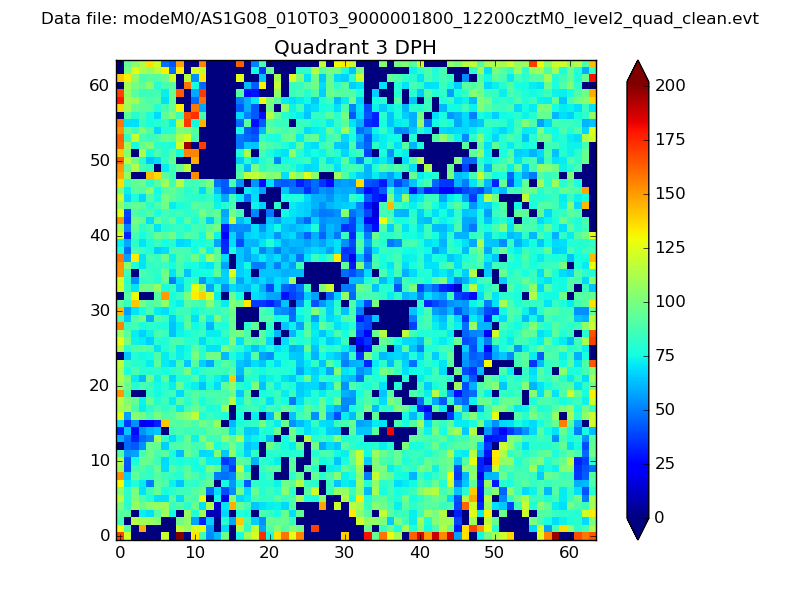 |
 |
Quadrant C |
| Plot type | Count rate plots | Images |
|---|---|---|
| Comparison with Poisson distribution Blue bars denote a histogram of data divided into 1 sec bins. Red curve is a Poisson curve with rate = median count rate of data. |
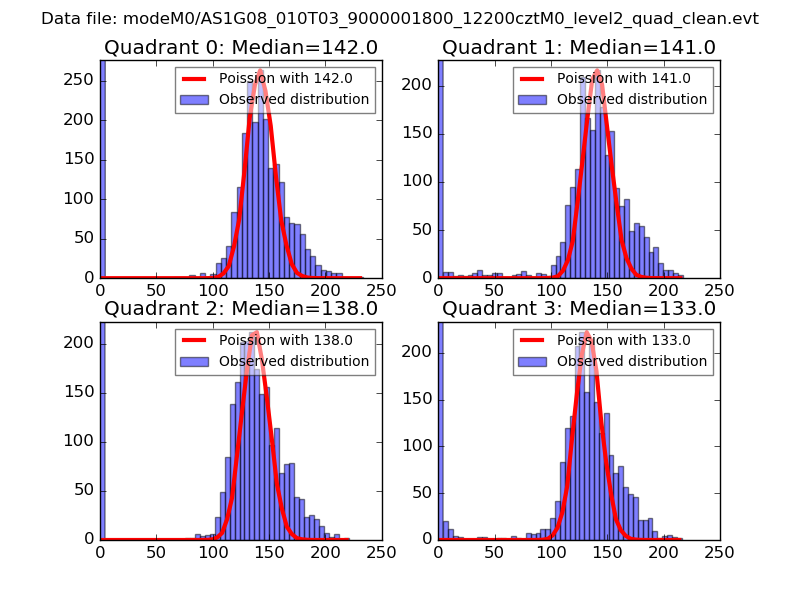 |
 |
| Quadrant-wise count rates Data is divided into 100 sec bins |
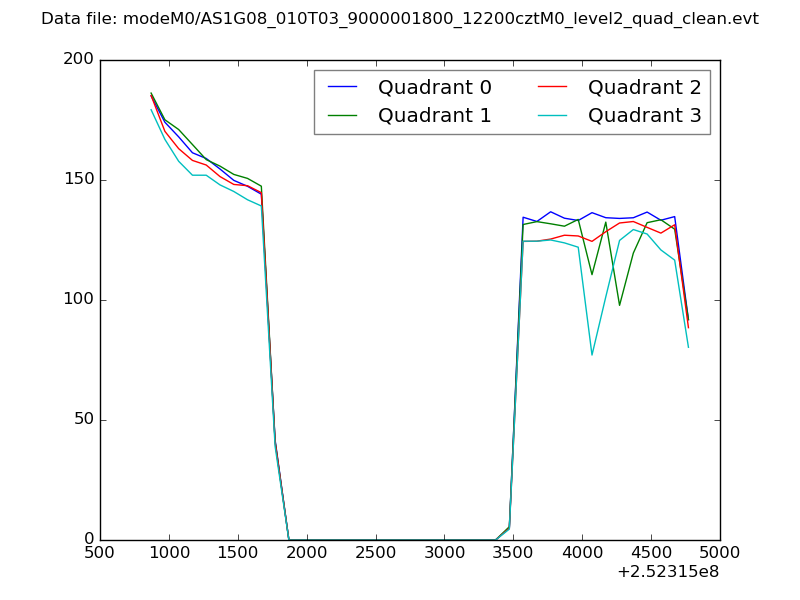 |
|
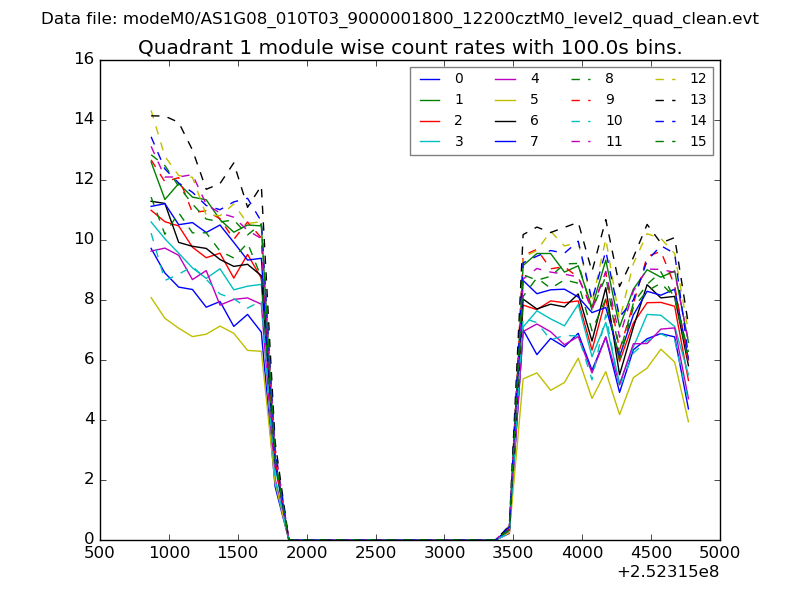
| Module-wise count rates for Quadrant A Data is divided into 100 sec bins |
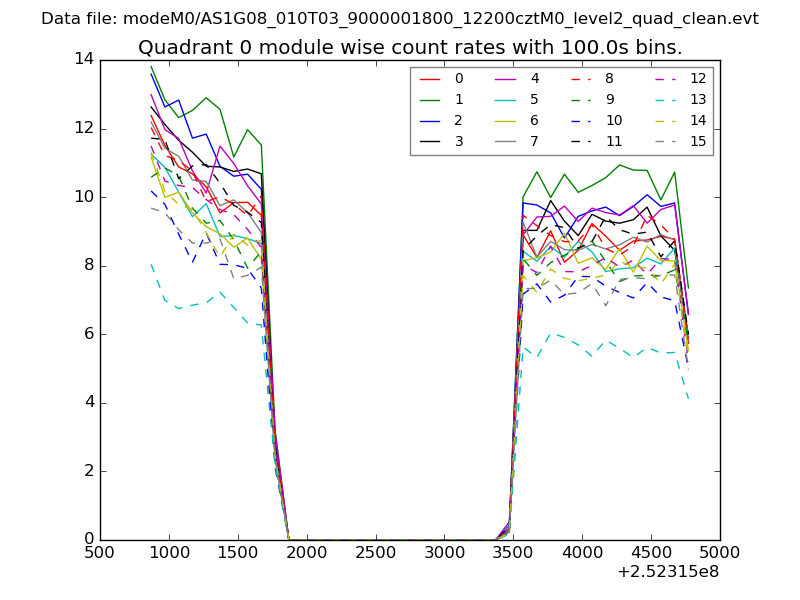 |
 |
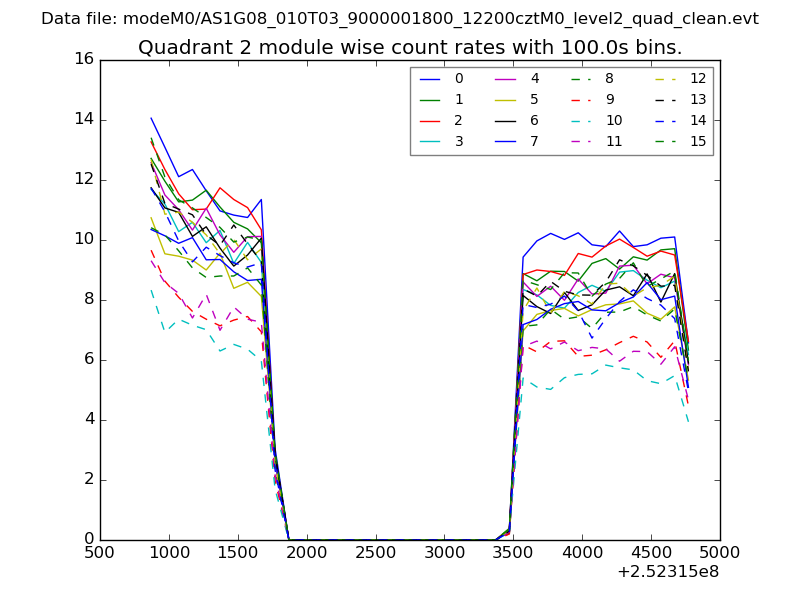
| Module-wise count rates for Quadrant B Data is divided into 100 sec bins |
 |
 |
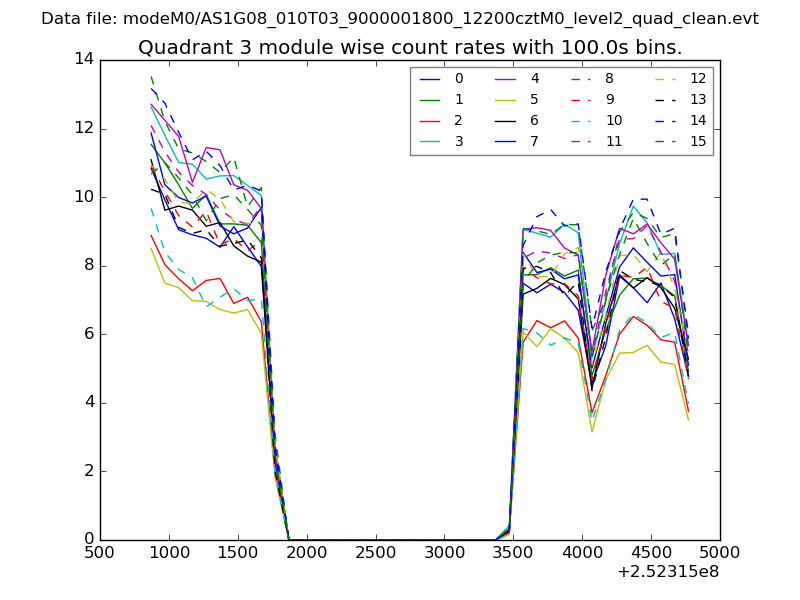
| Module-wise count rates for Quadrant C Data is divided into 100 sec bins |
 |
 |
| Module-wise count rates for Quadrant D Data is divided into 100 sec bins |
 |
 |
| Parameter | Plot |
|---|---|
| CZT HV Monitor | 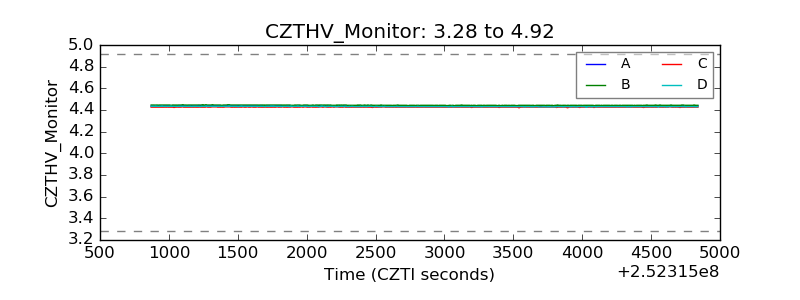 |
| D_VDD | 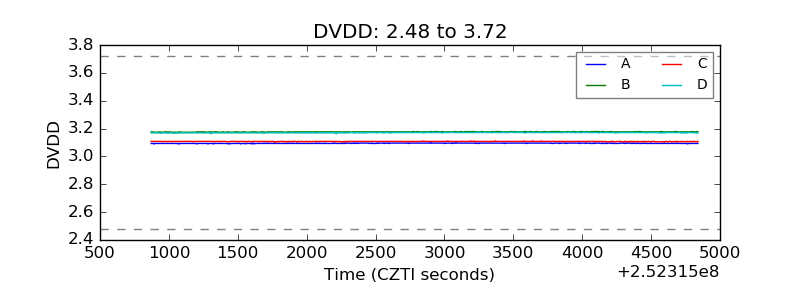 |
| Temperature 1 | 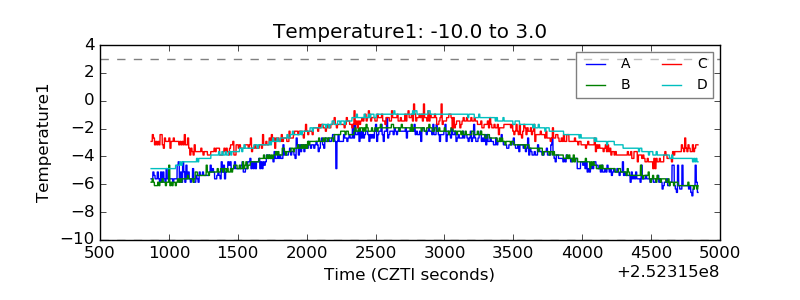 |
| Veto HV Monitor | 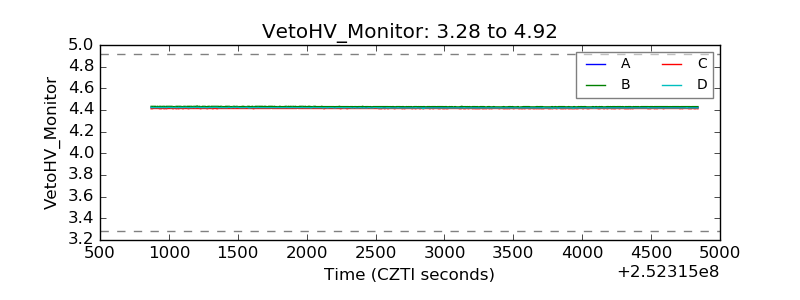 |
| Veto LLD |  |
| Alpha Counter | 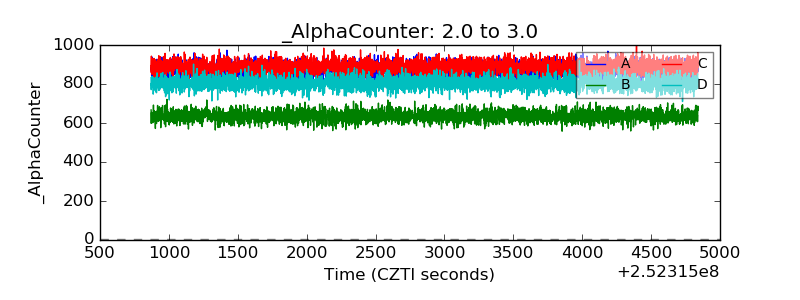 |
| _CPM_Rate | 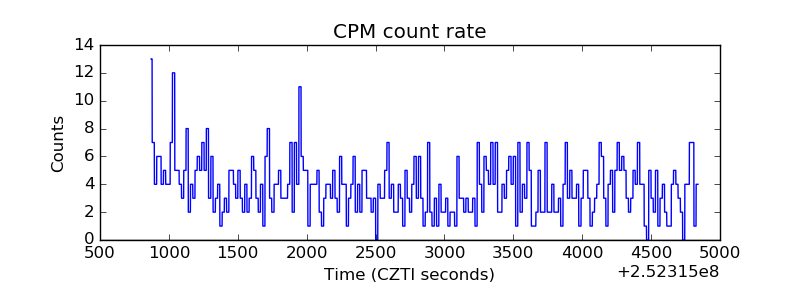 |
| CZT Counter | 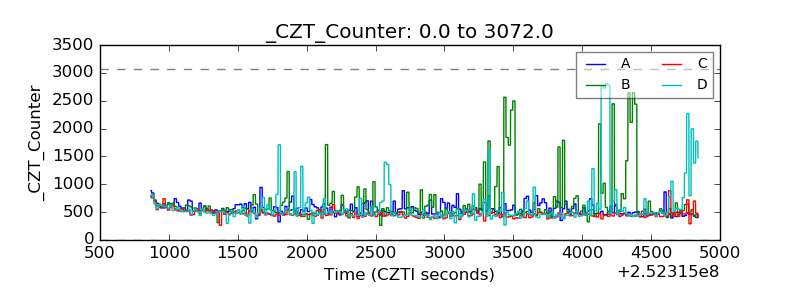 |
| +2.5 Volts monitor | 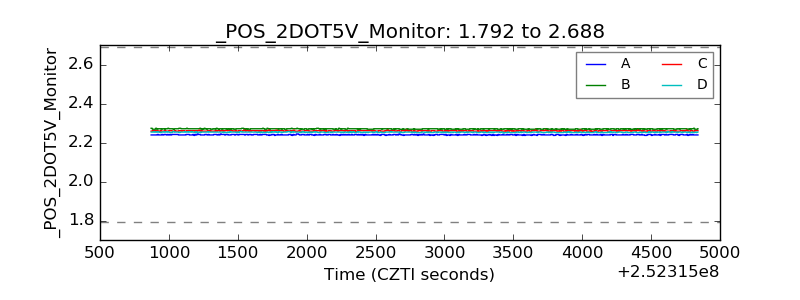 |
| +5 Volts monitor |  |
| _ROLL_ROT | 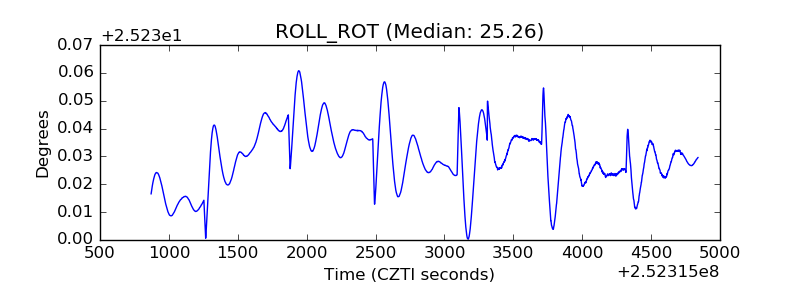 |
| _Roll_DEC | 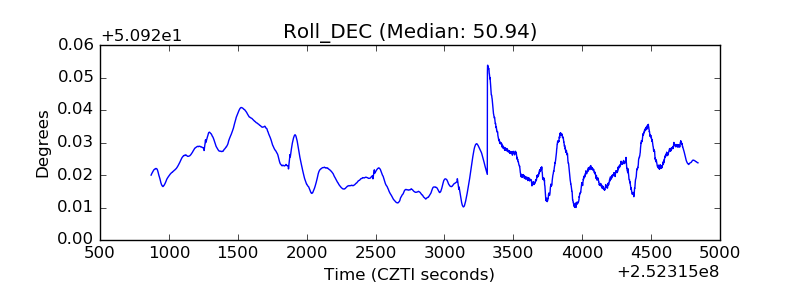 |
| _Roll_RA | 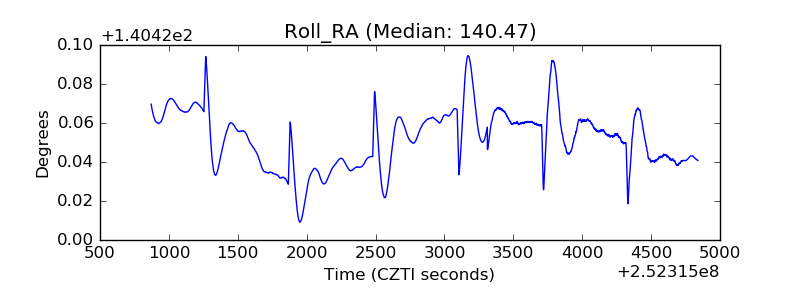 |
| Veto Counter | 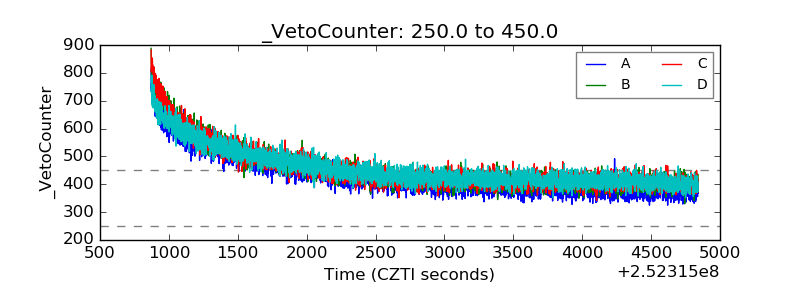 |