| Param | Original file | Final file |
|---|---|---|
| Filename | modeM0/AS1A04_066T01_9000001802_12201cztM0_level2.evt | modeM0/AS1A04_066T01_9000001802_12201cztM0_level2_quad_clean.evt |
| Size (bytes) | 561,841,920 | 140,230,080 |
| Size | 535.8 MB | 133.7 MB |
| Events in quadrant A | 3,926,939 | 976,478 |
| Events in quadrant B | 5,318,506 | 932,953 |
| Events in quadrant C | 3,224,990 | 966,730 |
| Events in quadrant D | 4,100,563 | 913,807 |
| Mode SS | |||
|---|---|---|---|
| Quadrant | BADHDUFLAG | Total packets | Discarded packets |
| A | 0 | 134 | 0 |
| B | 0 | 134 | 0 |
| C | 0 | 134 | 0 |
| D | 0 | 134 | 0 |
| Mode M0 | |||
|---|---|---|---|
| Quadrant | BADHDUFLAG | Total packets | Discarded packets |
| A | 0 | 16141 | 3 |
| B | 0 | 20311 | 2 |
| C | 0 | 13948 | 2 |
| D | 0 | 16531 | 2 |
| Mode M9 | |||
|---|---|---|---|
| Quadrant | BADHDUFLAG | Total packets | Discarded packets |
| A | 0 | 13 | 0 |
| B | 0 | 13 | 0 |
| C | 0 | 13 | 0 |
| D | 0 | 14 | 0 |
| Quadrant | Total seconds | Saturated seconds | Saturation percentage |
|---|---|---|---|
| A | 6552 | 121 | 1.846764% |
| B | 6552 | 733 | 11.187424% |
| C | 6552 | 64 | 0.976801% |
| D | 6552 | 216 | 3.296703% |
Noise dominated data is calculated using 1-second bins in cleaned event files. If a bin has >2000 counts, and if more than 50% of those come from <1% of pixels, then it is considered to be noise-dominated and hence unusable.
| Quadrant | # 1 sec bins | Bins with >0 counts | Bins with >2000 counts | High rate bins dominated by noise | Noise dominated (total time) | Noise dominated (detector-on time) | Marked lightcurve |
|---|---|---|---|---|---|---|---|
| A | 7888 | 6554 | 1 | 1 | 0.01% | 0.02% | 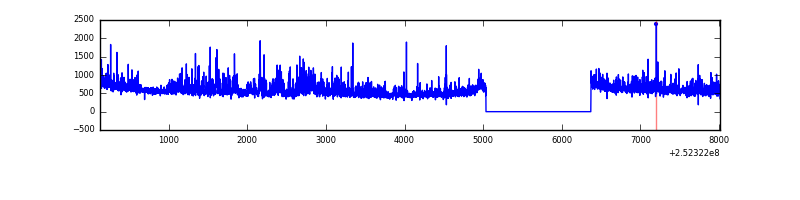 |
| B | 7888 | 6554 | 418 | 418 | 5.30% | 6.38% | 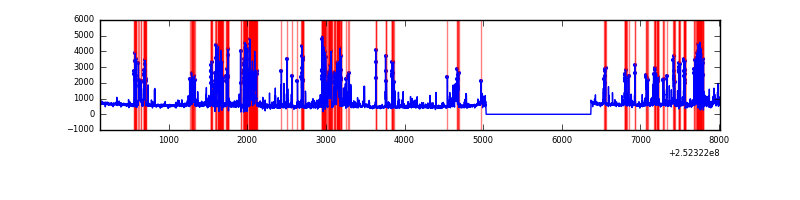 |
| C | 7888 | 6554 | 0 | 0 | 0.00% | 0.00% | 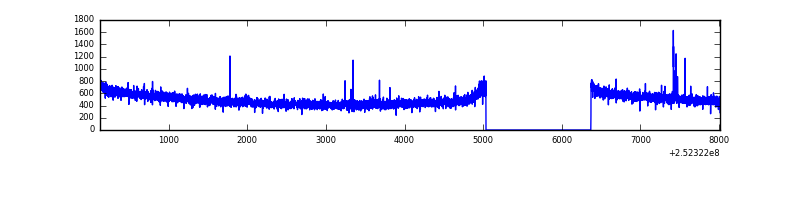 |
| D | 7888 | 6554 | 139 | 139 | 1.76% | 2.12% | 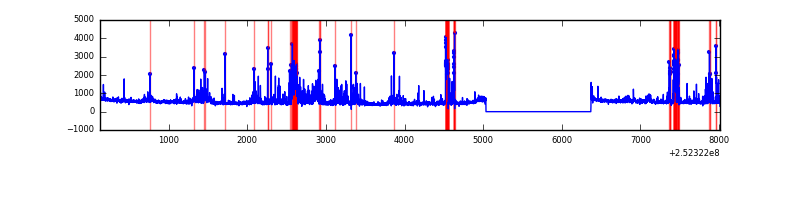 |
Top three noisy pixels from each quadrant. If the there are fewer than three noisy pixels in the level2.evt file, extra rows are filled as -1
| Pixel properties | Quadrant properties | ||||||
|---|---|---|---|---|---|---|---|
| Quadrant | DetID | PixID | Counts | Sigma | Mean | Median | Sigma |
| A | 1 | 162 | 178514 | 1052.21 | 855 | 843 | 168.9 |
| A | 8 | 15 | 147758 | 870.06 | 855 | 843 | 168.9 |
| A | 1 | 178 | 101614 | 596.79 | 855 | 843 | 168.9 |
| B | 4 | 239 | 1412024 | 9581.03 | 809 | 793 | 147.3 |
| B | 3 | 64 | 260096 | 1760.44 | 809 | 793 | 147.3 |
| B | 4 | 173 | 133765 | 902.76 | 809 | 793 | 147.3 |
| C | 4 | 175 | 18001 | 93.06 | 817 | 823 | 184.6 |
| C | 0 | 207 | 7079 | 33.89 | 817 | 823 | 184.6 |
| C | 15 | 208 | 6766 | 32.2 | 817 | 823 | 184.6 |
| D | 13 | 104 | 371781 | 1964.93 | 814 | 794 | 188.8 |
| D | 2 | 33 | 279181 | 1474.48 | 814 | 794 | 188.8 |
| D | 12 | 221 | 90261 | 473.86 | 814 | 794 | 188.8 |
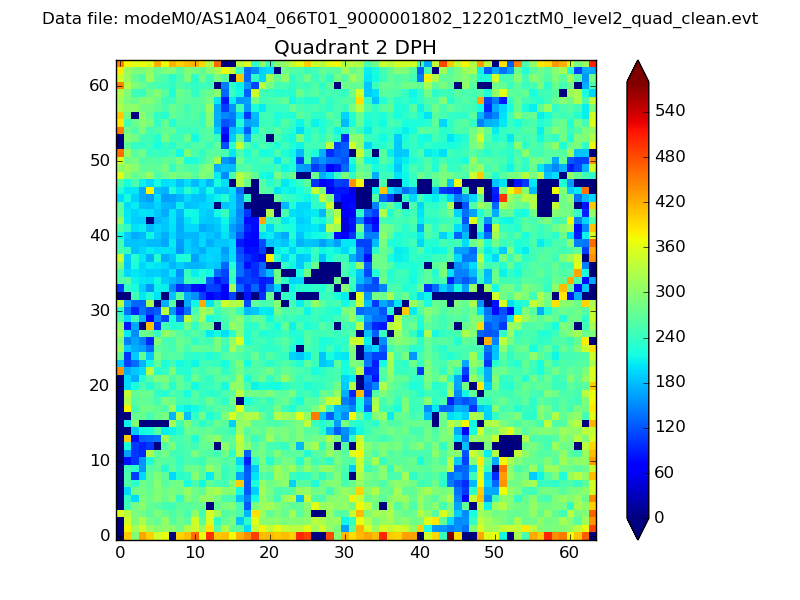
Histogram calculated using DETX and DETY for each event in the final _common_clean file
| Quadrant A | 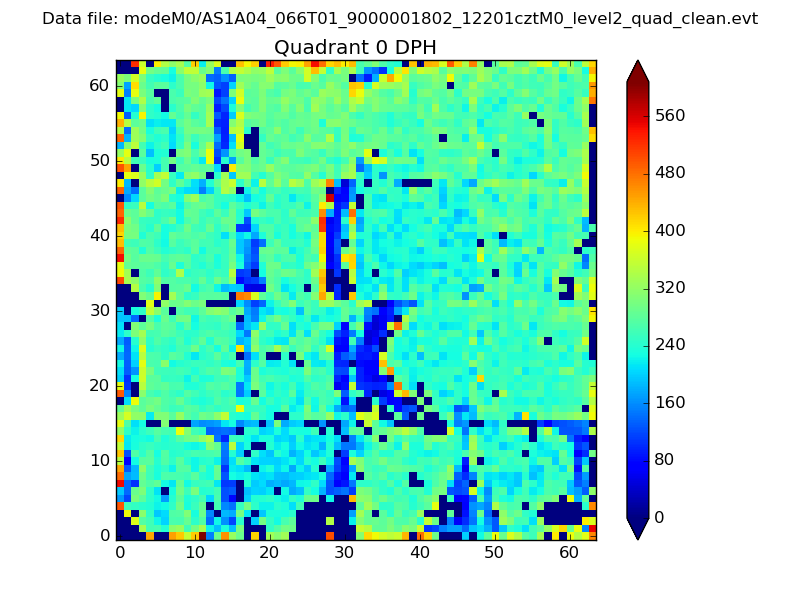 |
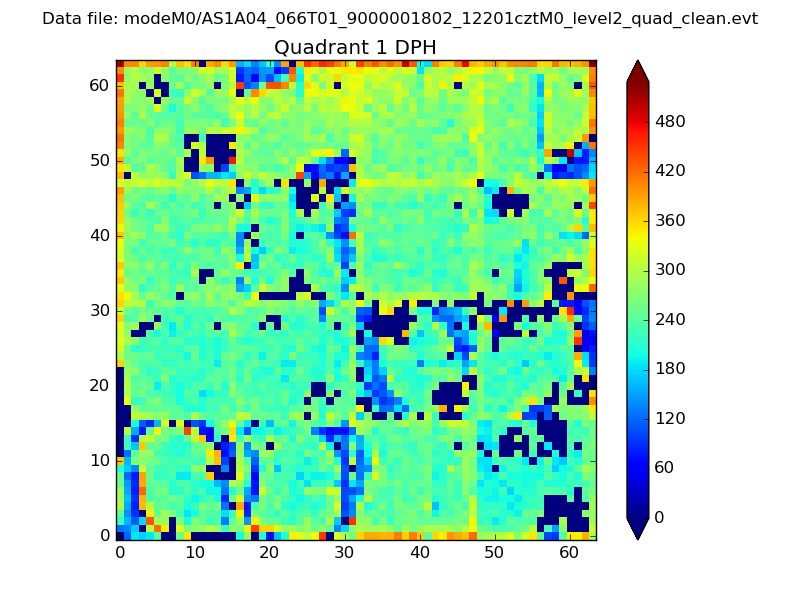 |
Quadrant B |
|---|---|---|---|
| Quadrant D | 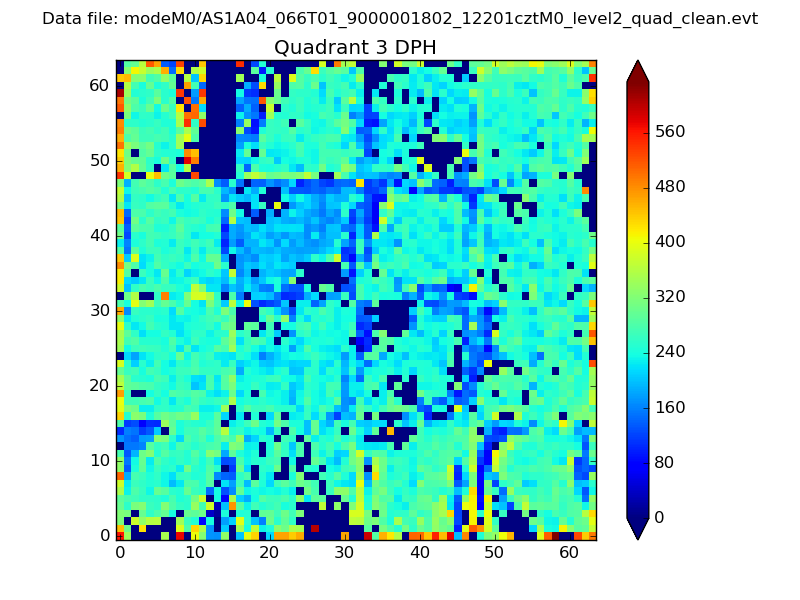 |
 |
Quadrant C |
| Plot type | Count rate plots | Images |
|---|---|---|
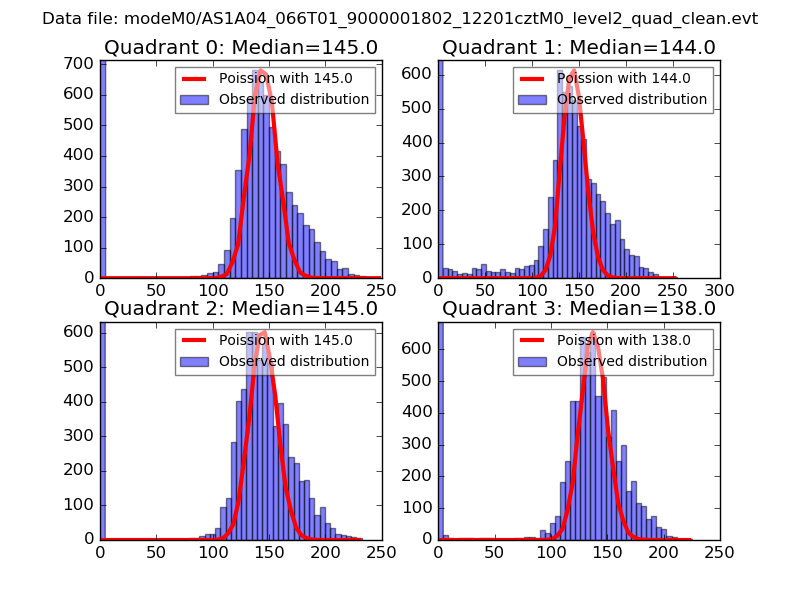
| Comparison with Poisson distribution Blue bars denote a histogram of data divided into 1 sec bins. Red curve is a Poisson curve with rate = median count rate of data. |
 |
 |
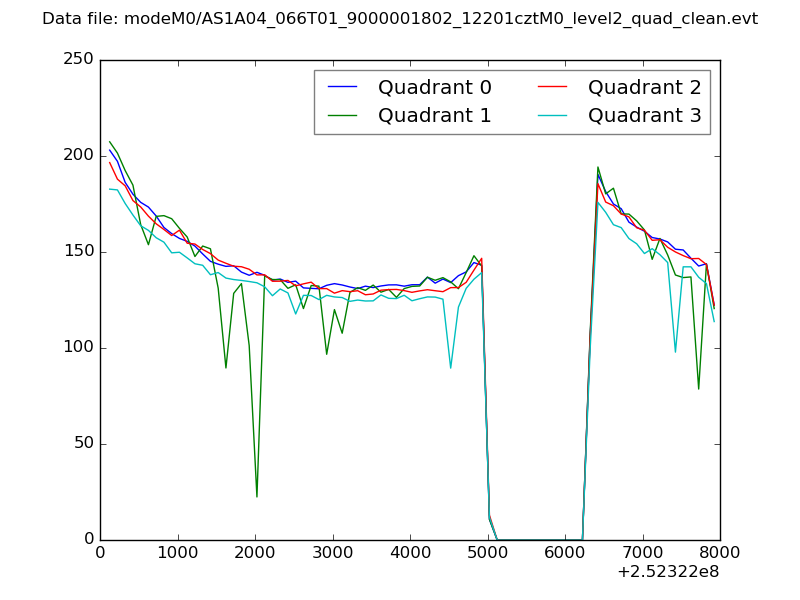
| Quadrant-wise count rates Data is divided into 100 sec bins |
 |
|
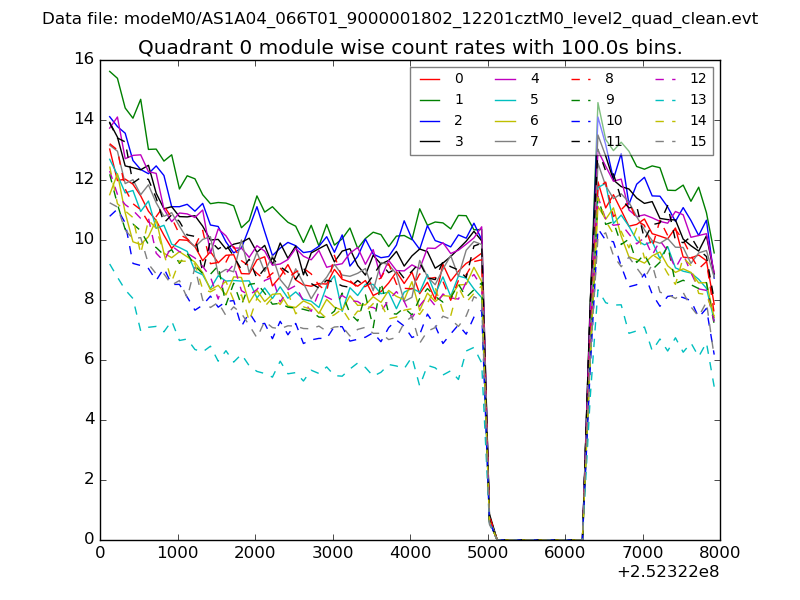
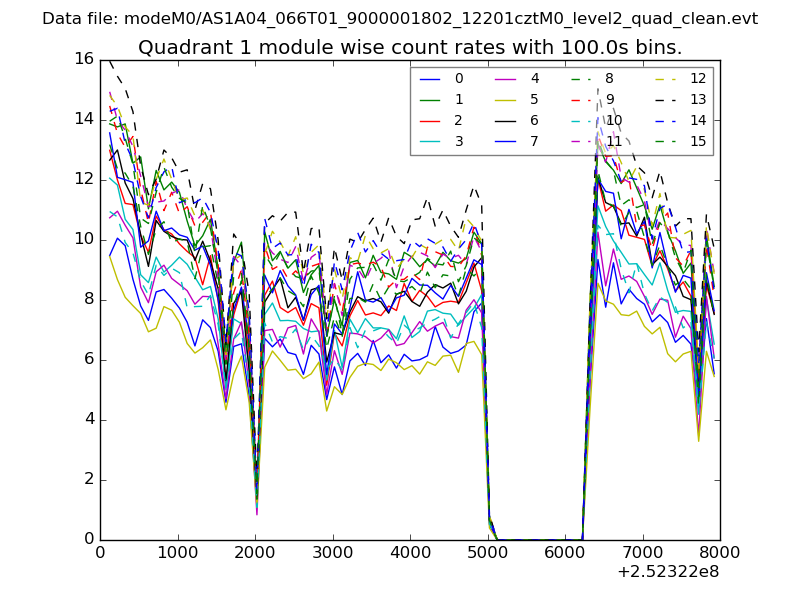
| Module-wise count rates for Quadrant A Data is divided into 100 sec bins |
 |
 |
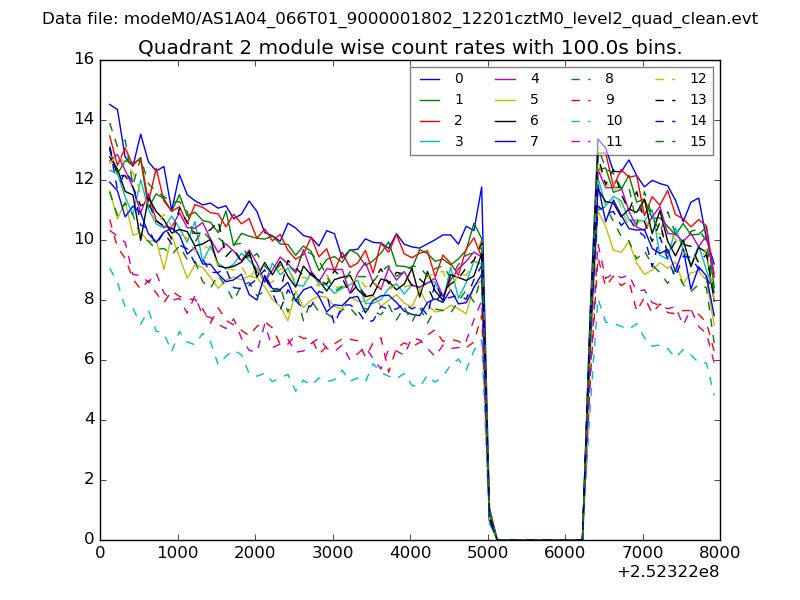
| Module-wise count rates for Quadrant B Data is divided into 100 sec bins |
 |
 |
| Module-wise count rates for Quadrant C Data is divided into 100 sec bins |
 |
 |
| Module-wise count rates for Quadrant D Data is divided into 100 sec bins |
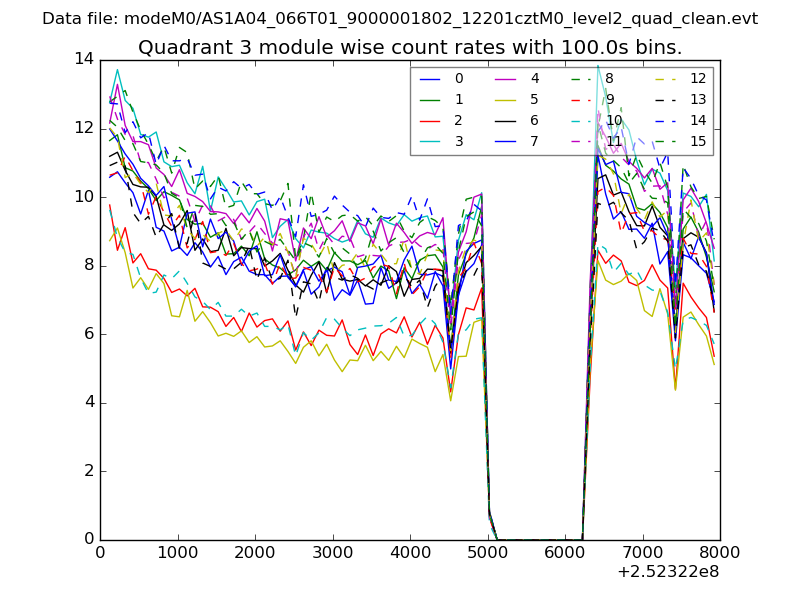 |
 |
| Parameter | Plot |
|---|---|
| CZT HV Monitor | 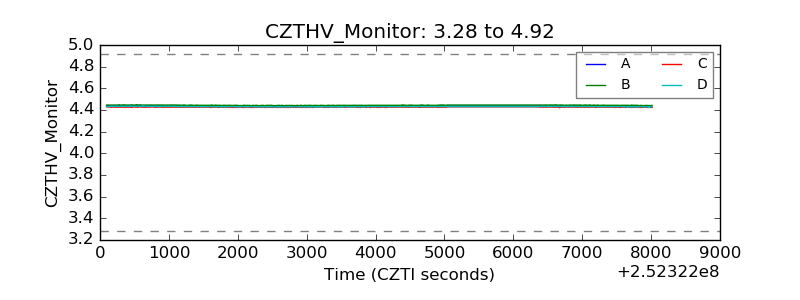 |
| D_VDD | 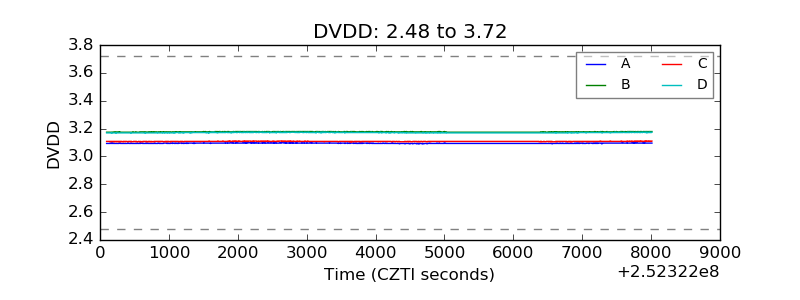 |
| Temperature 1 | 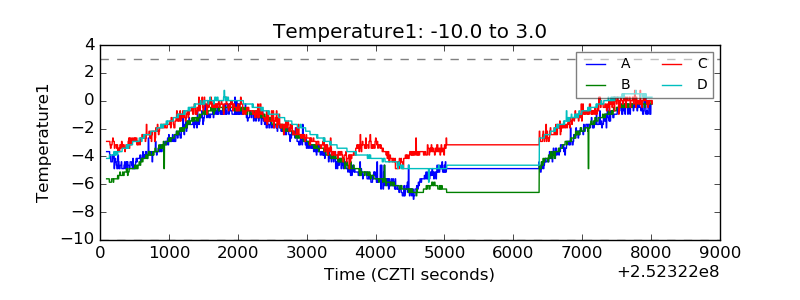 |
| Veto HV Monitor | 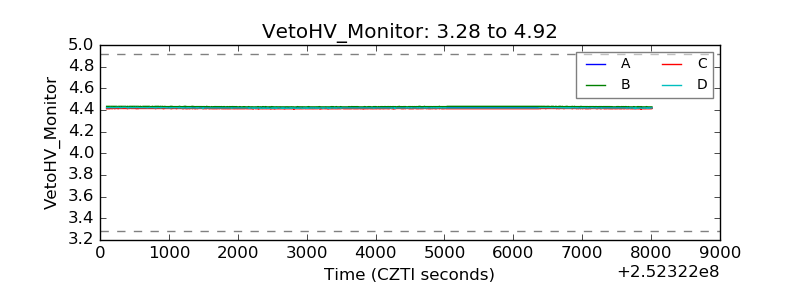 |
| Veto LLD | 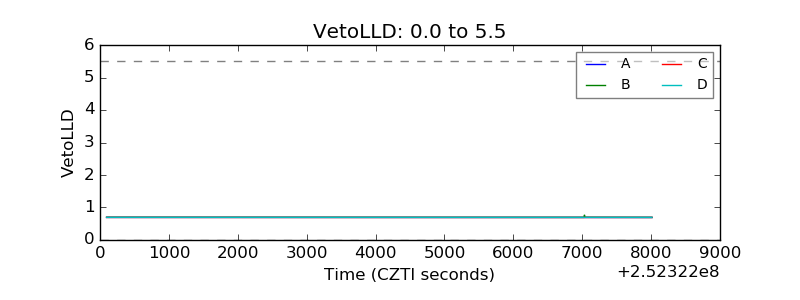 |
| Alpha Counter | 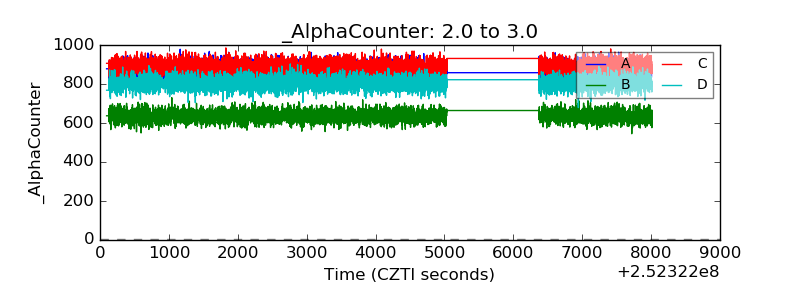 |
| _CPM_Rate | 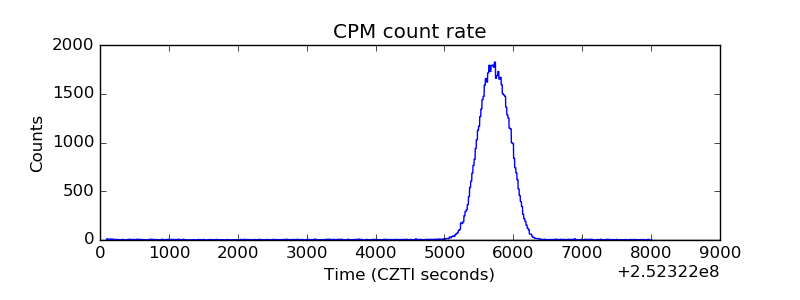 |
| CZT Counter | 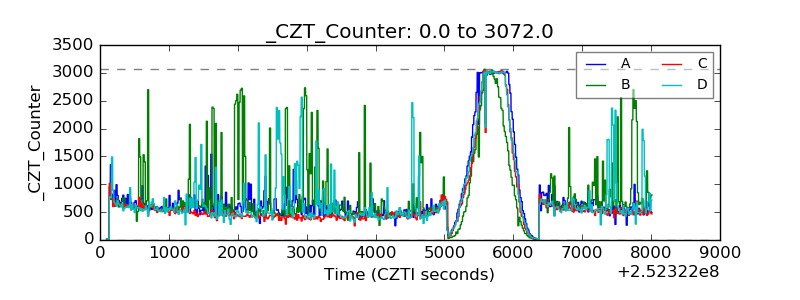 |
| +2.5 Volts monitor |  |
| +5 Volts monitor |  |
| _ROLL_ROT | 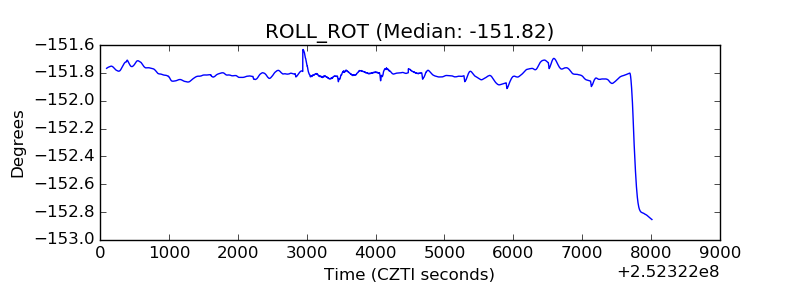 |
| _Roll_DEC | 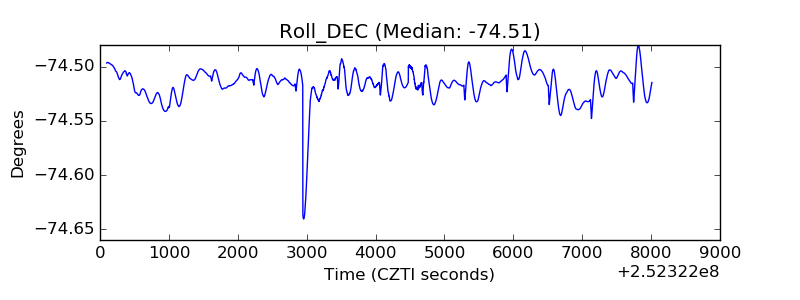 |
| _Roll_RA |  |
| Veto Counter | 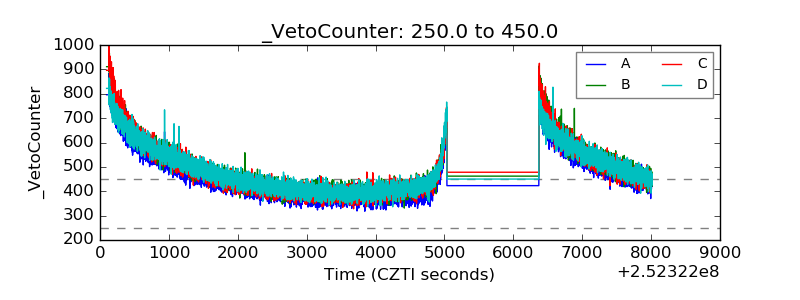 |