| Param | Original file | Final file |
|---|---|---|
| Filename | modeM0/AS1A04_066T01_9000001802_12202cztM0_level2.evt | modeM0/AS1A04_066T01_9000001802_12202cztM0_level2_quad_clean.evt |
| Size (bytes) | 625,187,520 | 124,986,240 |
| Size | 596.2 MB | 119.2 MB |
| Events in quadrant A | 3,707,767 | 883,608 |
| Events in quadrant B | 6,612,936 | 787,135 |
| Events in quadrant C | 3,493,308 | 865,944 |
| Events in quadrant D | 4,700,222 | 815,327 |
| Mode SS | |||
|---|---|---|---|
| Quadrant | BADHDUFLAG | Total packets | Discarded packets |
| A | 0 | 126 | 0 |
| B | 0 | 126 | 0 |
| C | 0 | 126 | 0 |
| D | 0 | 126 | 0 |
| Mode M0 | |||
|---|---|---|---|
| Quadrant | BADHDUFLAG | Total packets | Discarded packets |
| A | 0 | 15205 | 2 |
| B | 0 | 23938 | 1 |
| C | 0 | 14446 | 1 |
| D | 0 | 18132 | 1 |
| Mode M9 | |||
|---|---|---|---|
| Quadrant | BADHDUFLAG | Total packets | Discarded packets |
| A | 0 | 13 | 0 |
| B | 0 | 13 | 0 |
| C | 0 | 13 | 0 |
| D | 0 | 13 | 0 |
| Quadrant | Total seconds | Saturated seconds | Saturation percentage |
|---|---|---|---|
| A | 6200 | 152 | 2.451613% |
| B | 6200 | 1379 | 22.241935% |
| C | 6200 | 115 | 1.854839% |
| D | 6200 | 429 | 6.919355% |
Noise dominated data is calculated using 1-second bins in cleaned event files. If a bin has >2000 counts, and if more than 50% of those come from <1% of pixels, then it is considered to be noise-dominated and hence unusable.
| Quadrant | # 1 sec bins | Bins with >0 counts | Bins with >2000 counts | High rate bins dominated by noise | Noise dominated (total time) | Noise dominated (detector-on time) | Marked lightcurve |
|---|---|---|---|---|---|---|---|
| A | 7496 | 6202 | 25 | 25 | 0.33% | 0.40% | 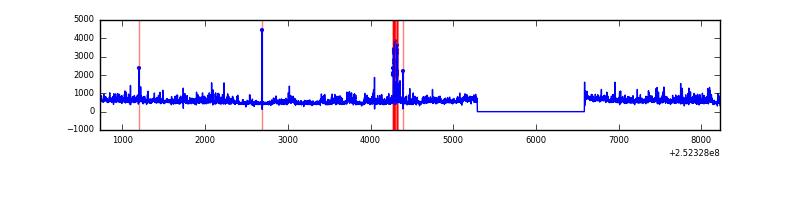 |
| B | 7496 | 6202 | 863 | 863 | 11.51% | 13.91% | 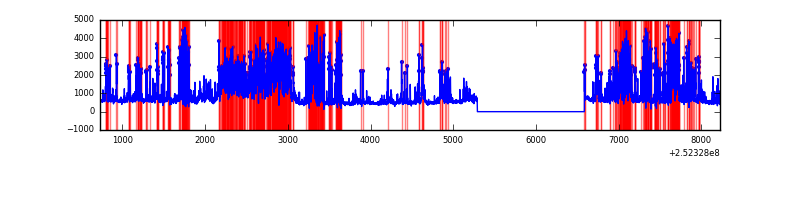 |
| C | 7496 | 6202 | 54 | 54 | 0.72% | 0.87% | 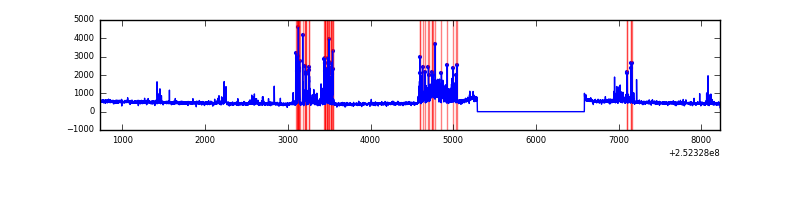 |
| D | 7496 | 6202 | 301 | 301 | 4.02% | 4.85% | 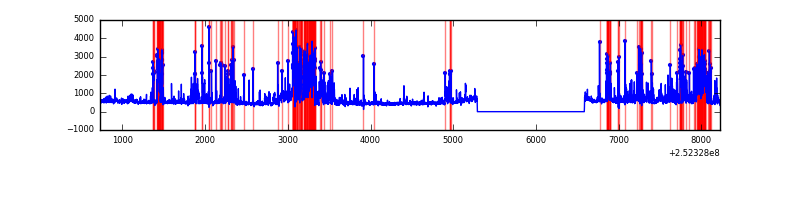 |
Top three noisy pixels from each quadrant. If the there are fewer than three noisy pixels in the level2.evt file, extra rows are filled as -1
| Pixel properties | Quadrant properties | ||||||
|---|---|---|---|---|---|---|---|
| Quadrant | DetID | PixID | Counts | Sigma | Mean | Median | Sigma |
| A | 8 | 15 | 229227 | 1455.25 | 779 | 764 | 157.0 |
| A | 1 | 162 | 153191 | 970.92 | 779 | 764 | 157.0 |
| A | 1 | 178 | 85664 | 540.79 | 779 | 764 | 157.0 |
| B | 4 | 239 | 2986316 | 23064.29 | 701 | 686 | 129.4 |
| B | 10 | 16 | 493212 | 3804.81 | 701 | 686 | 129.4 |
| B | 15 | 204 | 111147 | 853.32 | 701 | 686 | 129.4 |
| C | 5 | 112 | 304088 | 1803.38 | 740 | 745 | 168.2 |
| C | 15 | 208 | 267195 | 1584.05 | 740 | 745 | 168.2 |
| C | 4 | 175 | 23065 | 132.69 | 740 | 745 | 168.2 |
| D | 2 | 33 | 764523 | 4432.53 | 732 | 712 | 172.3 |
| D | 1 | 52 | 244063 | 1412.21 | 732 | 712 | 172.3 |
| D | 12 | 221 | 200474 | 1159.25 | 732 | 712 | 172.3 |
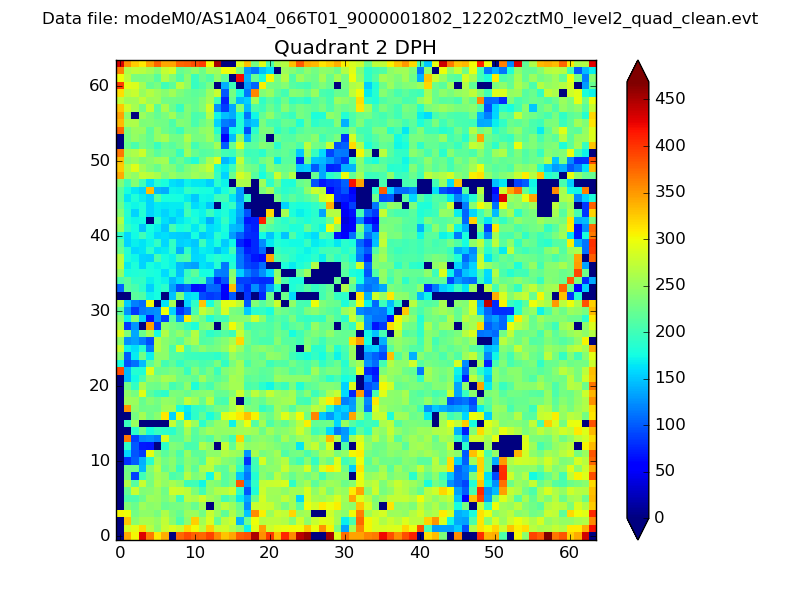
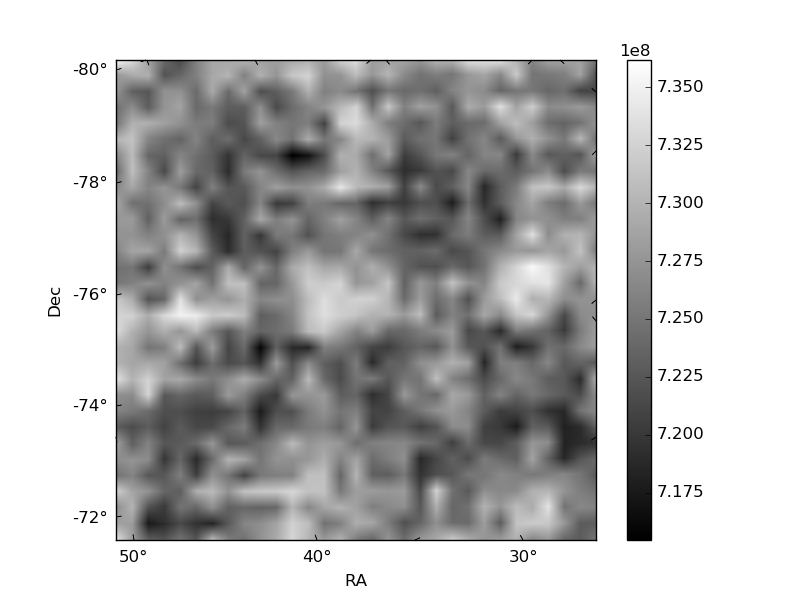
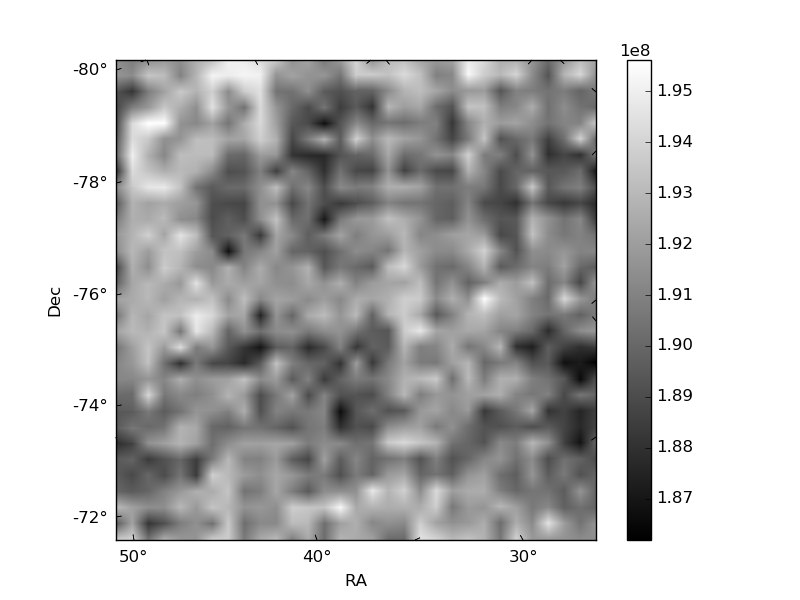
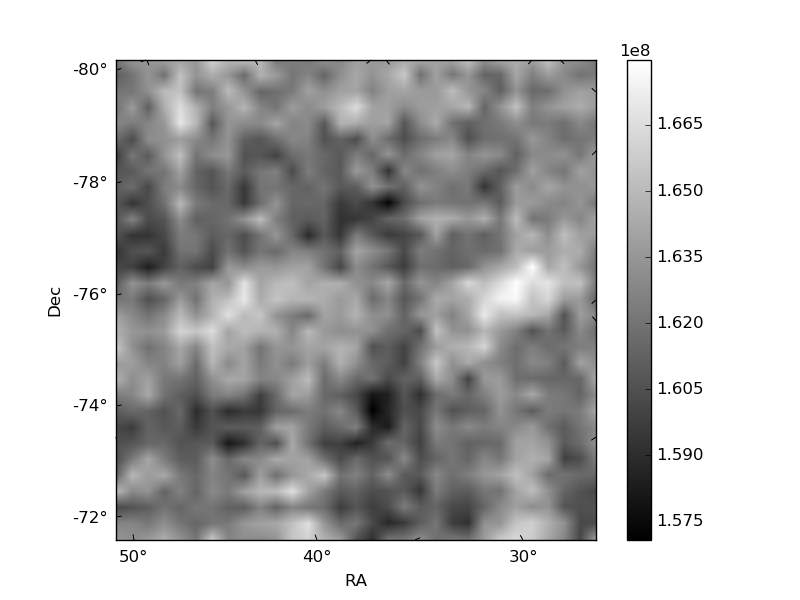
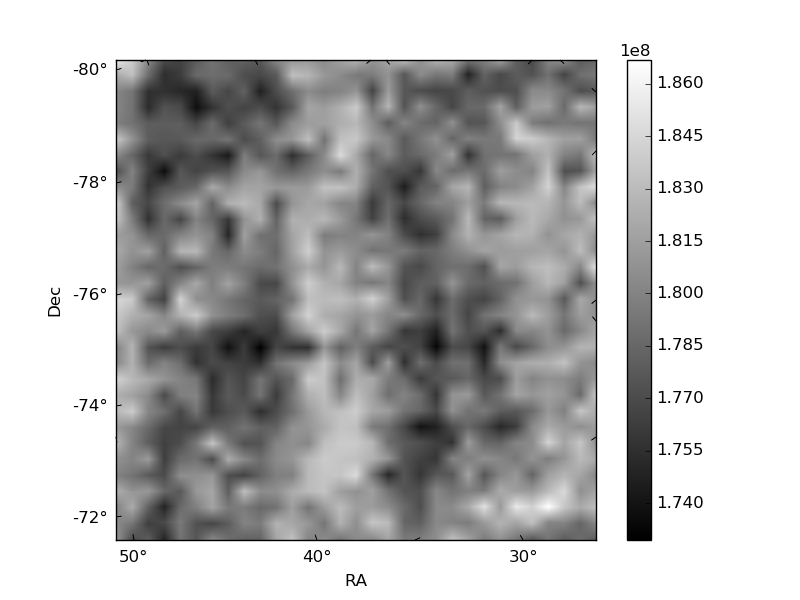
Histogram calculated using DETX and DETY for each event in the final _common_clean file
| Quadrant A | 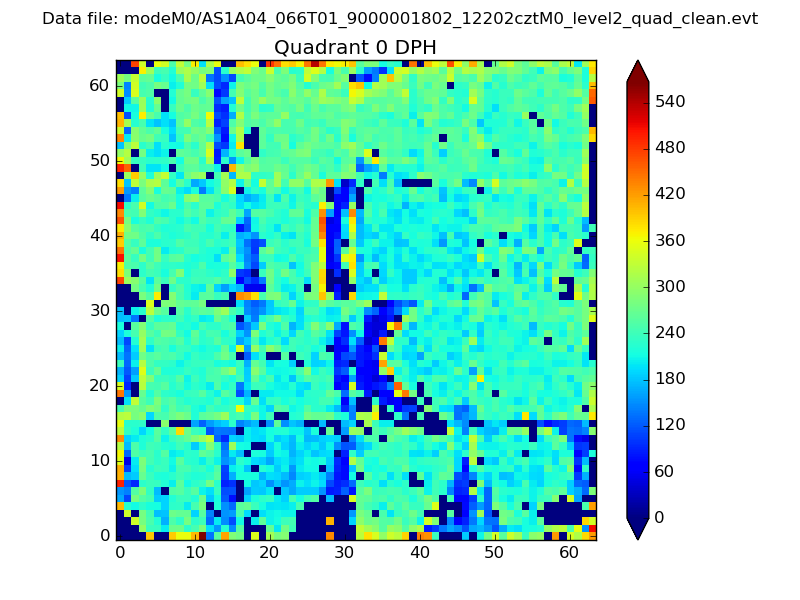 |
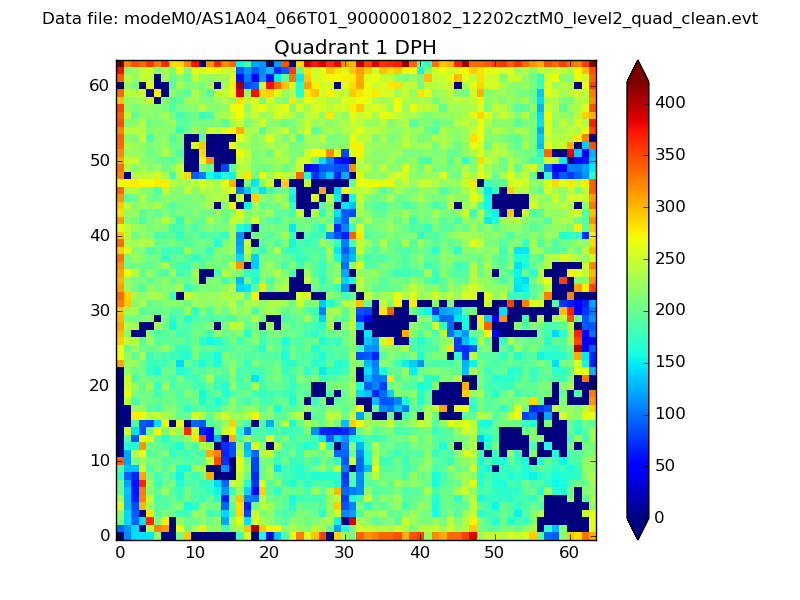 |
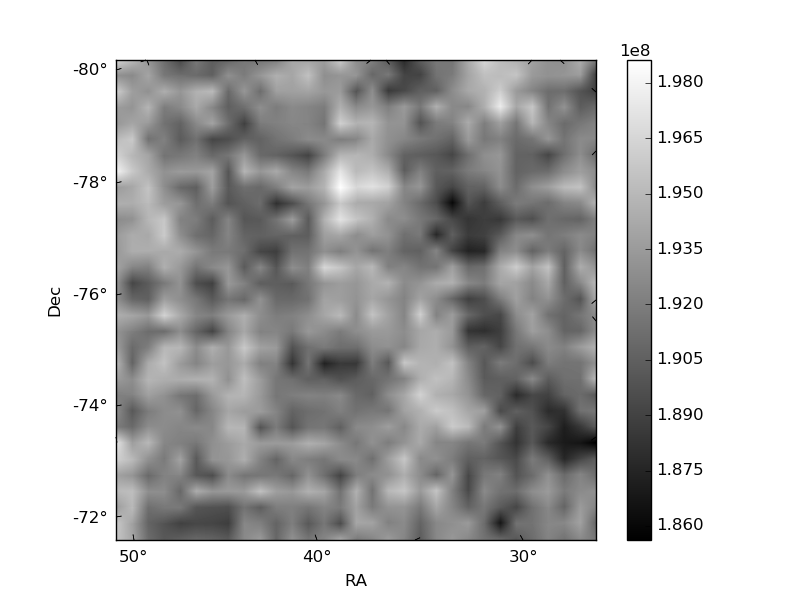
Quadrant B |
|---|---|---|---|
| Quadrant D | 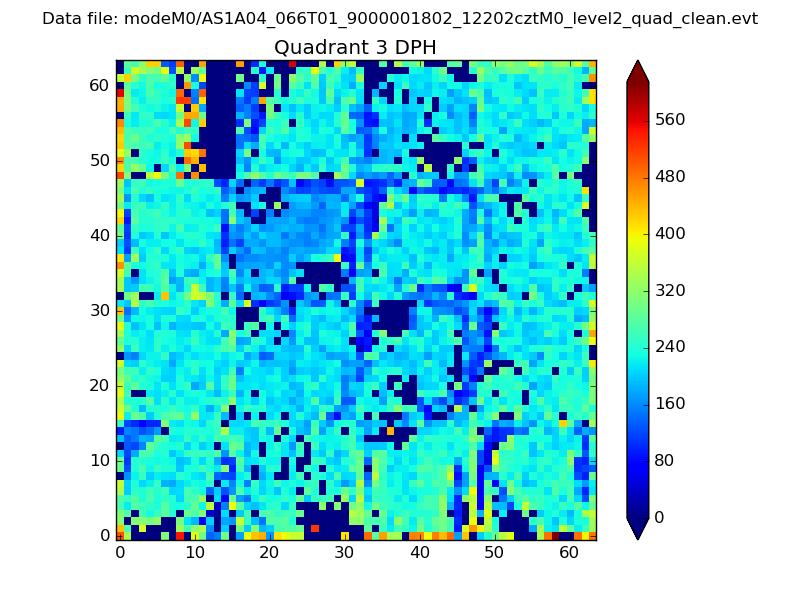 |
 |
Quadrant C |
| Plot type | Count rate plots | Images |
|---|---|---|
| Comparison with Poisson distribution Blue bars denote a histogram of data divided into 1 sec bins. Red curve is a Poisson curve with rate = median count rate of data. |
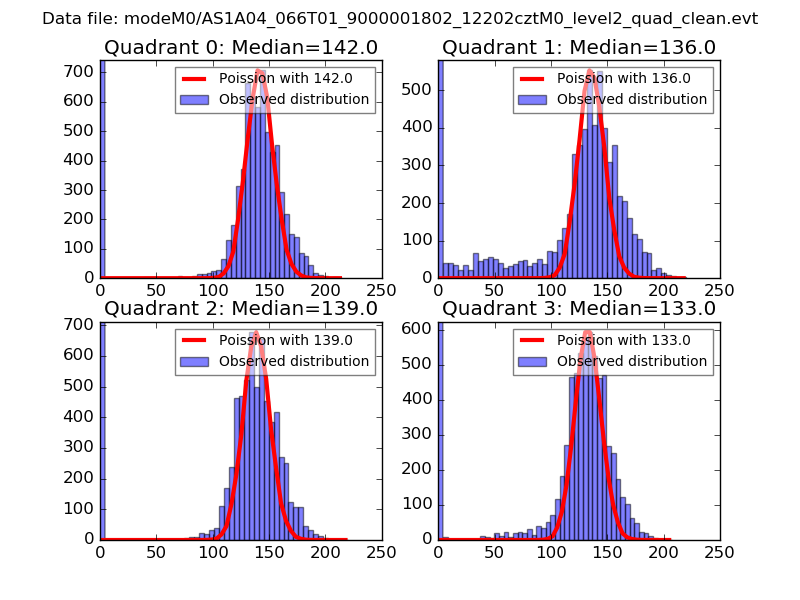 |
 |
| Quadrant-wise count rates Data is divided into 100 sec bins |
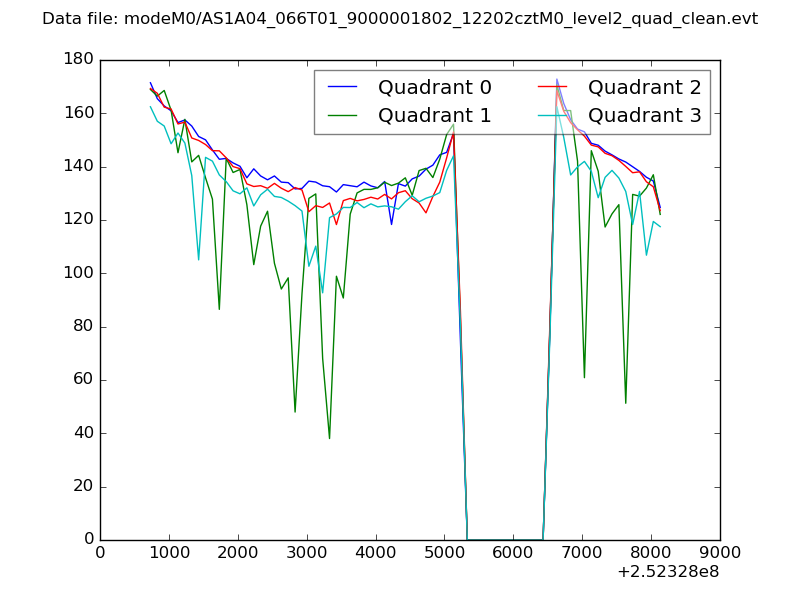 |
|
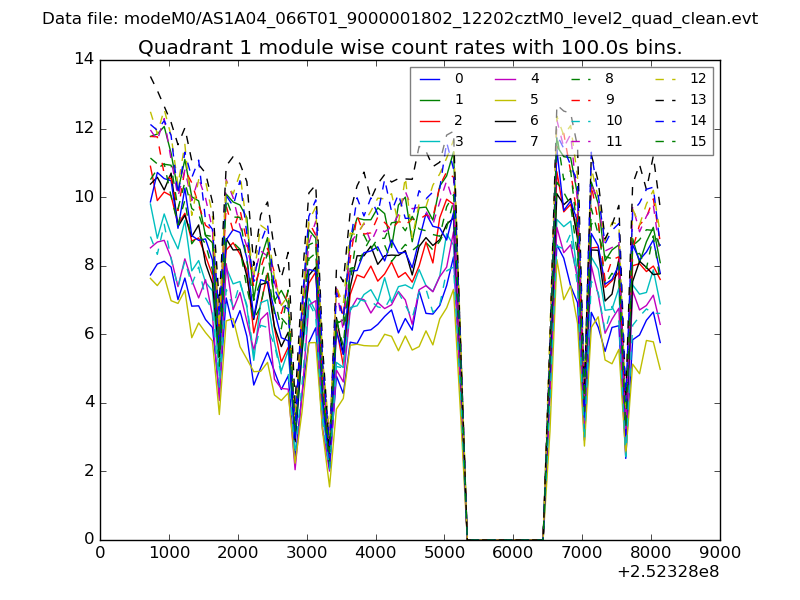
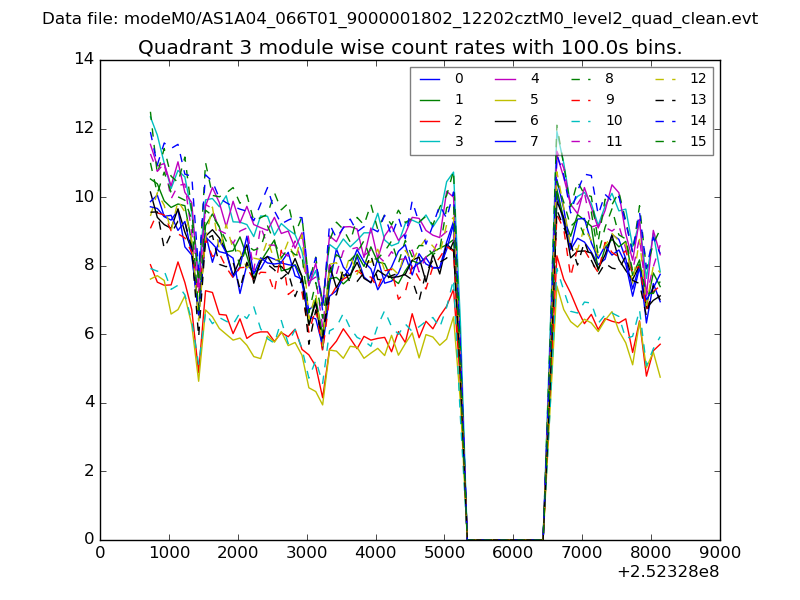
| Module-wise count rates for Quadrant A Data is divided into 100 sec bins |
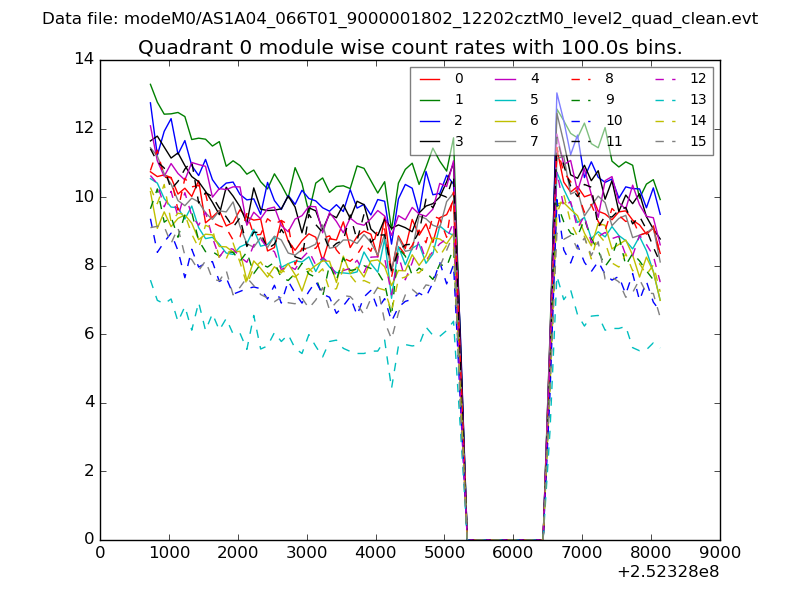 |
 |
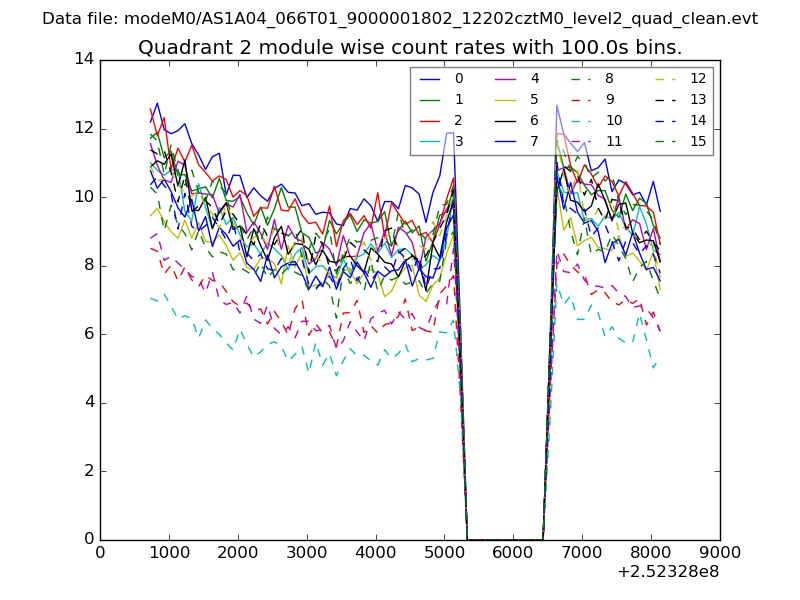
| Module-wise count rates for Quadrant B Data is divided into 100 sec bins |
 |
 |
| Module-wise count rates for Quadrant C Data is divided into 100 sec bins |
 |
 |
| Module-wise count rates for Quadrant D Data is divided into 100 sec bins |
 |
 |
| Parameter | Plot |
|---|---|
| CZT HV Monitor | 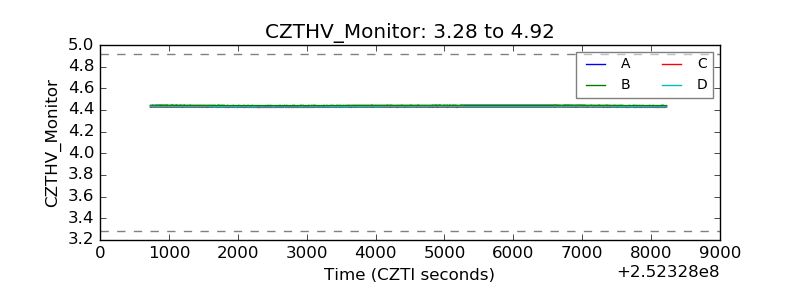 |
| D_VDD | 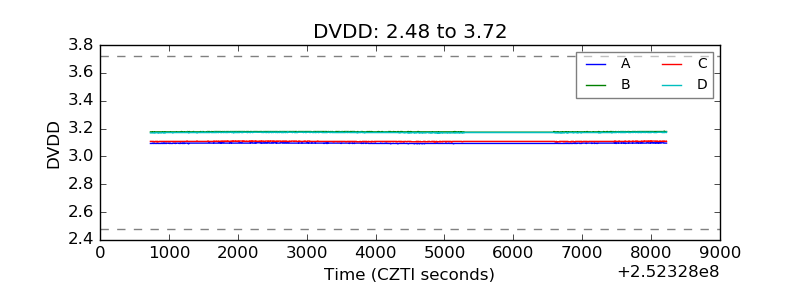 |
| Temperature 1 | 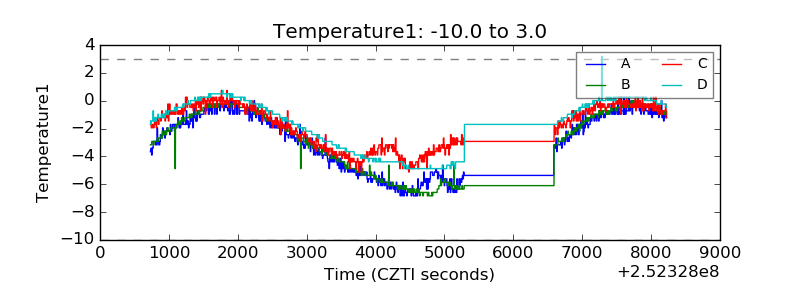 |
| Veto HV Monitor | 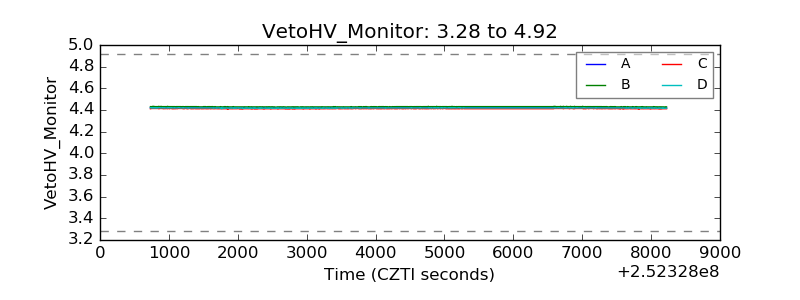 |
| Veto LLD | 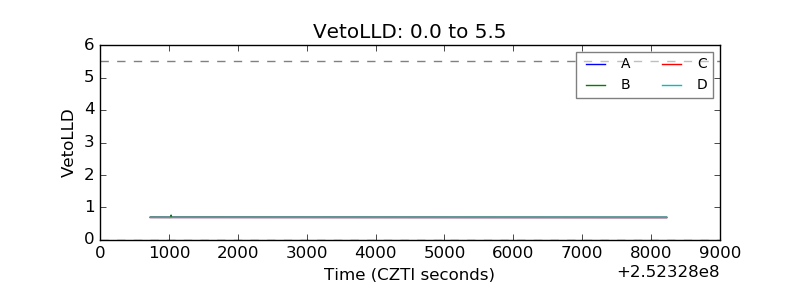 |
| Alpha Counter | 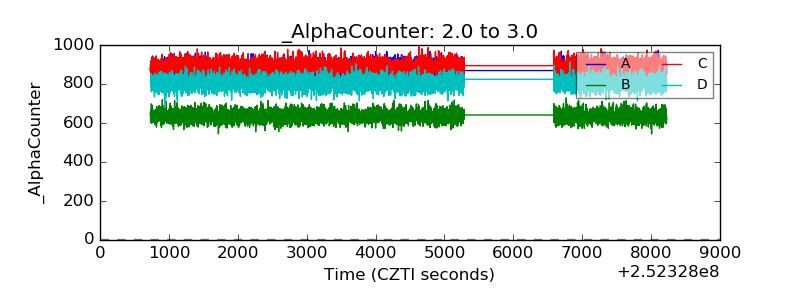 |
| _CPM_Rate | 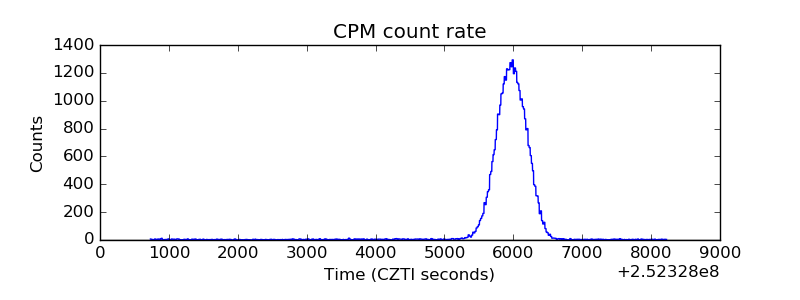 |
| CZT Counter | 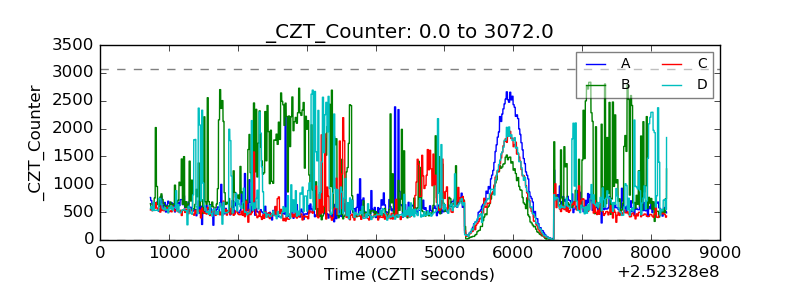 |
| +2.5 Volts monitor |  |
| +5 Volts monitor |  |
| _ROLL_ROT | 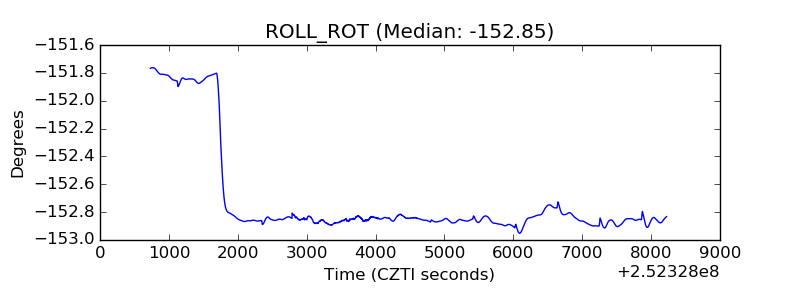 |
| _Roll_DEC | 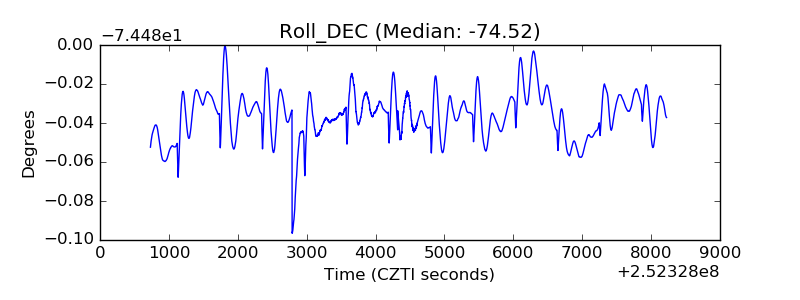 |
| _Roll_RA | 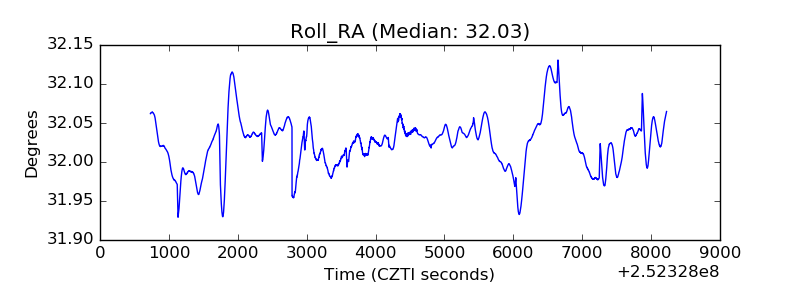 |
| Veto Counter | 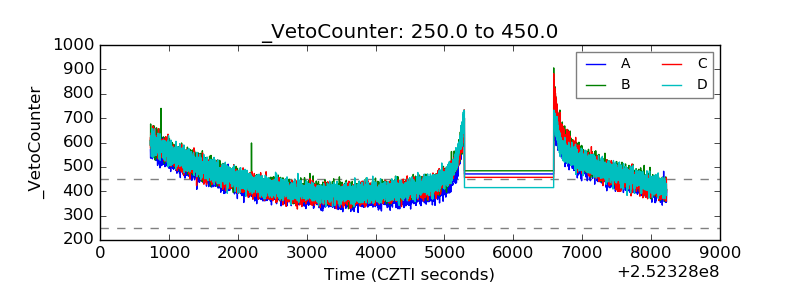 |