| Param | Original file | Final file |
|---|---|---|
| Filename | modeM0/AS1A04_066T01_9000001802_12203cztM0_level2.evt | modeM0/AS1A04_066T01_9000001802_12203cztM0_level2_quad_clean.evt |
| Size (bytes) | 534,965,760 | 115,597,440 |
| Size | 510.2 MB | 110.2 MB |
| Events in quadrant A | 3,555,857 | 801,188 |
| Events in quadrant B | 4,975,673 | 746,801 |
| Events in quadrant C | 2,805,676 | 788,280 |
| Events in quadrant D | 4,455,916 | 743,764 |
| Mode SS | |||
|---|---|---|---|
| Quadrant | BADHDUFLAG | Total packets | Discarded packets |
| A | 0 | 122 | 0 |
| B | 0 | 122 | 0 |
| C | 0 | 122 | 0 |
| D | 0 | 122 | 0 |
| Mode M0 | |||
|---|---|---|---|
| Quadrant | BADHDUFLAG | Total packets | Discarded packets |
| A | 0 | 14601 | 2 |
| B | 0 | 18846 | 1 |
| C | 0 | 12562 | 1 |
| D | 0 | 17365 | 1 |
| Mode M9 | |||
|---|---|---|---|
| Quadrant | BADHDUFLAG | Total packets | Discarded packets |
| A | 0 | 12 | 0 |
| B | 0 | 12 | 0 |
| C | 0 | 12 | 0 |
| D | 0 | 12 | 0 |
| Quadrant | Total seconds | Saturated seconds | Saturation percentage |
|---|---|---|---|
| A | 6022 | 134 | 2.225174% |
| B | 6022 | 781 | 12.969113% |
| C | 6022 | 31 | 0.514779% |
| D | 6022 | 356 | 5.911657% |
Noise dominated data is calculated using 1-second bins in cleaned event files. If a bin has >2000 counts, and if more than 50% of those come from <1% of pixels, then it is considered to be noise-dominated and hence unusable.
| Quadrant | # 1 sec bins | Bins with >0 counts | Bins with >2000 counts | High rate bins dominated by noise | Noise dominated (total time) | Noise dominated (detector-on time) | Marked lightcurve |
|---|---|---|---|---|---|---|---|
| A | 7213 | 6024 | 10 | 10 | 0.14% | 0.17% | 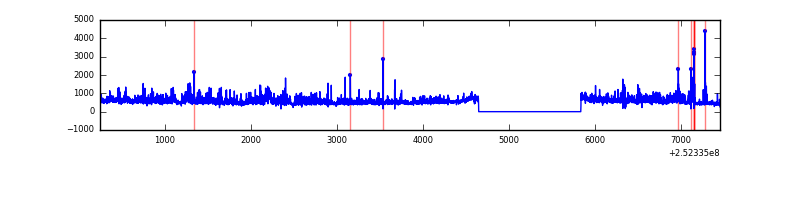 |
| B | 7213 | 6024 | 406 | 406 | 5.63% | 6.74% | 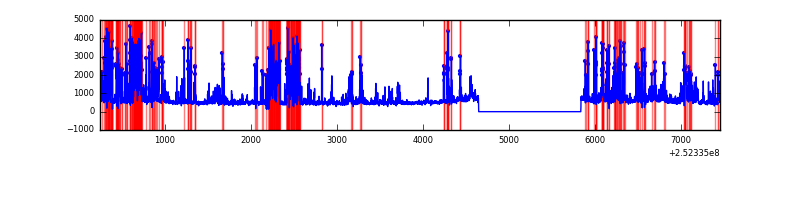 |
| C | 7213 | 6024 | 7 | 7 | 0.10% | 0.12% | 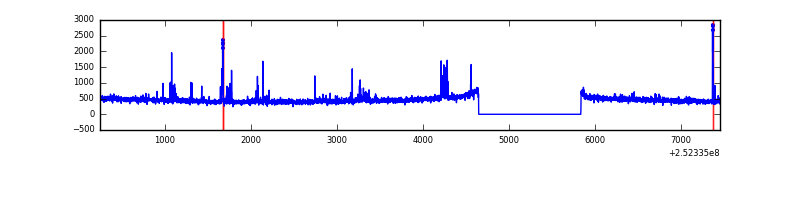 |
| D | 7213 | 6024 | 246 | 246 | 3.41% | 4.08% | 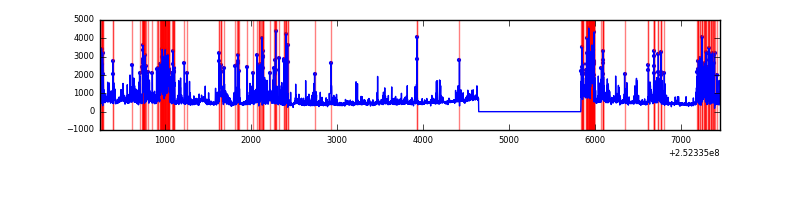 |
Top three noisy pixels from each quadrant. If the there are fewer than three noisy pixels in the level2.evt file, extra rows are filled as -1
| Pixel properties | Quadrant properties | ||||||
|---|---|---|---|---|---|---|---|
| Quadrant | DetID | PixID | Counts | Sigma | Mean | Median | Sigma |
| A | 1 | 162 | 214611 | 1478.44 | 718 | 703 | 144.7 |
| A | 8 | 15 | 147087 | 1011.74 | 718 | 703 | 144.7 |
| A | 1 | 178 | 124224 | 853.72 | 718 | 703 | 144.7 |
| B | 4 | 239 | 1423061 | 11382.89 | 671 | 656 | 125.0 |
| B | 10 | 16 | 309559 | 2472.02 | 671 | 656 | 125.0 |
| B | 3 | 64 | 195085 | 1555.93 | 671 | 656 | 125.0 |
| C | 15 | 208 | 67997 | 431.17 | 684 | 688 | 156.1 |
| C | 5 | 112 | 51171 | 323.38 | 684 | 688 | 156.1 |
| C | 4 | 175 | 15757 | 96.53 | 684 | 688 | 156.1 |
| D | 2 | 33 | 575011 | 3571.3 | 674 | 654 | 160.8 |
| D | 1 | 52 | 446840 | 2774.35 | 674 | 654 | 160.8 |
| D | 13 | 104 | 218853 | 1356.74 | 674 | 654 | 160.8 |
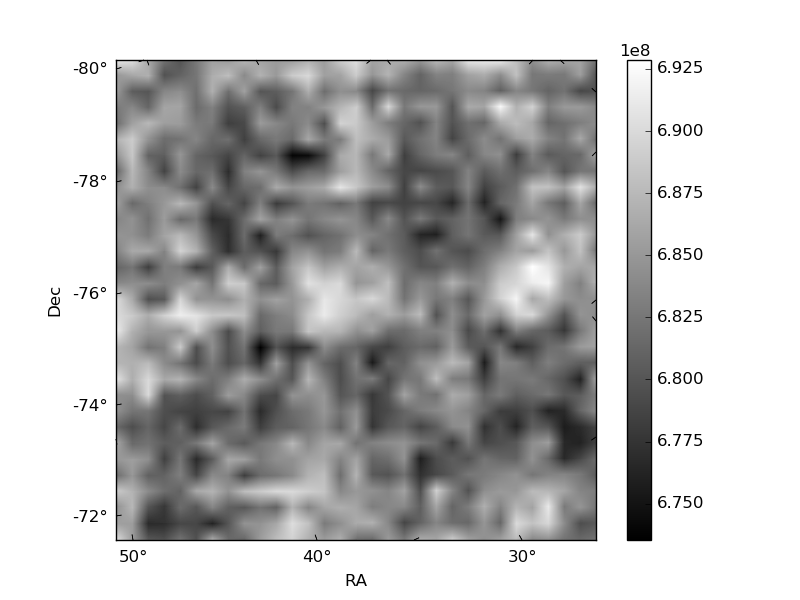
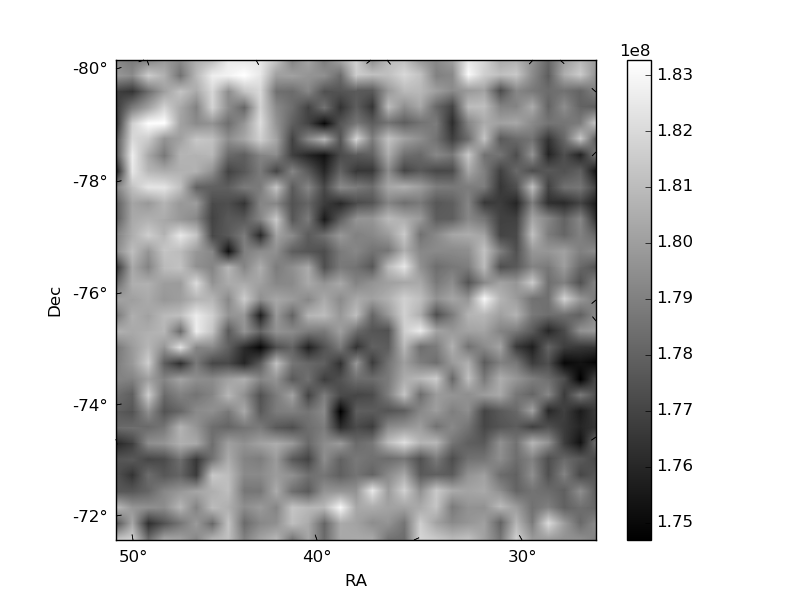
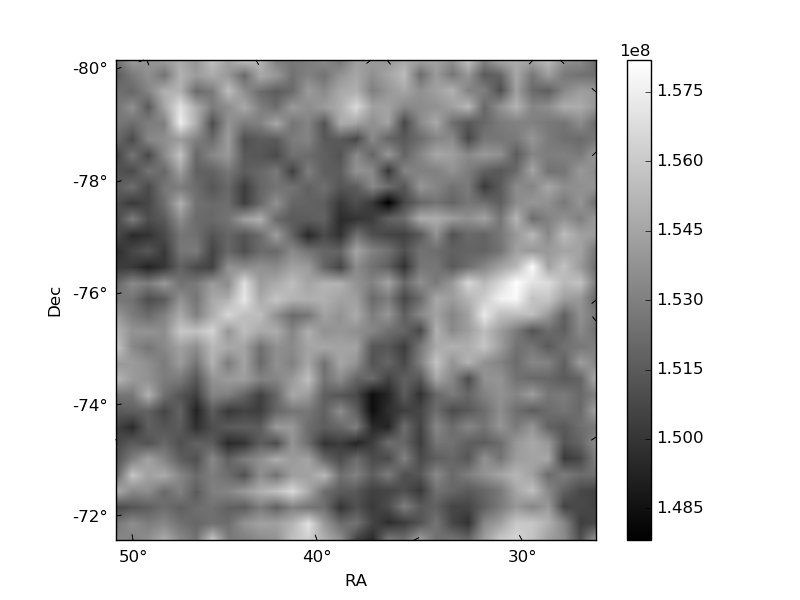
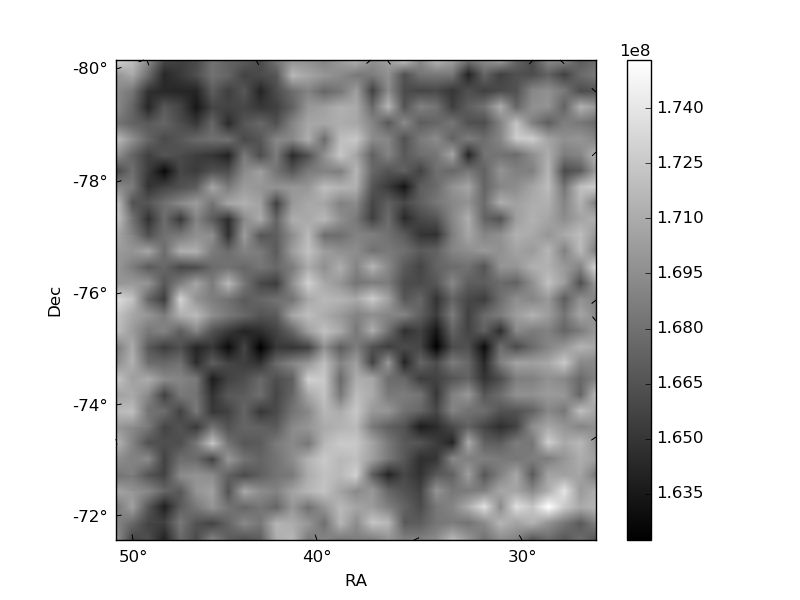
Histogram calculated using DETX and DETY for each event in the final _common_clean file
| Quadrant A | 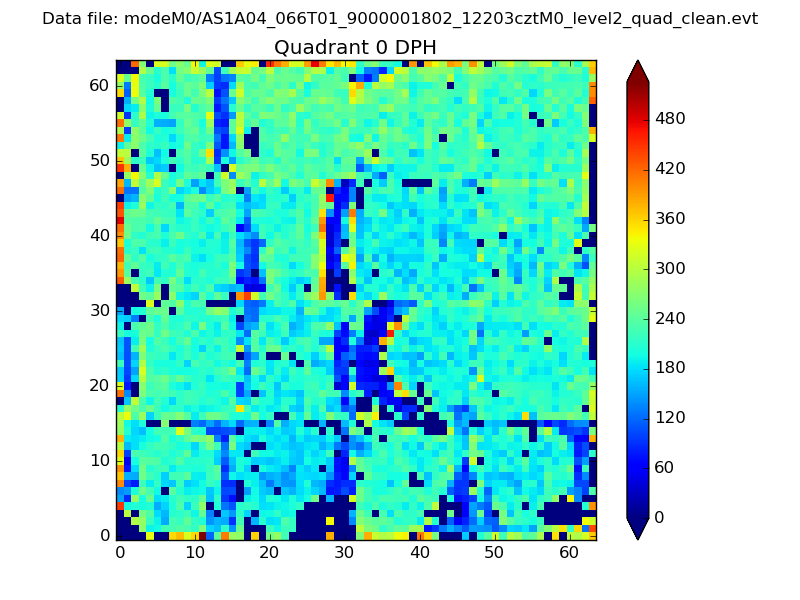 |
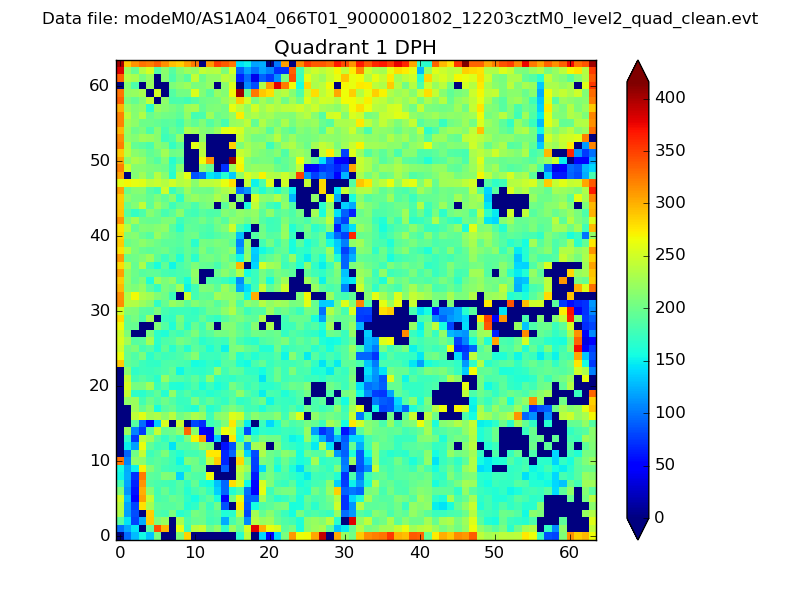 |
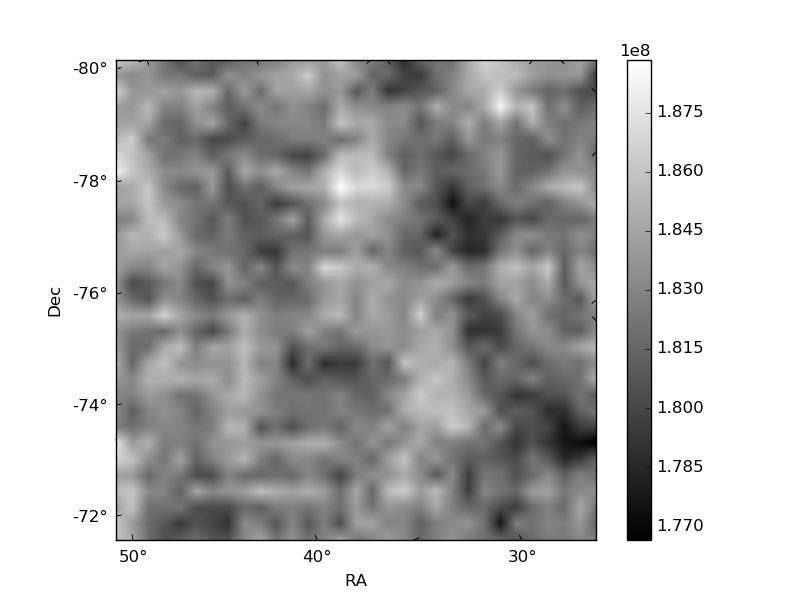
Quadrant B |
|---|---|---|---|
| Quadrant D | 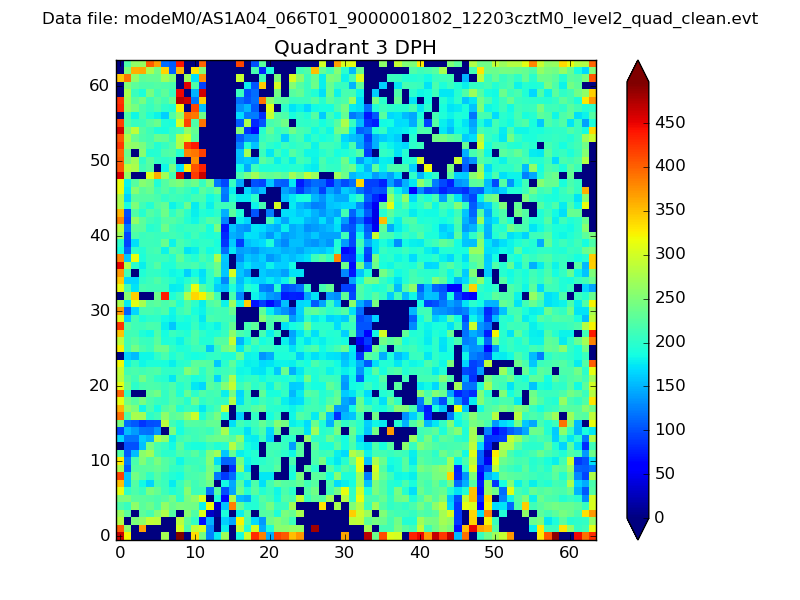 |
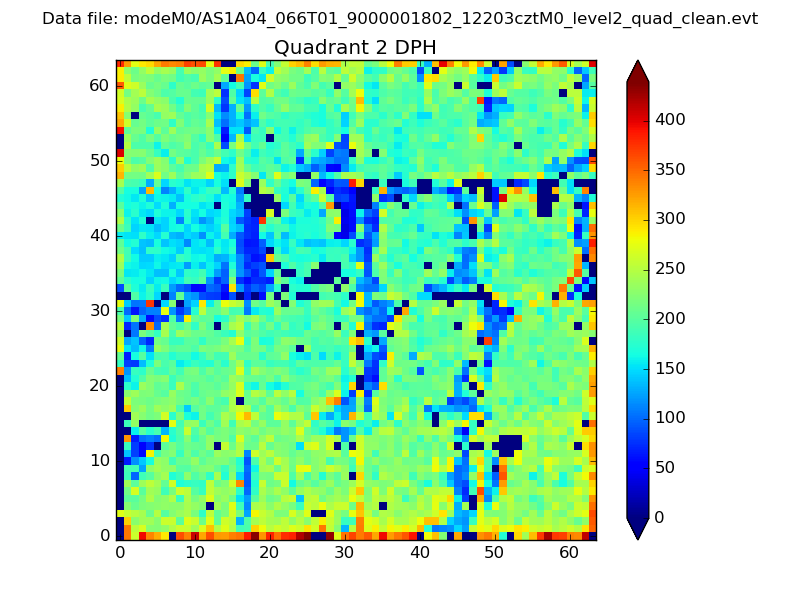 |
Quadrant C |
| Plot type | Count rate plots | Images |
|---|---|---|
| Comparison with Poisson distribution Blue bars denote a histogram of data divided into 1 sec bins. Red curve is a Poisson curve with rate = median count rate of data. |
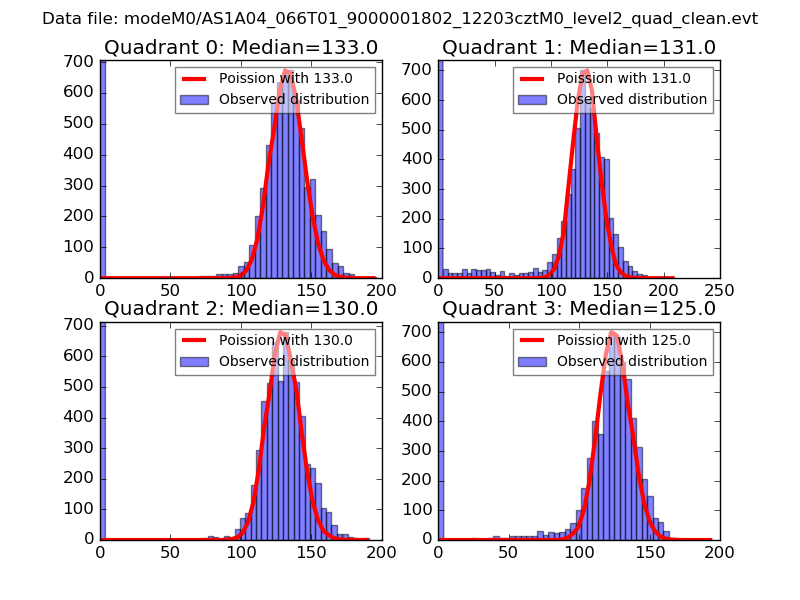 |
 |
| Quadrant-wise count rates Data is divided into 100 sec bins |
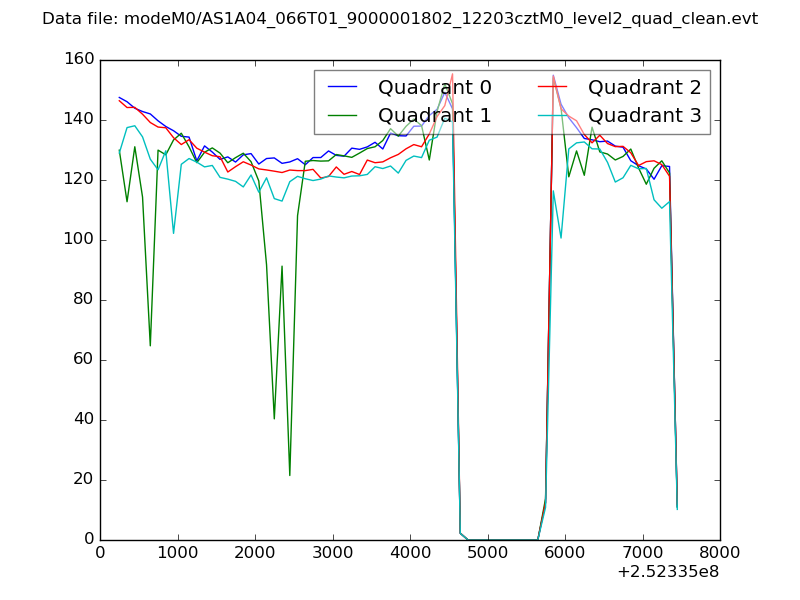 |
|
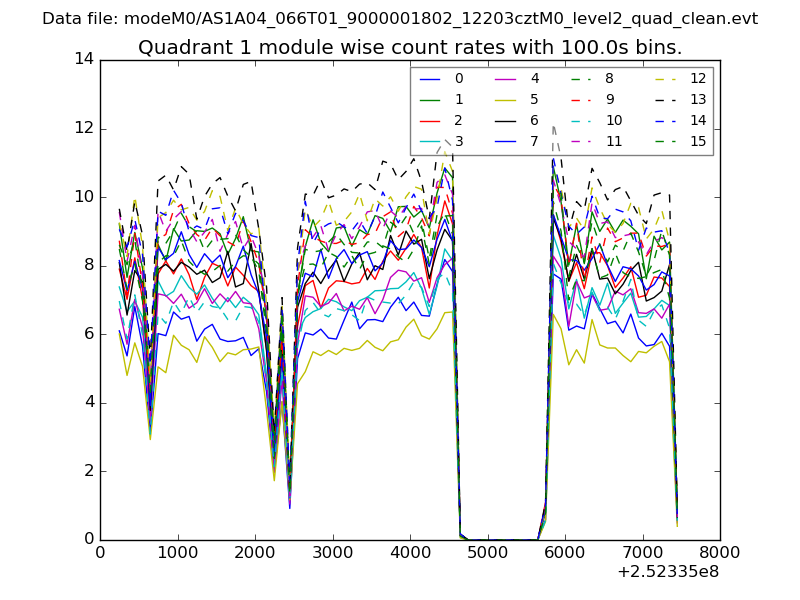
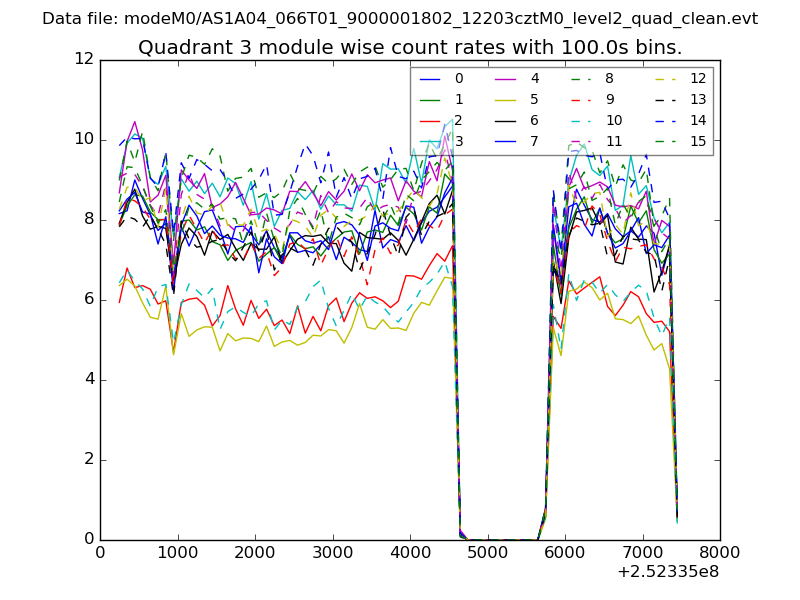
| Module-wise count rates for Quadrant A Data is divided into 100 sec bins |
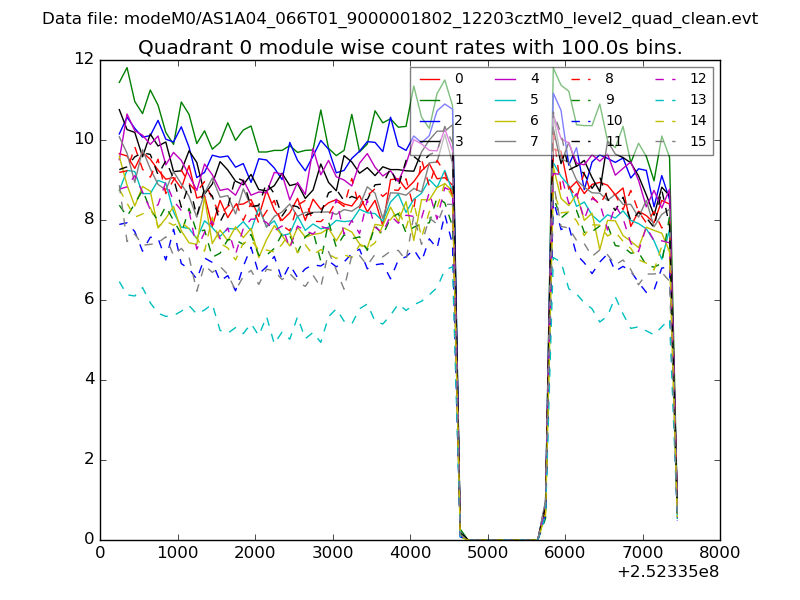 |
 |
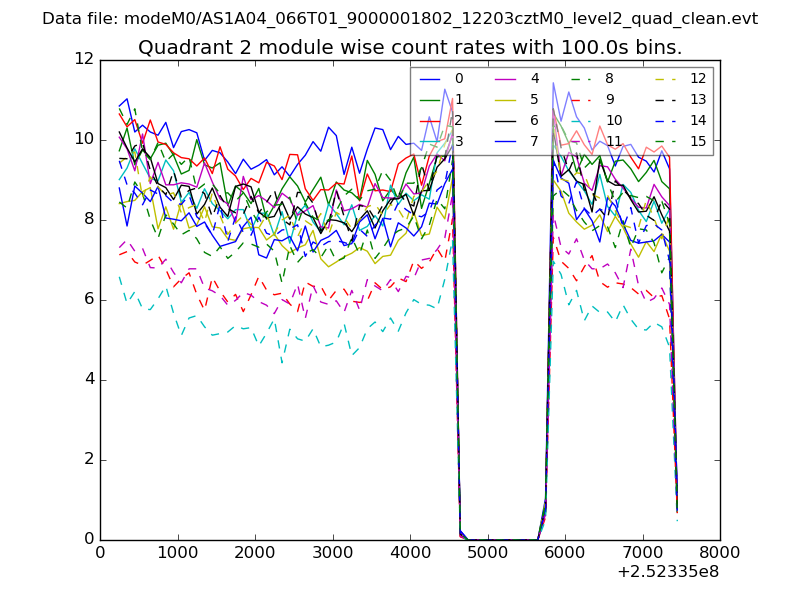
| Module-wise count rates for Quadrant B Data is divided into 100 sec bins |
 |
 |
| Module-wise count rates for Quadrant C Data is divided into 100 sec bins |
 |
 |
| Module-wise count rates for Quadrant D Data is divided into 100 sec bins |
 |
 |
| Parameter | Plot |
|---|---|
| CZT HV Monitor | 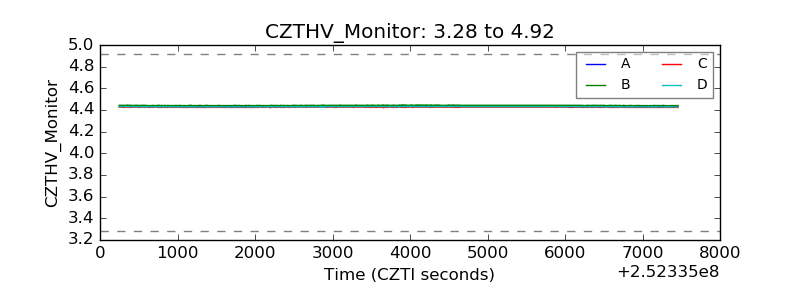 |
| D_VDD | 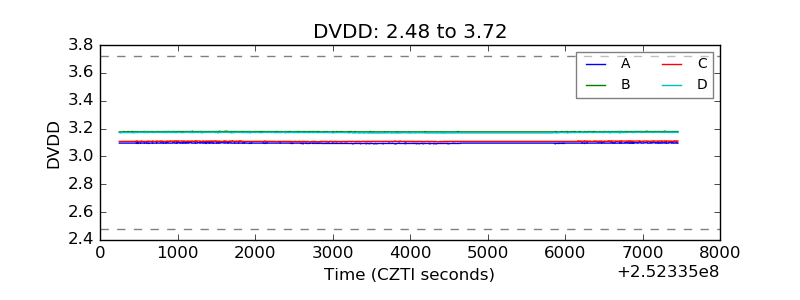 |
| Temperature 1 | 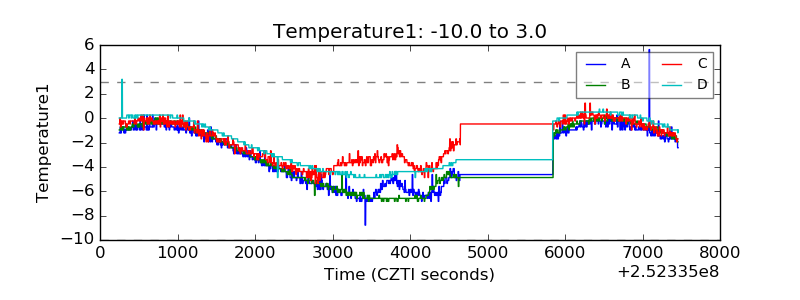 |
| Veto HV Monitor | 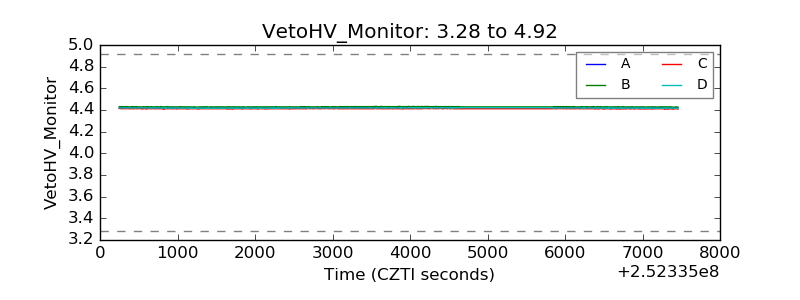 |
| Veto LLD | 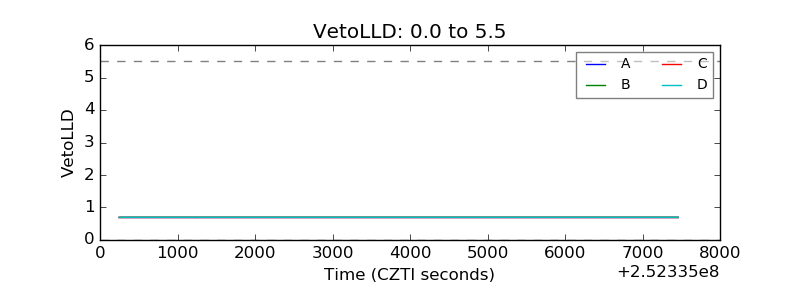 |
| Alpha Counter | 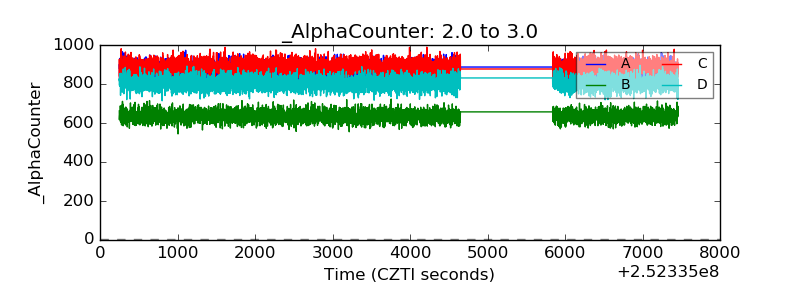 |
| _CPM_Rate | 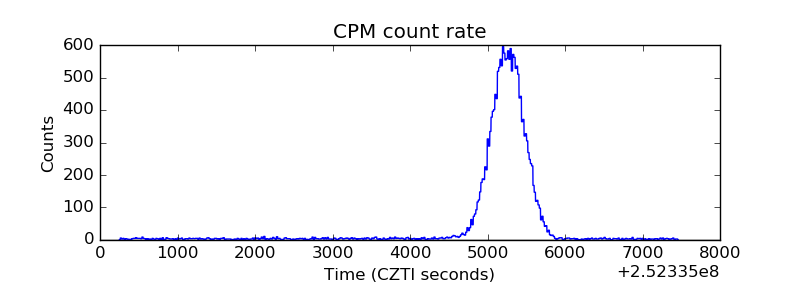 |
| CZT Counter | 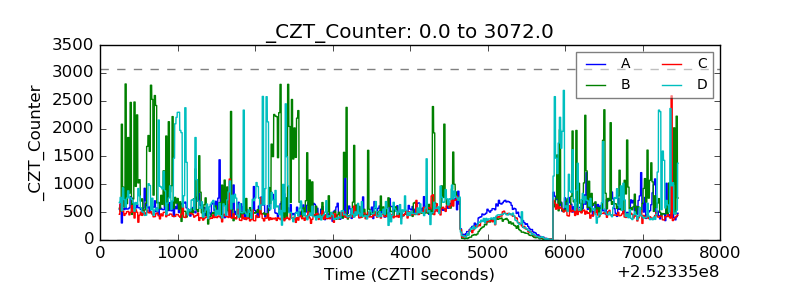 |
| +2.5 Volts monitor |  |
| +5 Volts monitor | 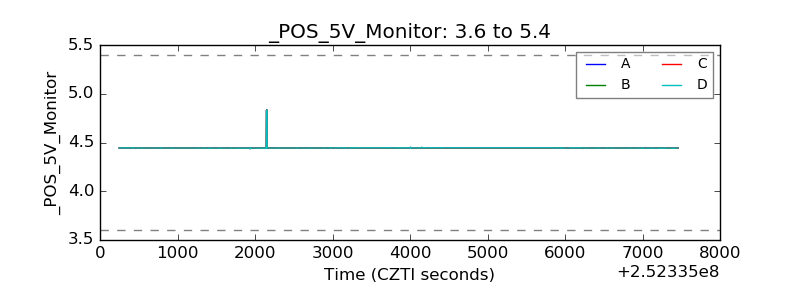 |
| _ROLL_ROT | 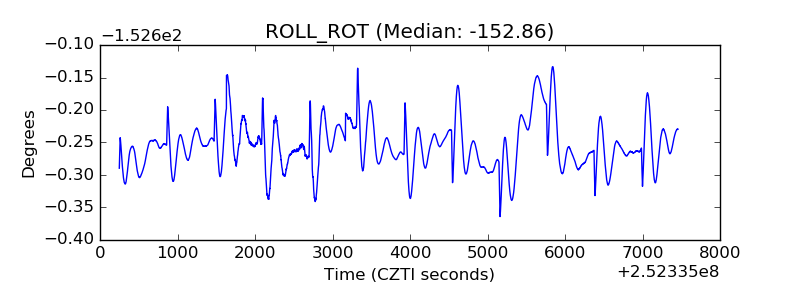 |
| _Roll_DEC | 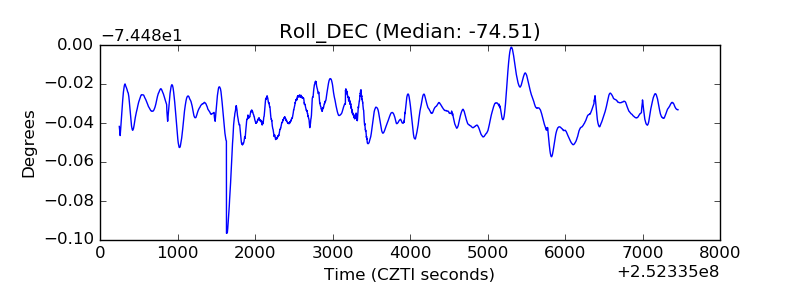 |
| _Roll_RA | 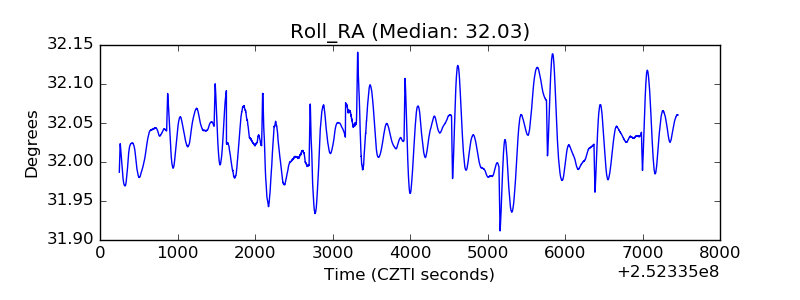 |
| Veto Counter | 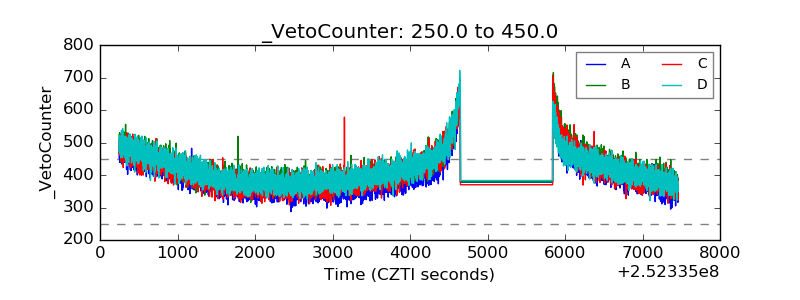 |