| Param | Original file | Final file |
|---|---|---|
| Filename | modeM0/AS1A04_066T01_9000001802_12204cztM0_level2.evt | modeM0/AS1A04_066T01_9000001802_12204cztM0_level2_quad_clean.evt |
| Size (bytes) | 572,688,000 | 123,356,160 |
| Size | 546.2 MB | 117.6 MB |
| Events in quadrant A | 3,813,354 | 848,282 |
| Events in quadrant B | 5,531,116 | 790,784 |
| Events in quadrant C | 3,432,006 | 829,077 |
| Events in quadrant D | 4,113,930 | 801,260 |
| Mode SS | |||
|---|---|---|---|
| Quadrant | BADHDUFLAG | Total packets | Discarded packets |
| A | 0 | 134 | 0 |
| B | 0 | 134 | 0 |
| C | 0 | 134 | 0 |
| D | 0 | 134 | 0 |
| Mode M0 | |||
|---|---|---|---|
| Quadrant | BADHDUFLAG | Total packets | Discarded packets |
| A | 0 | 15907 | 2 |
| B | 0 | 20940 | 1 |
| C | 0 | 14952 | 1 |
| D | 0 | 16810 | 1 |
| Mode M9 | |||
|---|---|---|---|
| Quadrant | BADHDUFLAG | Total packets | Discarded packets |
| A | 0 | 9 | 0 |
| B | 0 | 9 | 0 |
| C | 0 | 9 | 0 |
| D | 0 | 9 | 0 |
| Quadrant | Total seconds | Saturated seconds | Saturation percentage |
|---|---|---|---|
| A | 6695 | 140 | 2.091113% |
| B | 6695 | 814 | 12.158327% |
| C | 6695 | 143 | 2.135922% |
| D | 6695 | 206 | 3.076923% |
Noise dominated data is calculated using 1-second bins in cleaned event files. If a bin has >2000 counts, and if more than 50% of those come from <1% of pixels, then it is considered to be noise-dominated and hence unusable.
| Quadrant | # 1 sec bins | Bins with >0 counts | Bins with >2000 counts | High rate bins dominated by noise | Noise dominated (total time) | Noise dominated (detector-on time) | Marked lightcurve |
|---|---|---|---|---|---|---|---|
| A | 7551 | 6697 | 8 | 8 | 0.11% | 0.12% |  |
| B | 7551 | 6697 | 441 | 441 | 5.84% | 6.59% | 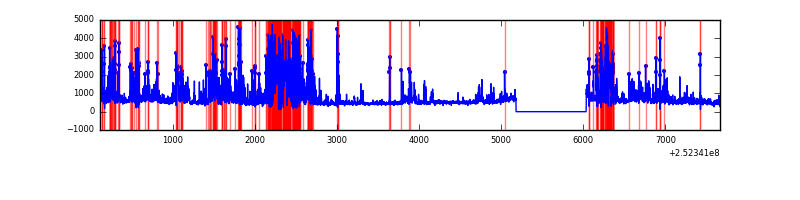 |
| C | 7551 | 6697 | 109 | 109 | 1.44% | 1.63% |  |
| D | 7551 | 6697 | 130 | 130 | 1.72% | 1.94% | 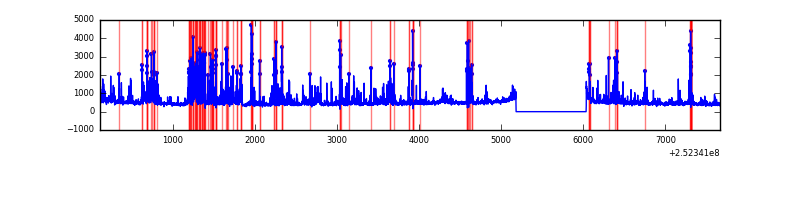 |
Top three noisy pixels from each quadrant. If the there are fewer than three noisy pixels in the level2.evt file, extra rows are filled as -1
| Pixel properties | Quadrant properties | ||||||
|---|---|---|---|---|---|---|---|
| Quadrant | DetID | PixID | Counts | Sigma | Mean | Median | Sigma |
| A | 1 | 162 | 256438 | 1638.91 | 777 | 761 | 156.0 |
| A | 1 | 178 | 148180 | 944.97 | 777 | 761 | 156.0 |
| A | 1 | 161 | 127051 | 809.53 | 777 | 761 | 156.0 |
| B | 4 | 239 | 1610865 | 11732.19 | 731 | 713 | 137.2 |
| B | 3 | 64 | 354592 | 2578.5 | 731 | 713 | 137.2 |
| B | 15 | 204 | 213019 | 1546.94 | 731 | 713 | 137.2 |
| C | 15 | 208 | 462529 | 2708.59 | 739 | 740 | 170.5 |
| C | 5 | 112 | 59997 | 347.57 | 739 | 740 | 170.5 |
| C | 4 | 175 | 16545 | 92.7 | 739 | 740 | 170.5 |
| D | 13 | 104 | 415971 | 2330.88 | 740 | 717 | 178.2 |
| D | 4 | 95 | 214883 | 1202.15 | 740 | 717 | 178.2 |
| D | 13 | 249 | 153646 | 858.41 | 740 | 717 | 178.2 |
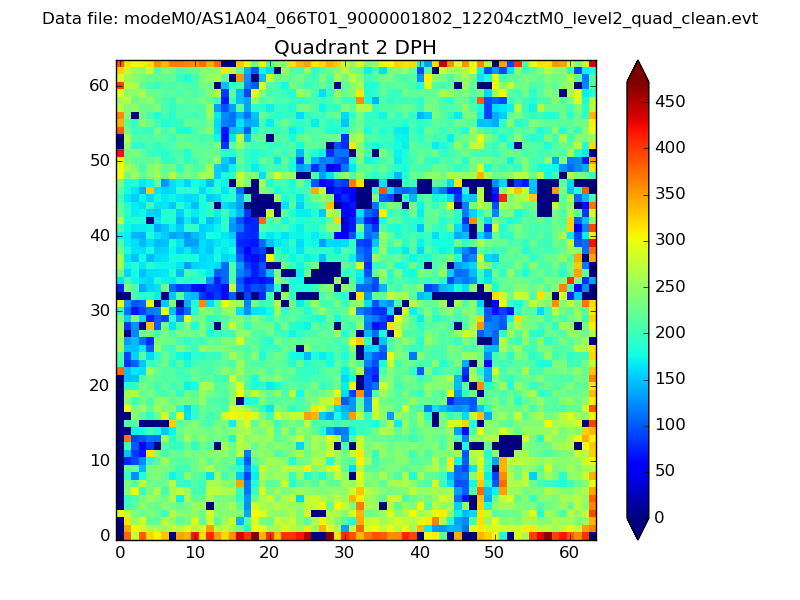
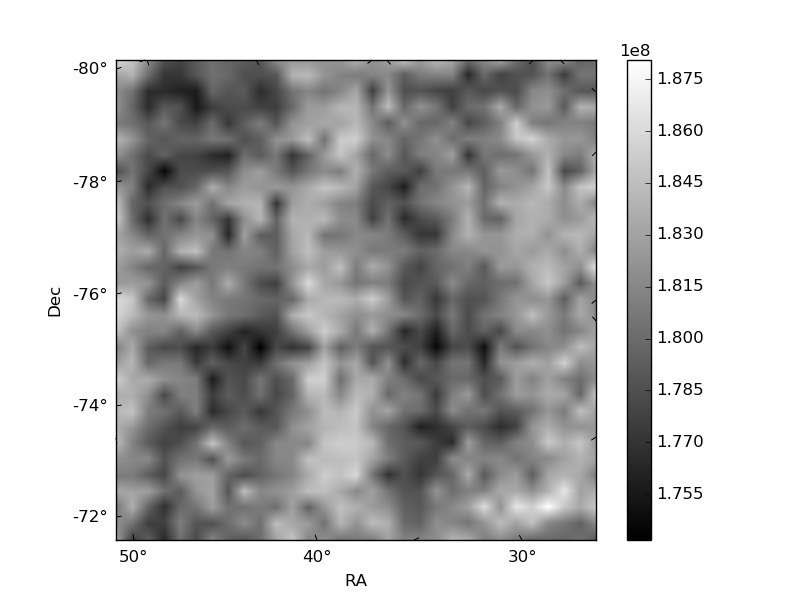
Histogram calculated using DETX and DETY for each event in the final _common_clean file
| Quadrant A | 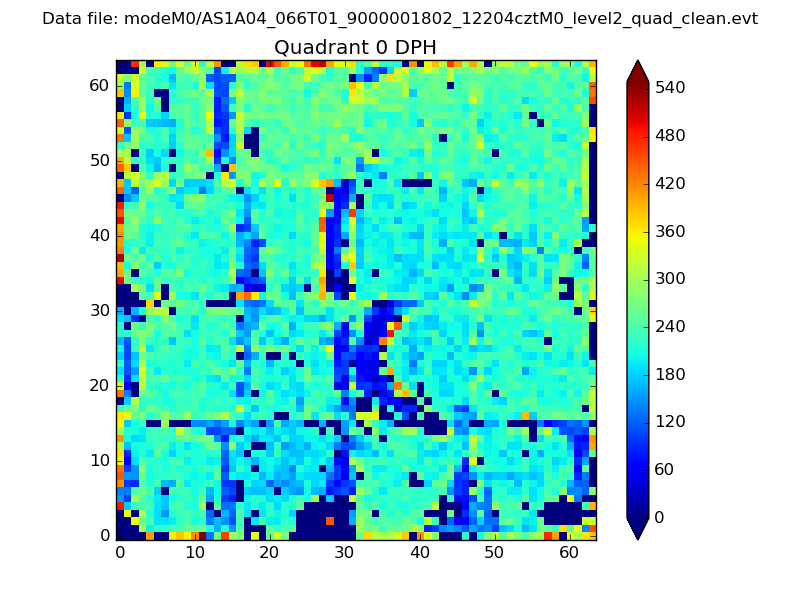 |
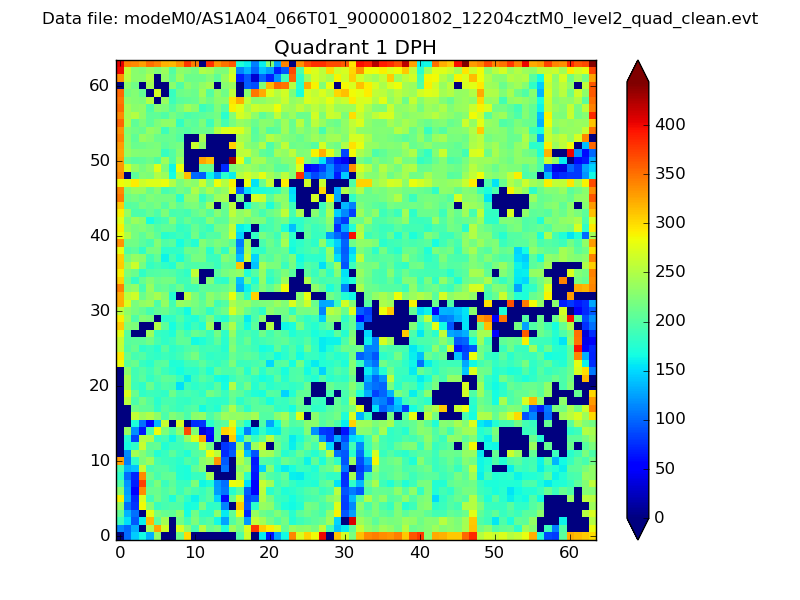 |
Quadrant B |
|---|---|---|---|
| Quadrant D | 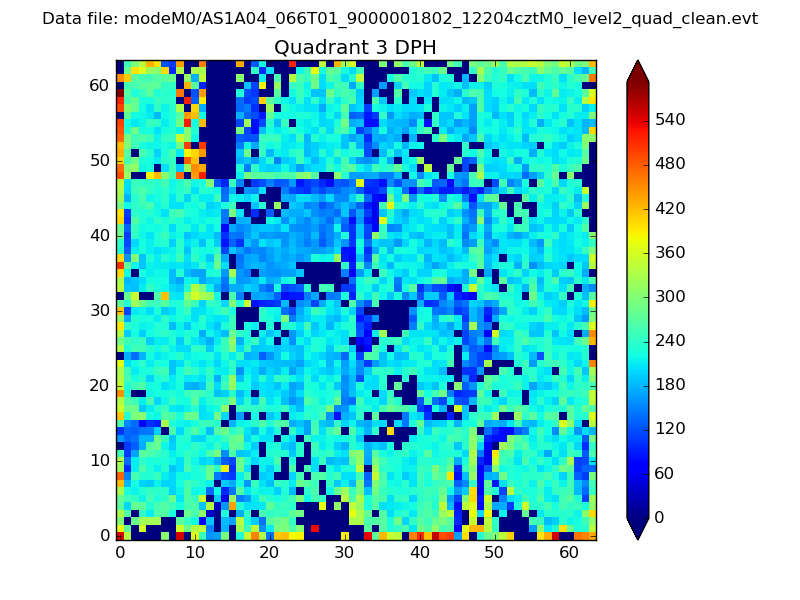 |
 |
Quadrant C |
| Plot type | Count rate plots | Images |
|---|---|---|
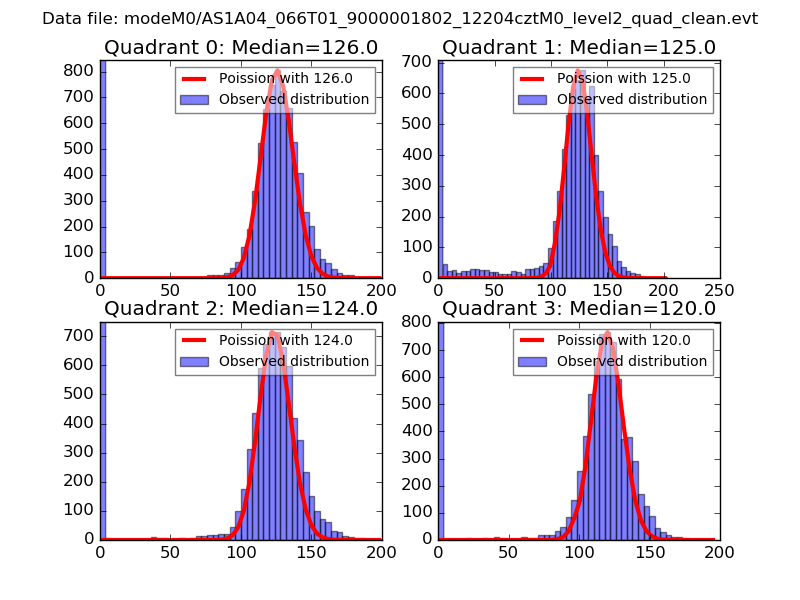
| Comparison with Poisson distribution Blue bars denote a histogram of data divided into 1 sec bins. Red curve is a Poisson curve with rate = median count rate of data. |
 |
 |
| Quadrant-wise count rates Data is divided into 100 sec bins |
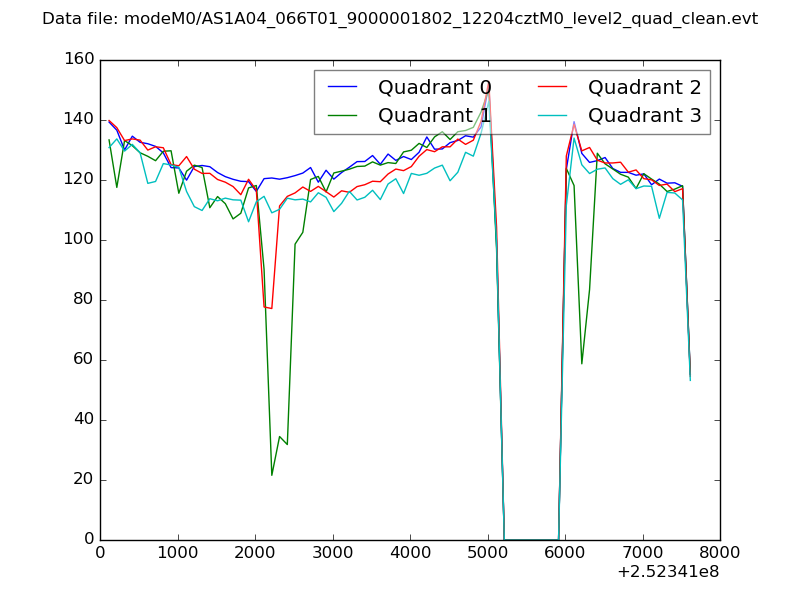 |
|
| Module-wise count rates for Quadrant A Data is divided into 100 sec bins |
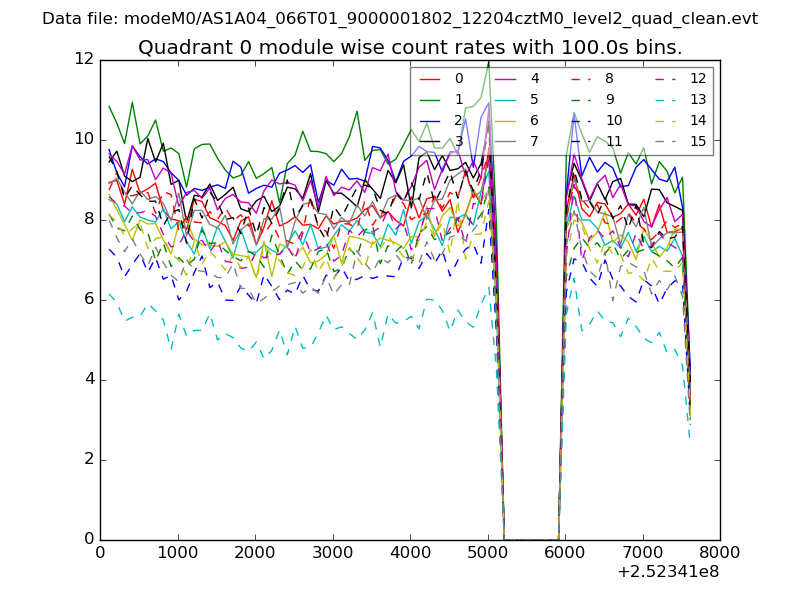 |
 |
| Module-wise count rates for Quadrant B Data is divided into 100 sec bins |
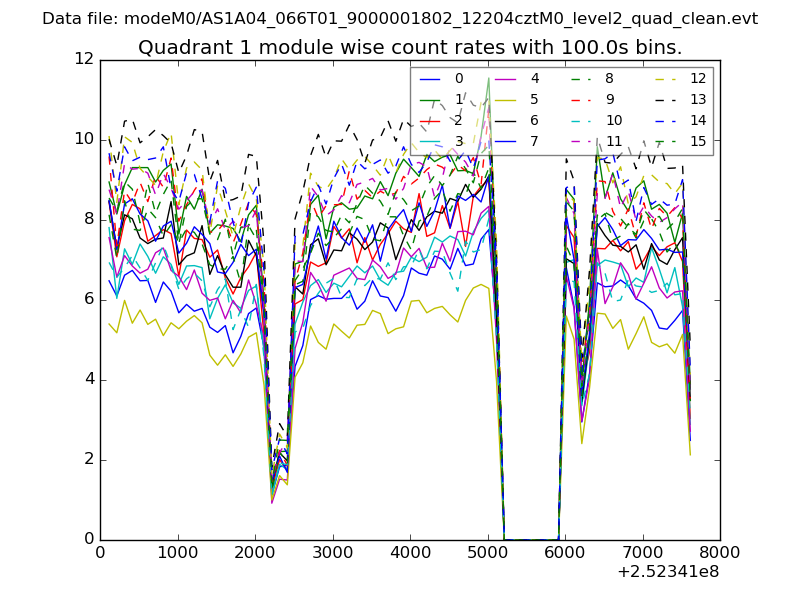 |
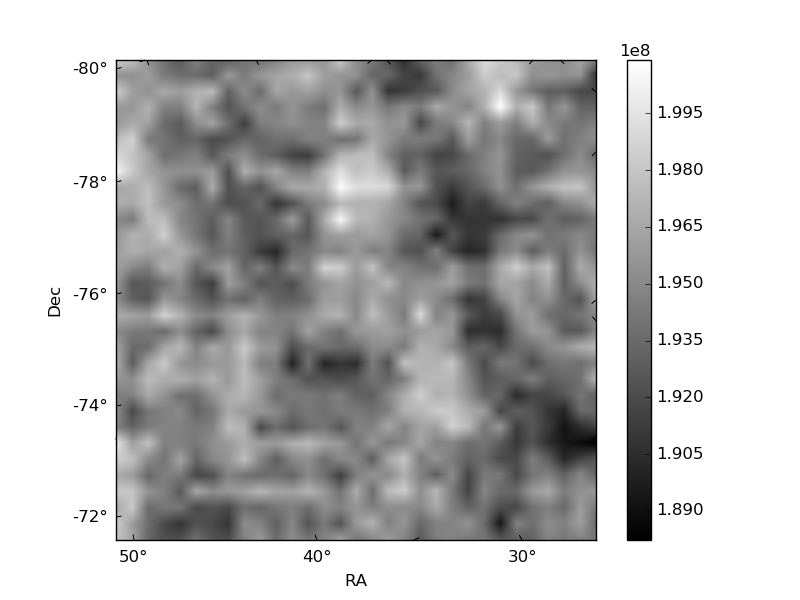 |
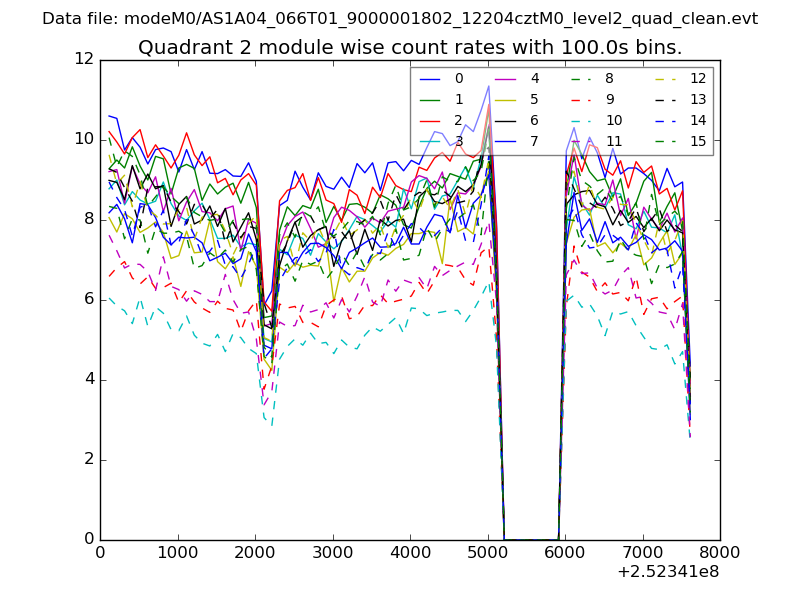
| Module-wise count rates for Quadrant C Data is divided into 100 sec bins |
 |
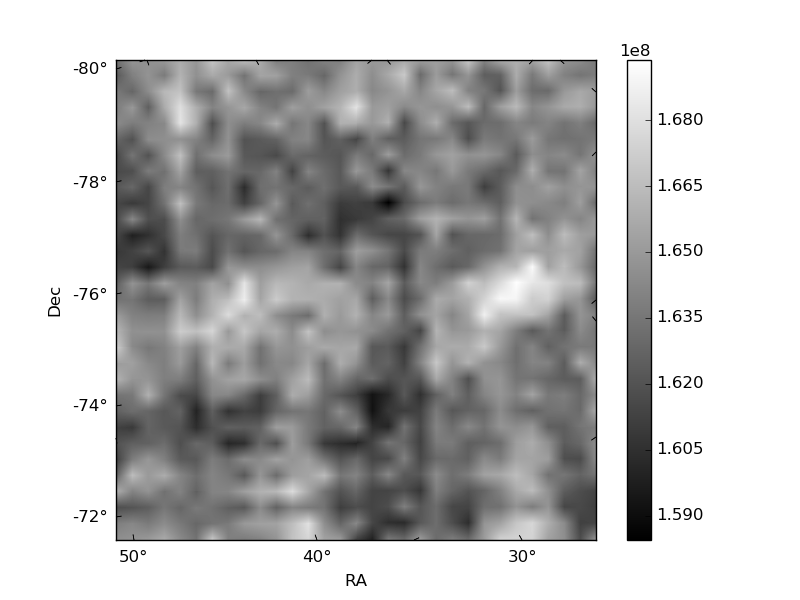 |
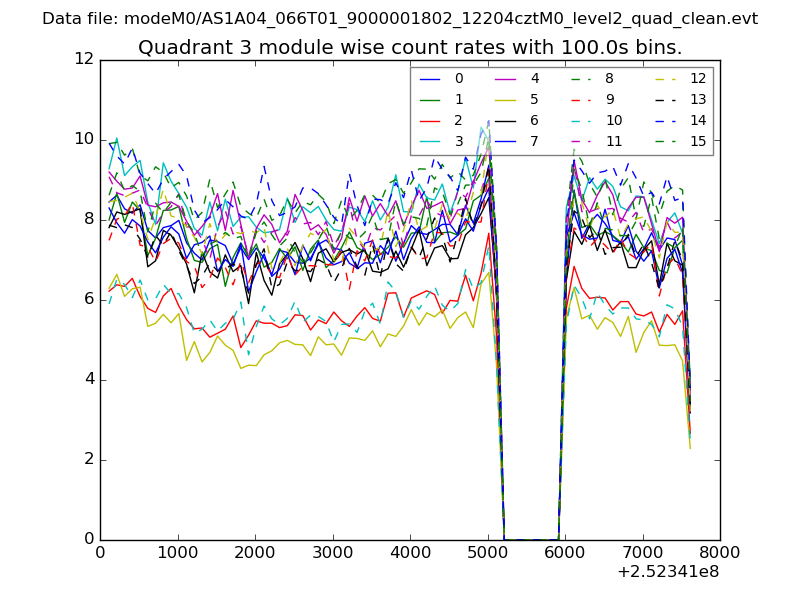
| Module-wise count rates for Quadrant D Data is divided into 100 sec bins |
 |
 |
| Parameter | Plot |
|---|---|
| CZT HV Monitor | 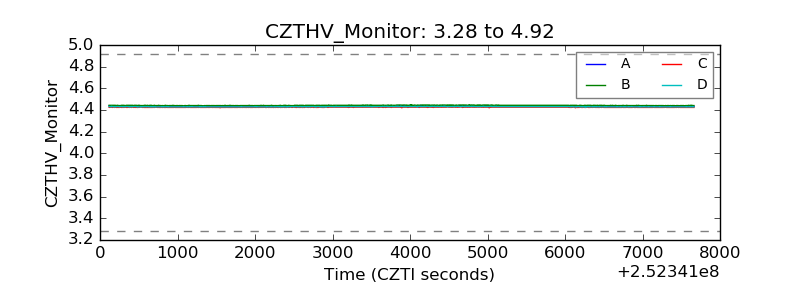 |
| D_VDD | 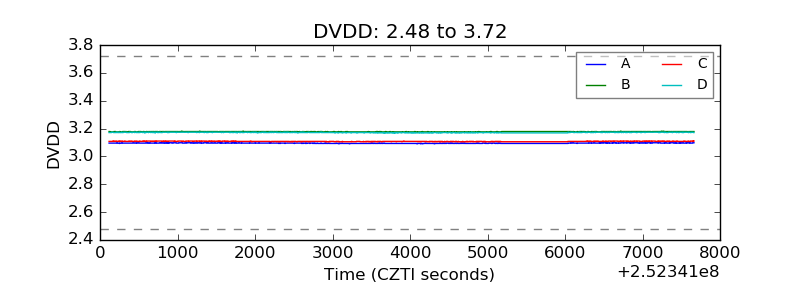 |
| Temperature 1 | 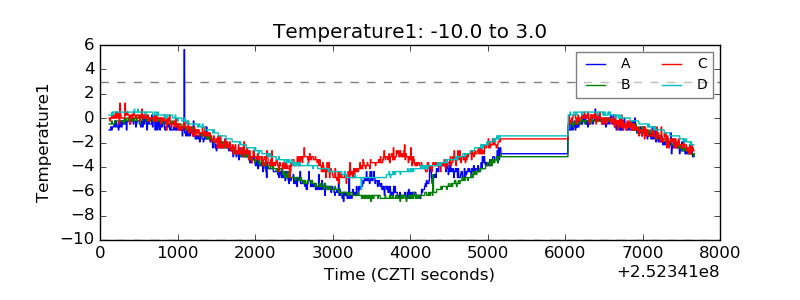 |
| Veto HV Monitor | 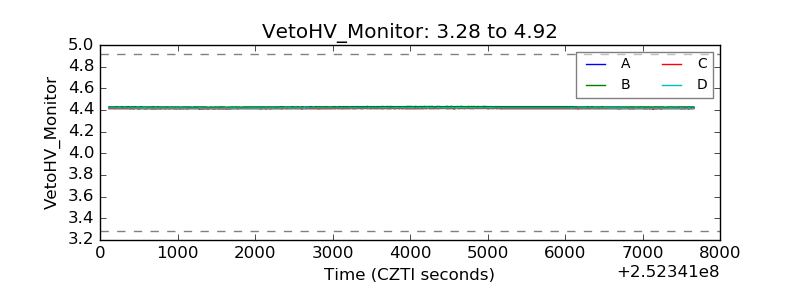 |
| Veto LLD | 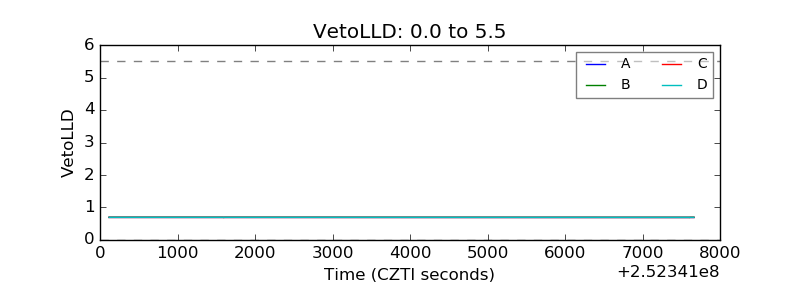 |
| Alpha Counter | 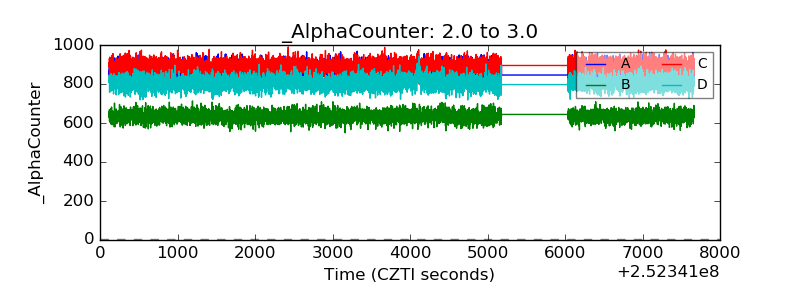 |
| _CPM_Rate | 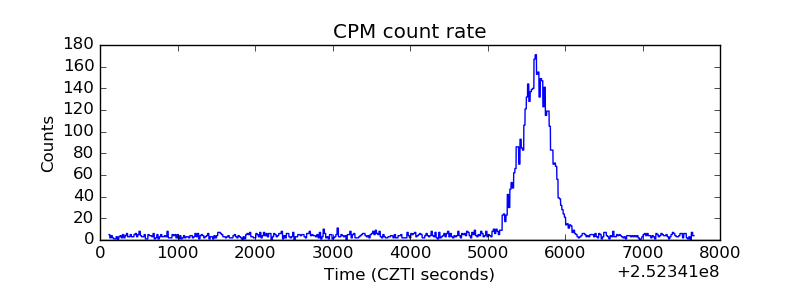 |
| CZT Counter | 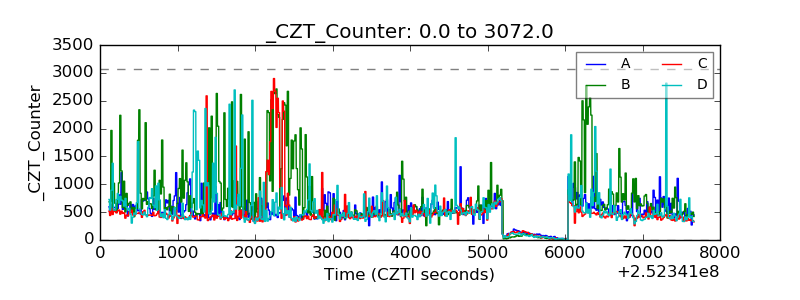 |
| +2.5 Volts monitor |  |
| +5 Volts monitor |  |
| _ROLL_ROT | 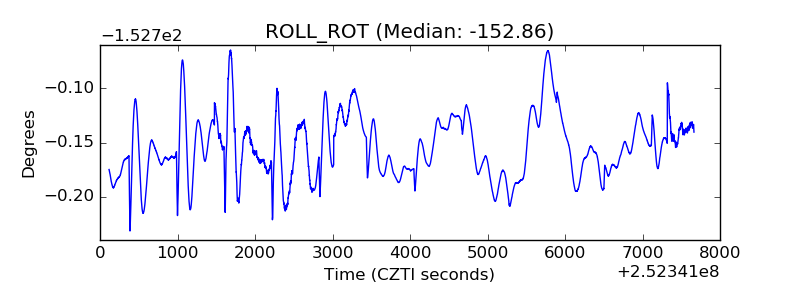 |
| _Roll_DEC | 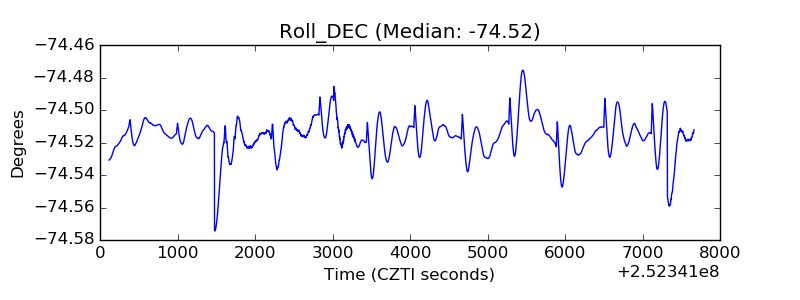 |
| _Roll_RA | 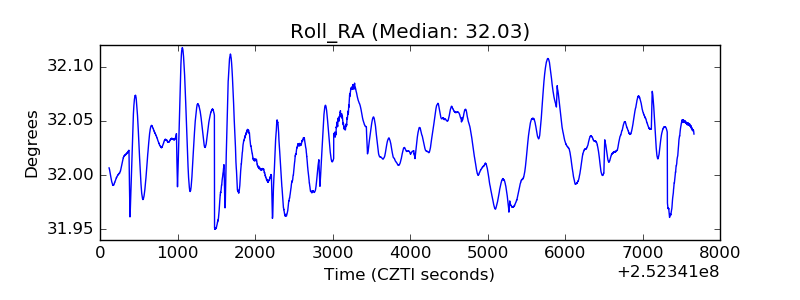 |
| Veto Counter | 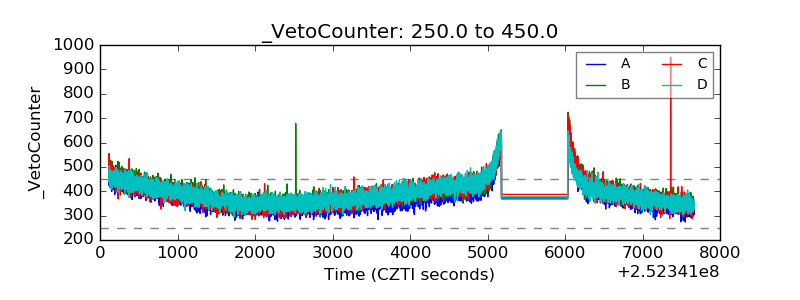 |