| Param | Original file | Final file |
|---|---|---|
| Filename | modeM0/AS1A04_066T01_9000001802_12206cztM0_level2.evt | modeM0/AS1A04_066T01_9000001802_12206cztM0_level2_quad_clean.evt |
| Size (bytes) | 602,766,720 | 132,848,640 |
| Size | 574.8 MB | 126.7 MB |
| Events in quadrant A | 4,494,846 | 896,516 |
| Events in quadrant B | 5,693,977 | 852,438 |
| Events in quadrant C | 3,518,258 | 893,537 |
| Events in quadrant D | 4,039,282 | 859,127 |
| Mode SS | |||
|---|---|---|---|
| Quadrant | BADHDUFLAG | Total packets | Discarded packets |
| A | 0 | 152 | 0 |
| B | 0 | 152 | 0 |
| C | 0 | 152 | 0 |
| D | 0 | 152 | 0 |
| Mode M0 | |||
|---|---|---|---|
| Quadrant | BADHDUFLAG | Total packets | Discarded packets |
| A | 0 | 18558 | 2 |
| B | 0 | 21925 | 1 |
| C | 0 | 15875 | 1 |
| D | 0 | 17464 | 1 |
| Mode M9 | |||
|---|---|---|---|
| Quadrant | BADHDUFLAG | Total packets | Discarded packets |
| A | 0 | 1 | 0 |
| B | 0 | 1 | 0 |
| C | 0 | 1 | 0 |
| D | 0 | 1 | 0 |
| Quadrant | Total seconds | Saturated seconds | Saturation percentage |
|---|---|---|---|
| A | 7498 | 283 | 3.774340% |
| B | 7498 | 830 | 11.069619% |
| C | 7498 | 71 | 0.946919% |
| D | 7498 | 145 | 1.933849% |
Noise dominated data is calculated using 1-second bins in cleaned event files. If a bin has >2000 counts, and if more than 50% of those come from <1% of pixels, then it is considered to be noise-dominated and hence unusable.
| Quadrant | # 1 sec bins | Bins with >0 counts | Bins with >2000 counts | High rate bins dominated by noise | Noise dominated (total time) | Noise dominated (detector-on time) | Marked lightcurve |
|---|---|---|---|---|---|---|---|
| A | 7634 | 7500 | 25 | 25 | 0.33% | 0.33% | 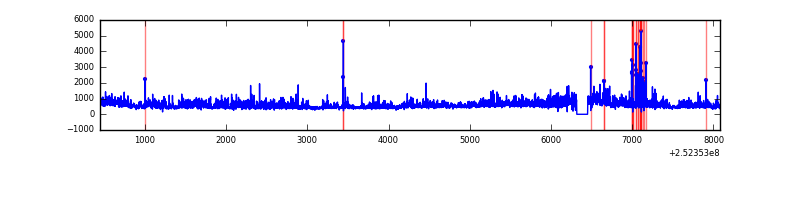 |
| B | 7633 | 7499 | 412 | 412 | 5.40% | 5.49% | 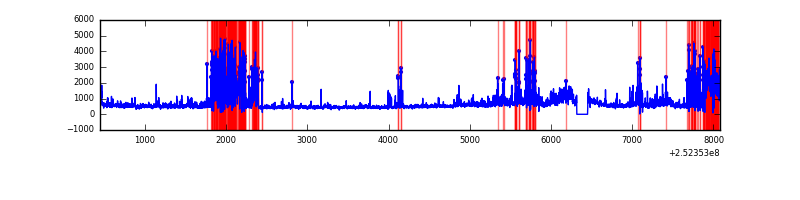 |
| C | 7634 | 7500 | 33 | 33 | 0.43% | 0.44% | 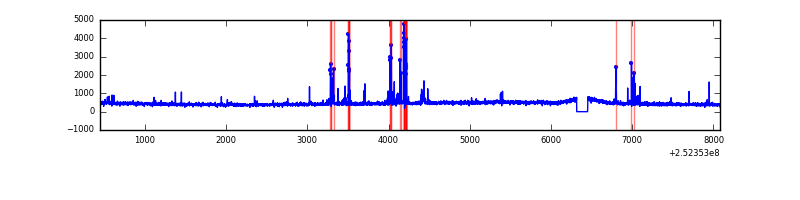 |
| D | 7634 | 7500 | 93 | 93 | 1.22% | 1.24% | 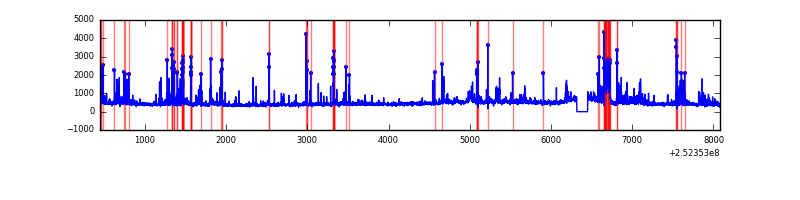 |
Top three noisy pixels from each quadrant. If the there are fewer than three noisy pixels in the level2.evt file, extra rows are filled as -1
| Pixel properties | Quadrant properties | ||||||
|---|---|---|---|---|---|---|---|
| Quadrant | DetID | PixID | Counts | Sigma | Mean | Median | Sigma |
| A | 1 | 162 | 333123 | 1930.06 | 851 | 832 | 172.2 |
| A | 1 | 178 | 201989 | 1168.39 | 851 | 832 | 172.2 |
| A | 1 | 161 | 171235 | 989.76 | 851 | 832 | 172.2 |
| B | 4 | 239 | 1649085 | 10662.4 | 814 | 793 | 154.6 |
| B | 15 | 204 | 420849 | 2717.24 | 814 | 793 | 154.6 |
| B | 10 | 16 | 128229 | 824.35 | 814 | 793 | 154.6 |
| C | 15 | 208 | 195520 | 1027.59 | 825 | 826 | 189.5 |
| C | 4 | 175 | 27962 | 143.22 | 825 | 826 | 189.5 |
| C | 0 | 207 | 27209 | 139.25 | 825 | 826 | 189.5 |
| D | 13 | 104 | 288268 | 1461.29 | 820 | 794 | 196.7 |
| D | 2 | 33 | 155135 | 784.55 | 820 | 794 | 196.7 |
| D | 12 | 221 | 114772 | 579.37 | 820 | 794 | 196.7 |
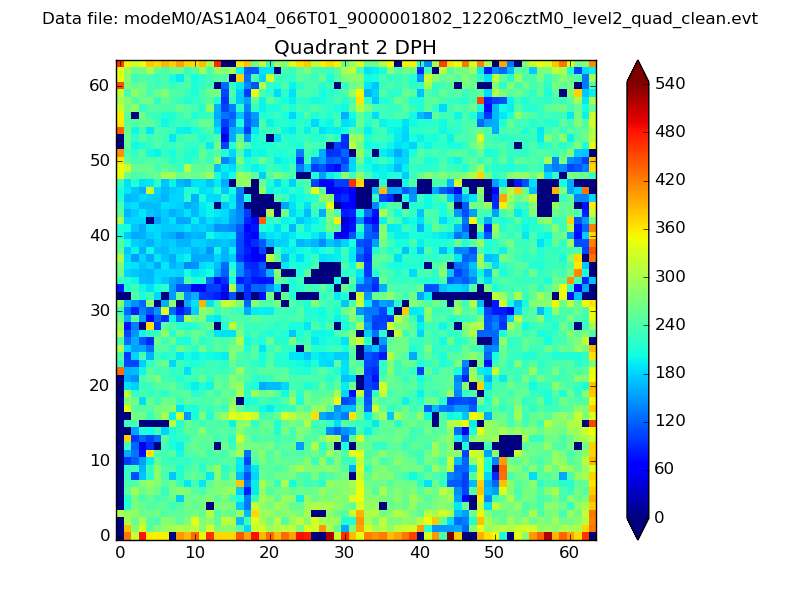
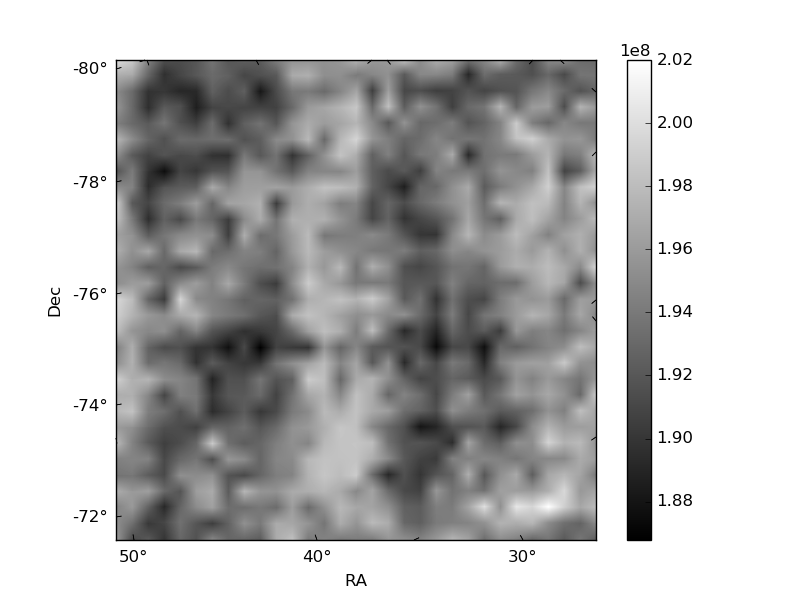
Histogram calculated using DETX and DETY for each event in the final _common_clean file
| Quadrant A | 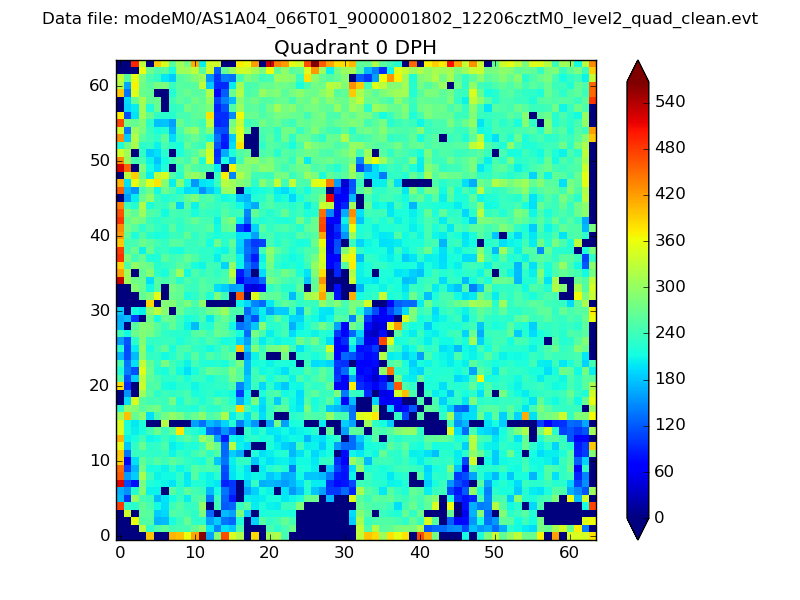 |
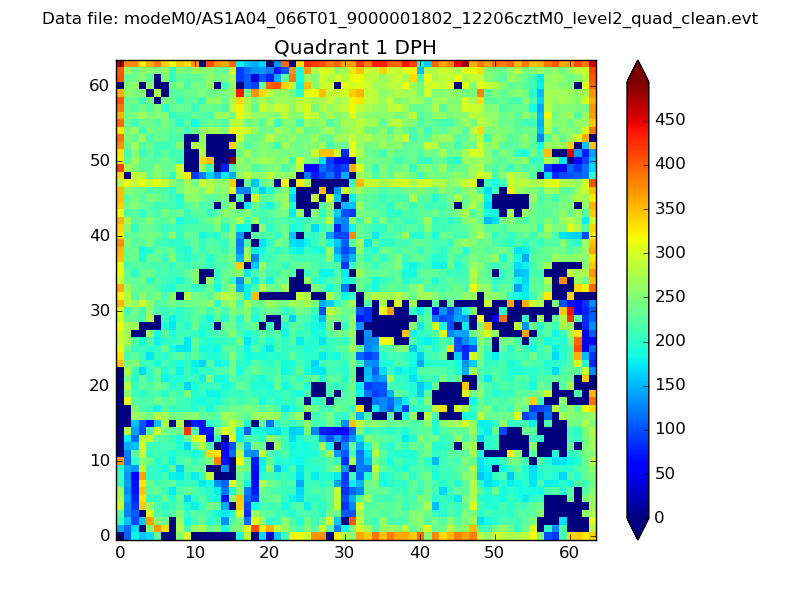 |
Quadrant B |
|---|---|---|---|
| Quadrant D | 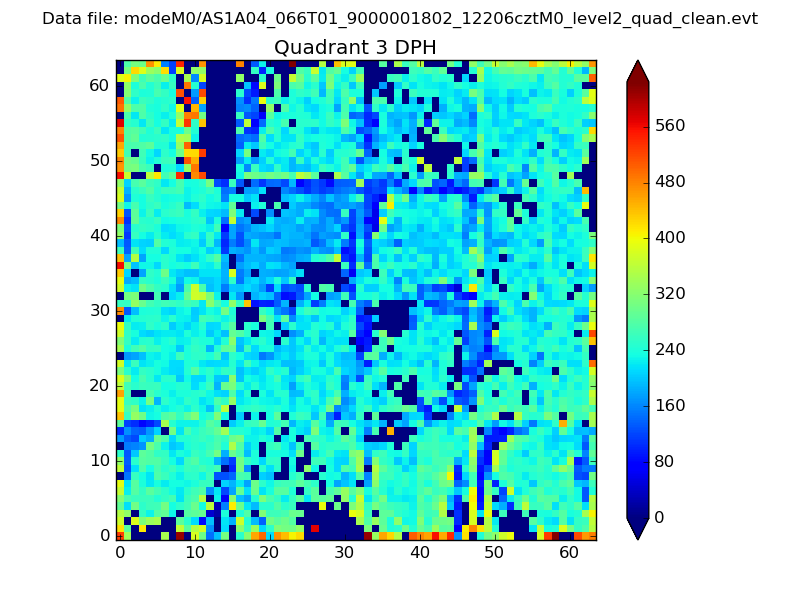 |
 |
Quadrant C |
| Plot type | Count rate plots | Images |
|---|---|---|
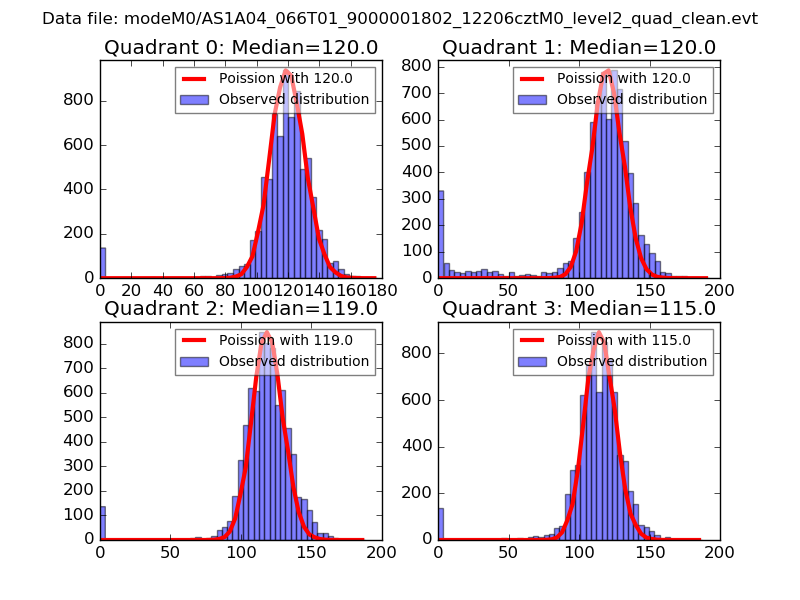
| Comparison with Poisson distribution Blue bars denote a histogram of data divided into 1 sec bins. Red curve is a Poisson curve with rate = median count rate of data. |
 |
 |
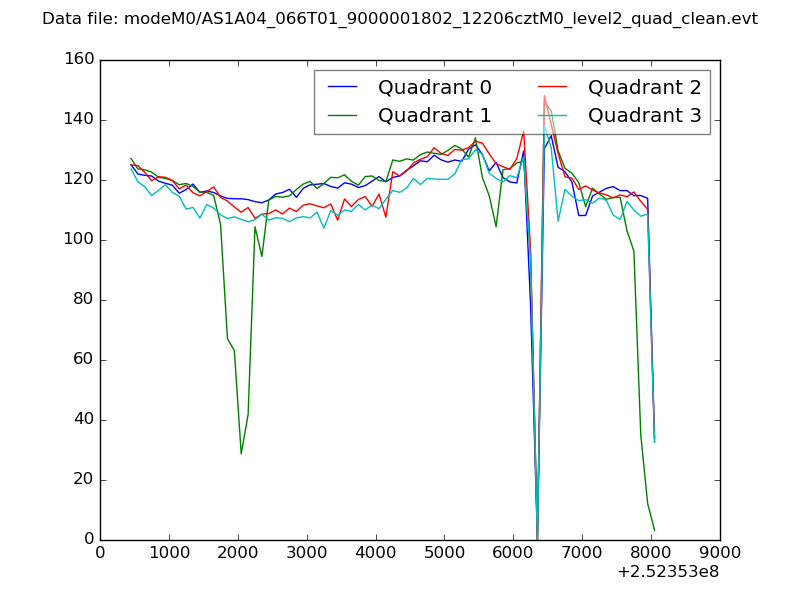
| Quadrant-wise count rates Data is divided into 100 sec bins |
 |
|
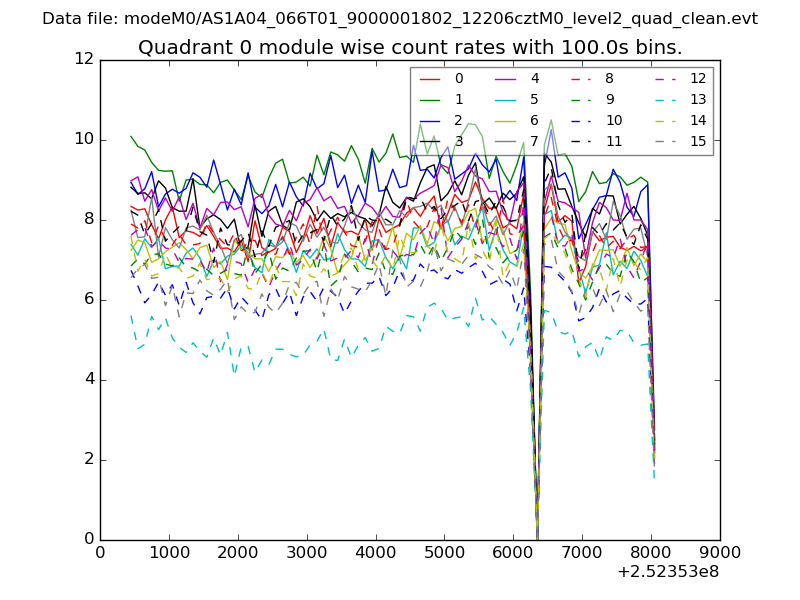
| Module-wise count rates for Quadrant A Data is divided into 100 sec bins |
 |
 |
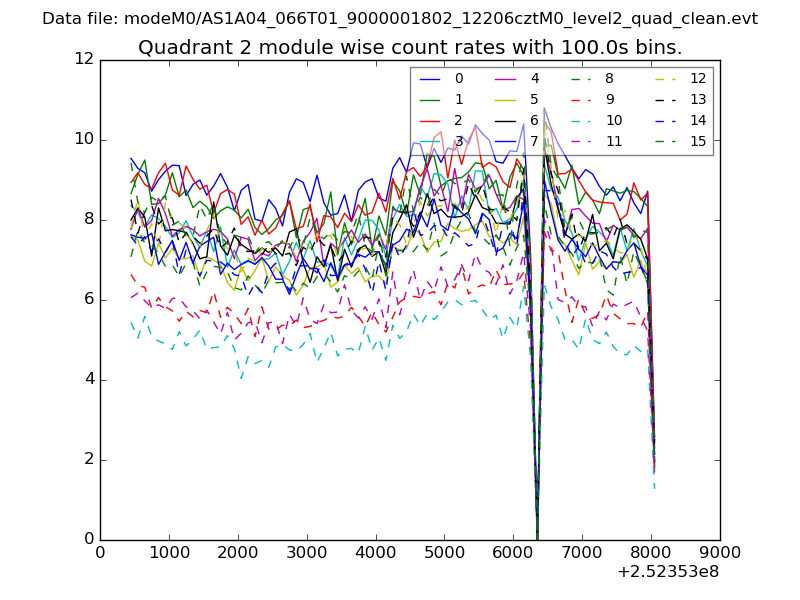
| Module-wise count rates for Quadrant B Data is divided into 100 sec bins |
 |
 |
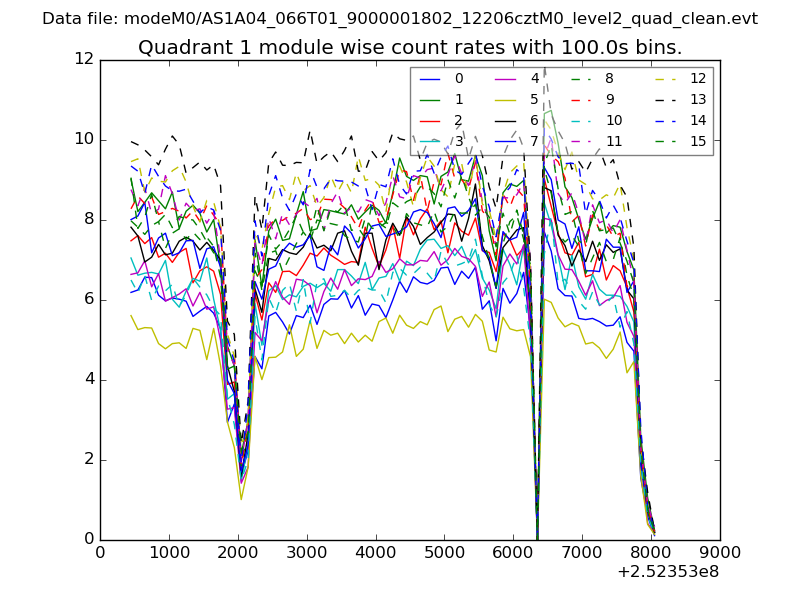
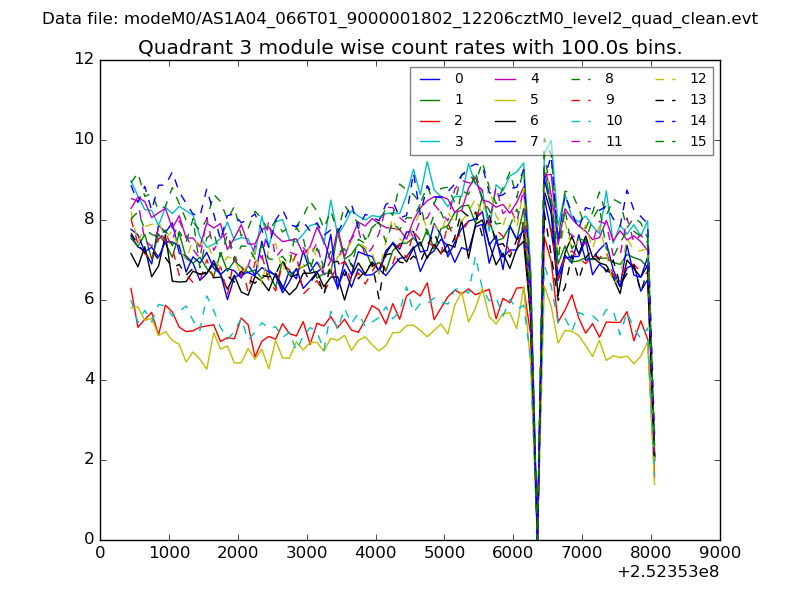
| Module-wise count rates for Quadrant C Data is divided into 100 sec bins |
 |
 |
| Module-wise count rates for Quadrant D Data is divided into 100 sec bins |
 |
 |
| Parameter | Plot |
|---|---|
| CZT HV Monitor | 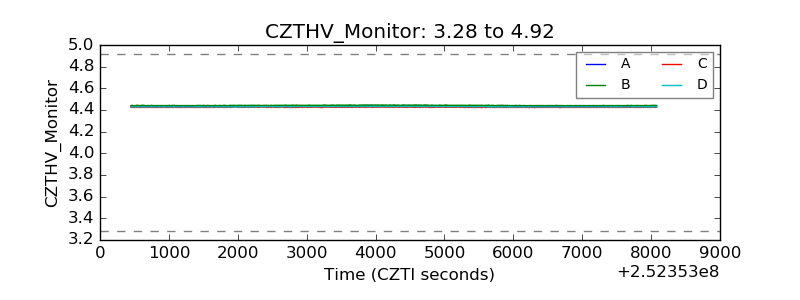 |
| D_VDD | 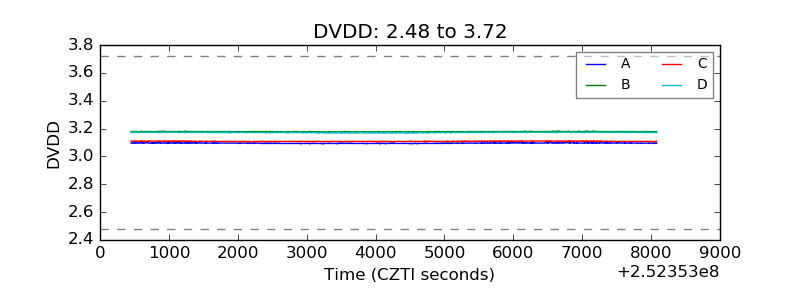 |
| Temperature 1 | 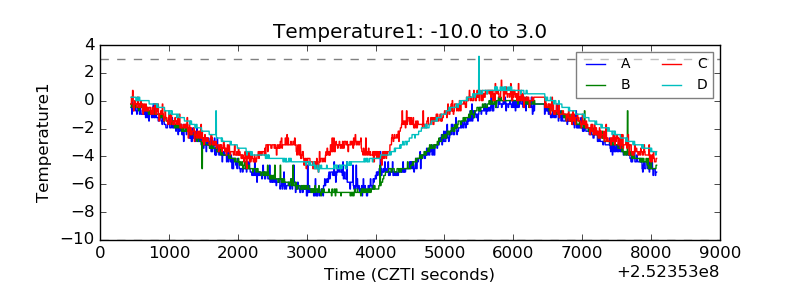 |
| Veto HV Monitor | 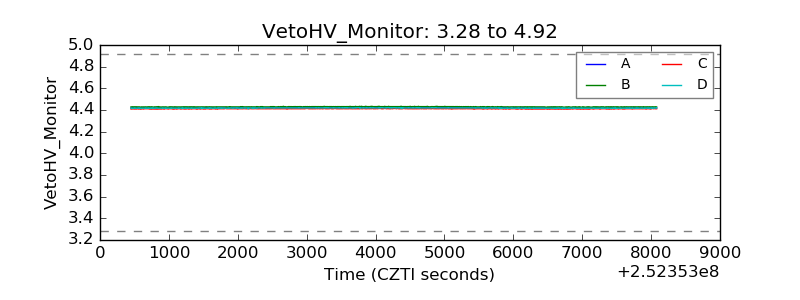 |
| Veto LLD | 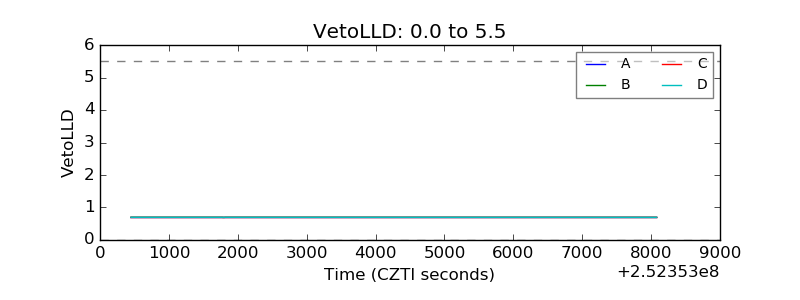 |
| Alpha Counter | 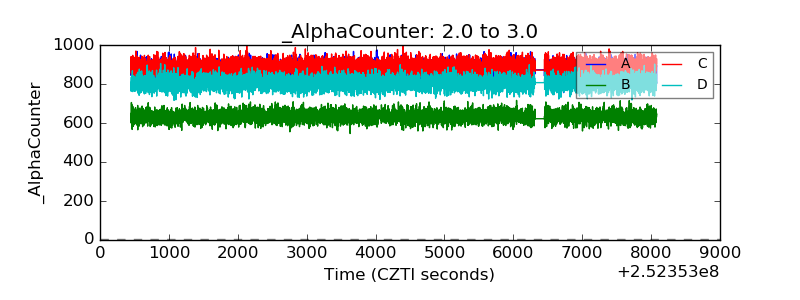 |
| _CPM_Rate | 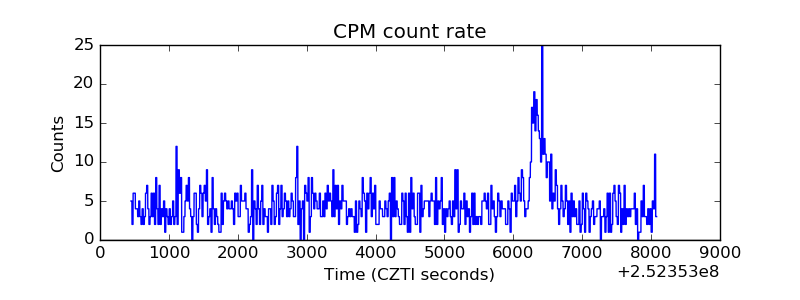 |
| CZT Counter | 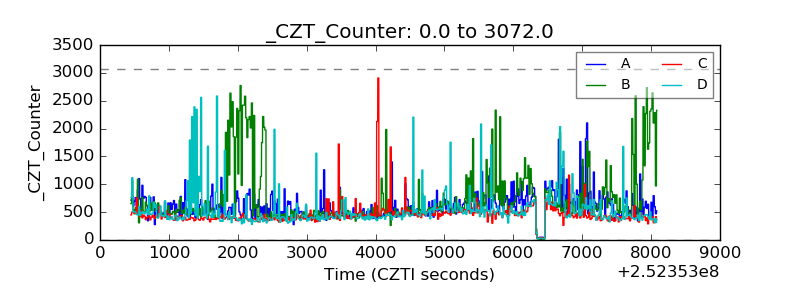 |
| +2.5 Volts monitor |  |
| +5 Volts monitor |  |
| _ROLL_ROT | 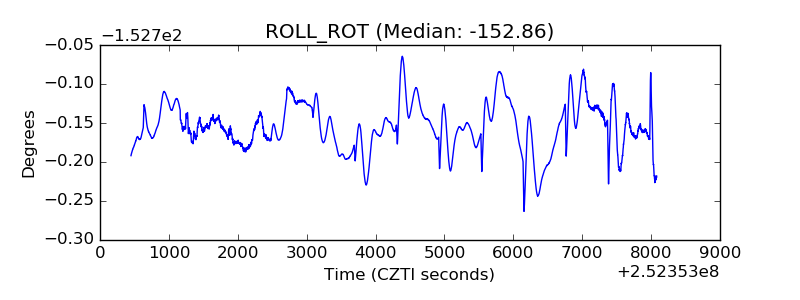 |
| _Roll_DEC | 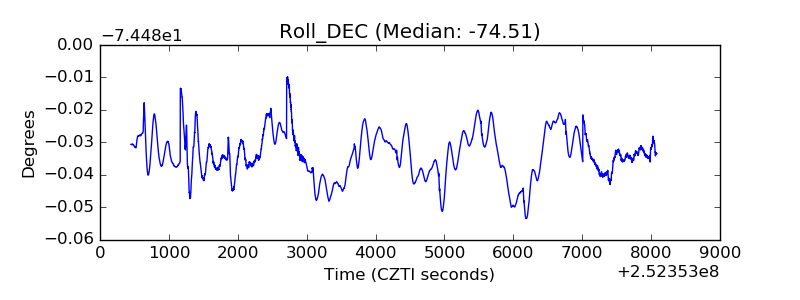 |
| _Roll_RA | 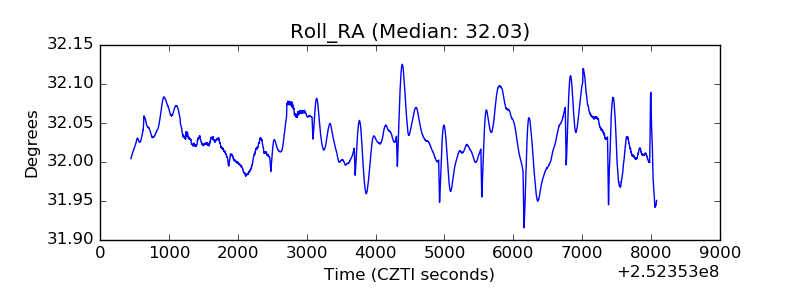 |
| Veto Counter | 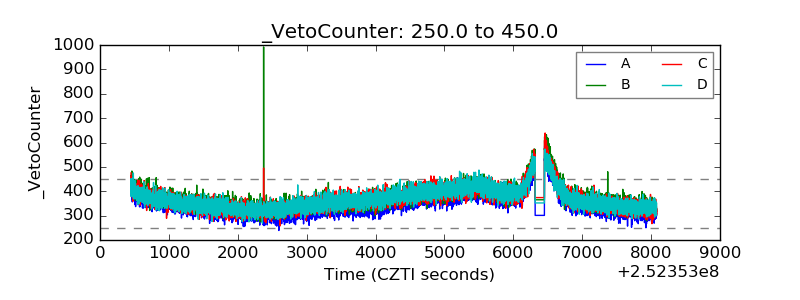 |