| Param | Original file | Final file |
|---|---|---|
| Filename | modeM0/AS1A04_066T01_9000001802_12209cztM0_level2.evt | modeM0/AS1A04_066T01_9000001802_12209cztM0_level2_quad_clean.evt |
| Size (bytes) | 268,191,360 | 48,473,280 |
| Size | 255.8 MB | 46.2 MB |
| Events in quadrant A | 2,858,097 | 322,204 |
| Events in quadrant B | 2,341,041 | 296,819 |
| Events in quadrant C | 1,269,482 | 326,494 |
| Events in quadrant D | 1,455,770 | 315,743 |
| Mode SS | |||
|---|---|---|---|
| Quadrant | BADHDUFLAG | Total packets | Discarded packets |
| A | 0 | 60 | 0 |
| B | 0 | 60 | 0 |
| C | 0 | 60 | 0 |
| D | 0 | 60 | 0 |
| Mode M0 | |||
|---|---|---|---|
| Quadrant | BADHDUFLAG | Total packets | Discarded packets |
| A | 0 | 10528 | 2 |
| B | 0 | 8916 | 1 |
| C | 0 | 6079 | 1 |
| D | 0 | 6543 | 1 |
| Mode M9 | |||
|---|---|---|---|
| Quadrant | BADHDUFLAG | Total packets | Discarded packets |
| A | 0 | 3 | 0 |
| B | 0 | 3 | 0 |
| C | 0 | 3 | 0 |
| D | 0 | 3 | 0 |
| Quadrant | Total seconds | Saturated seconds | Saturation percentage |
|---|---|---|---|
| A | 2885 | 249 | 8.630849% |
| B | 2885 | 516 | 17.885615% |
| C | 2885 | 42 | 1.455806% |
| D | 2885 | 47 | 1.629116% |
Noise dominated data is calculated using 1-second bins in cleaned event files. If a bin has >2000 counts, and if more than 50% of those come from <1% of pixels, then it is considered to be noise-dominated and hence unusable.
| Quadrant | # 1 sec bins | Bins with >0 counts | Bins with >2000 counts | High rate bins dominated by noise | Noise dominated (total time) | Noise dominated (detector-on time) | Marked lightcurve |
|---|---|---|---|---|---|---|---|
| A | 3186 | 2888 | 100 | 100 | 3.14% | 3.46% | 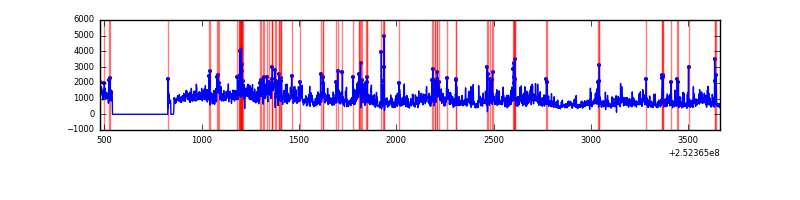 |
| B | 3186 | 2888 | 236 | 236 | 7.41% | 8.17% | 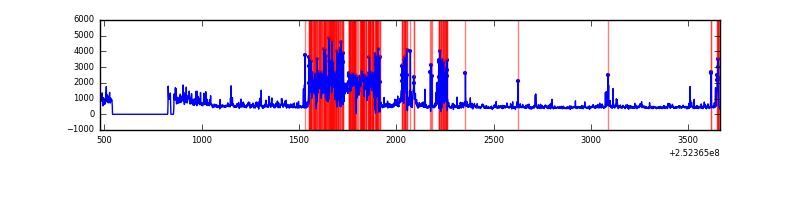 |
| C | 3186 | 2888 | 20 | 20 | 0.63% | 0.69% | 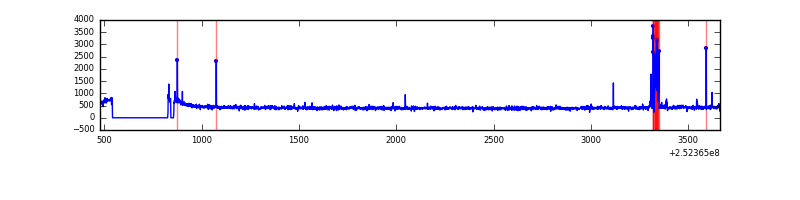 |
| D | 3186 | 2888 | 29 | 29 | 0.91% | 1.00% | 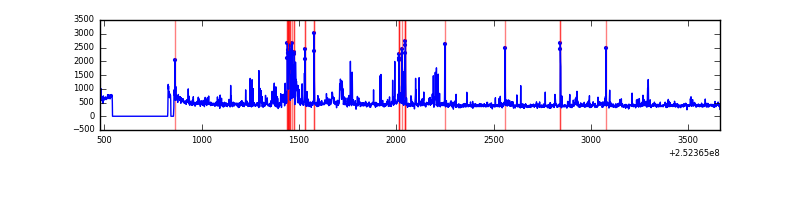 |
Top three noisy pixels from each quadrant. If the there are fewer than three noisy pixels in the level2.evt file, extra rows are filled as -1
| Pixel properties | Quadrant properties | ||||||
|---|---|---|---|---|---|---|---|
| Quadrant | DetID | PixID | Counts | Sigma | Mean | Median | Sigma |
| A | 13 | 251 | 1391083 | 21655.88 | 303 | 297 | 64.2 |
| A | 1 | 162 | 83986 | 1303.12 | 303 | 297 | 64.2 |
| A | 9 | 143 | 70789 | 1097.63 | 303 | 297 | 64.2 |
| B | 4 | 239 | 968808 | 17916.81 | 281 | 274 | 54.1 |
| B | 15 | 204 | 168783 | 3117.23 | 281 | 274 | 54.1 |
| B | 11 | 51 | 36547 | 671.01 | 281 | 274 | 54.1 |
| C | 5 | 112 | 56204 | 778.03 | 302 | 303 | 71.8 |
| C | 15 | 208 | 9259 | 124.65 | 302 | 303 | 71.8 |
| C | 0 | 207 | 6273 | 83.09 | 302 | 303 | 71.8 |
| D | 1 | 52 | 73655 | 997.68 | 297 | 286 | 73.5 |
| D | 10 | 199 | 52441 | 709.21 | 297 | 286 | 73.5 |
| D | 13 | 249 | 46152 | 623.69 | 297 | 286 | 73.5 |
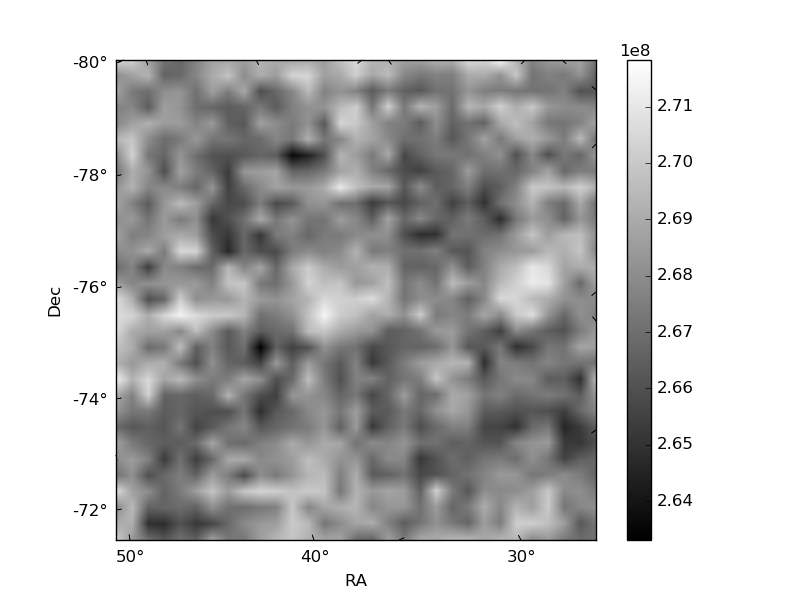
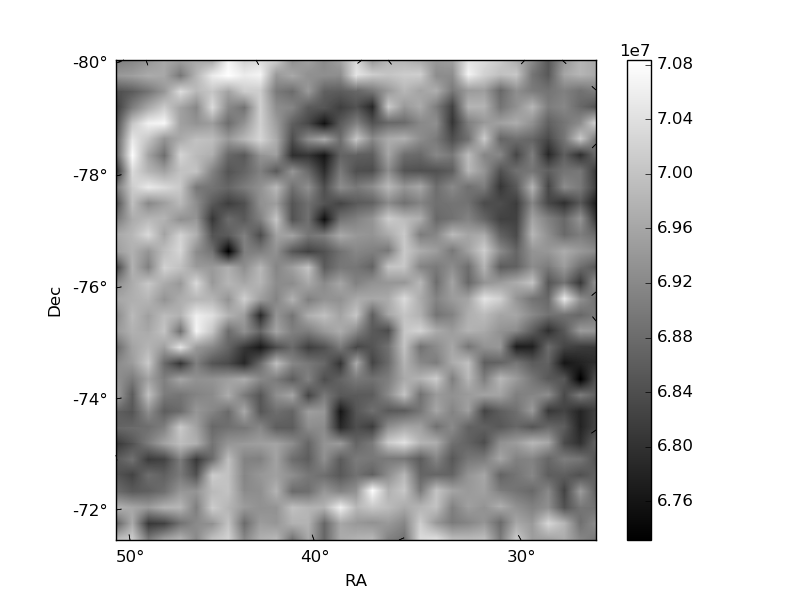
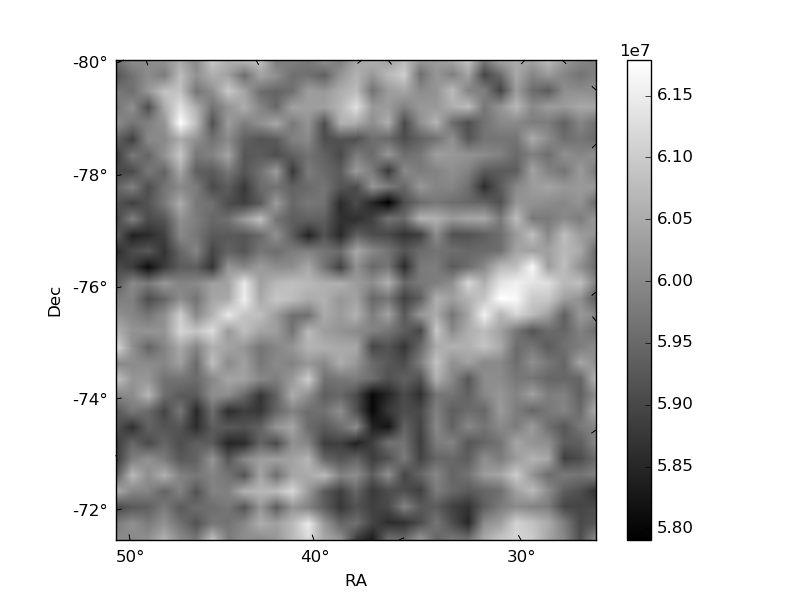
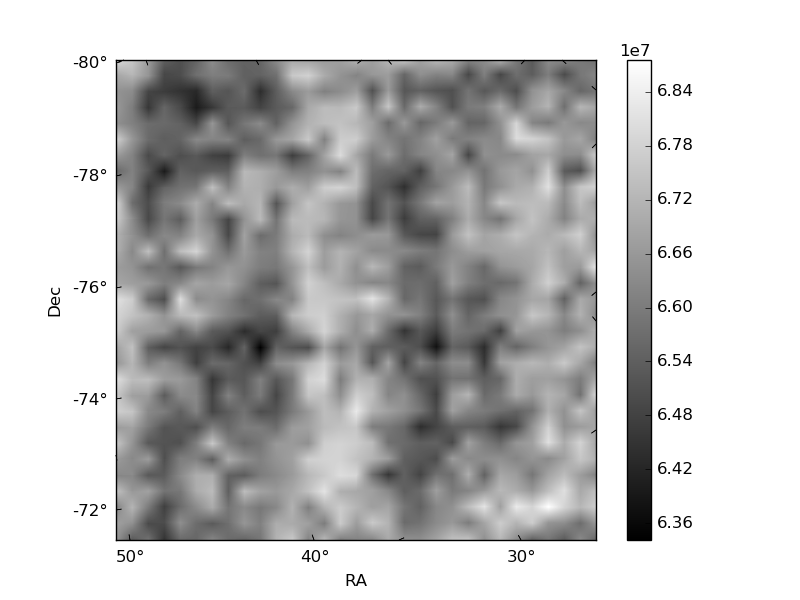
Histogram calculated using DETX and DETY for each event in the final _common_clean file
| Quadrant A | 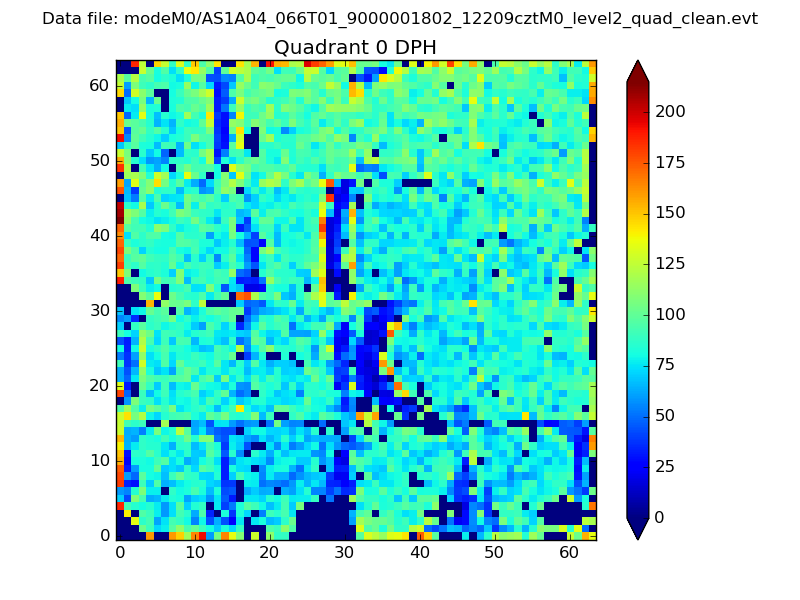 |
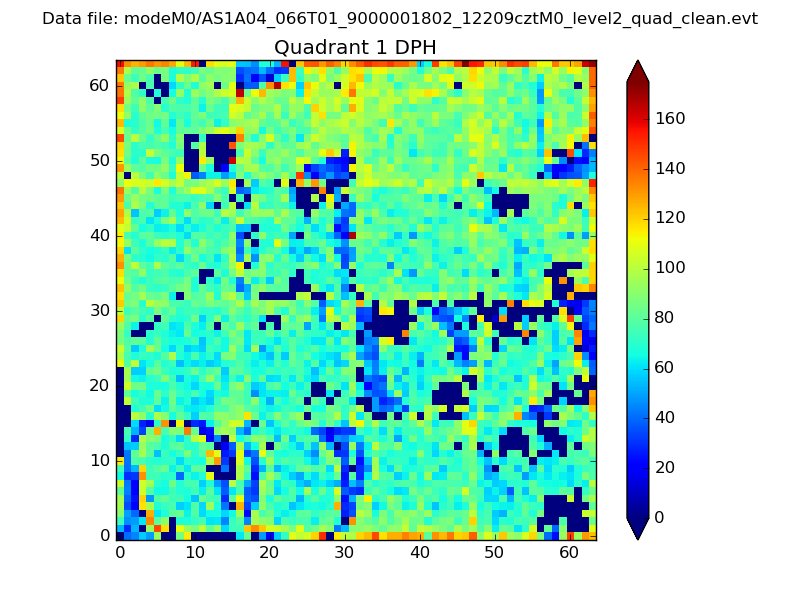 |
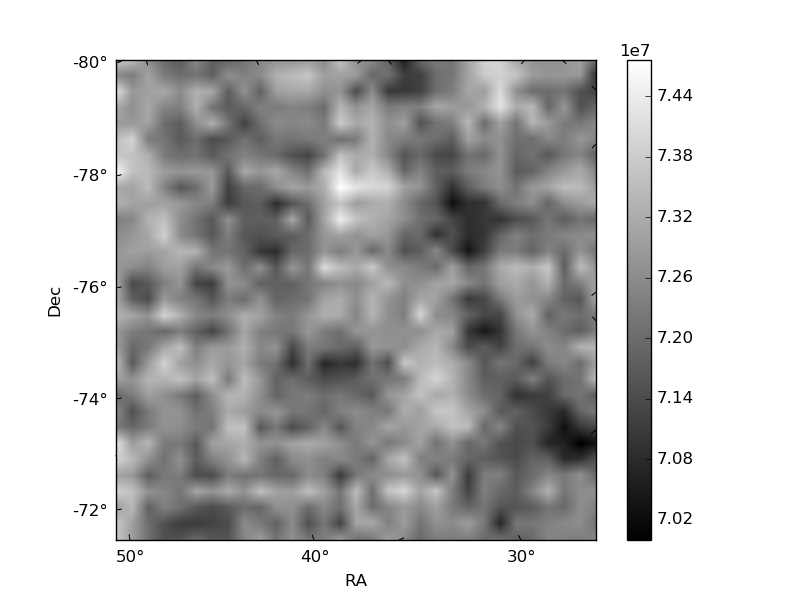
Quadrant B |
|---|---|---|---|
| Quadrant D | 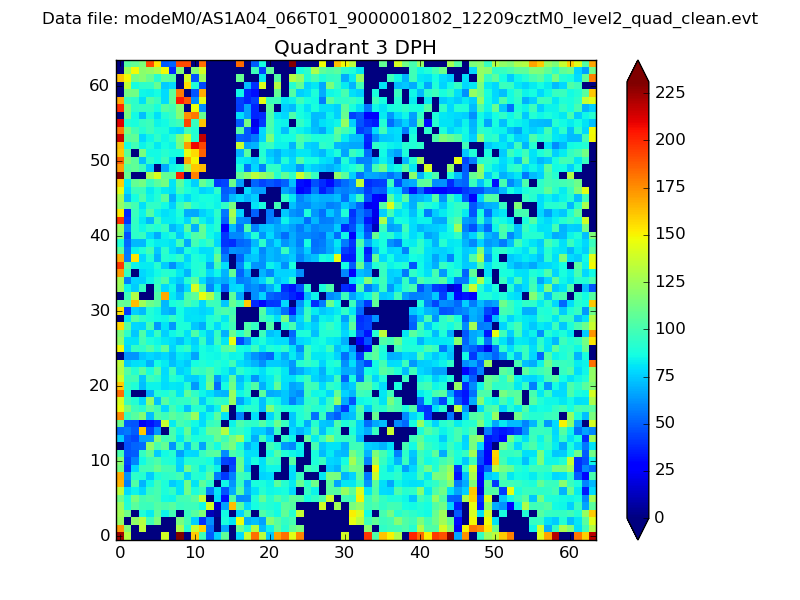 |
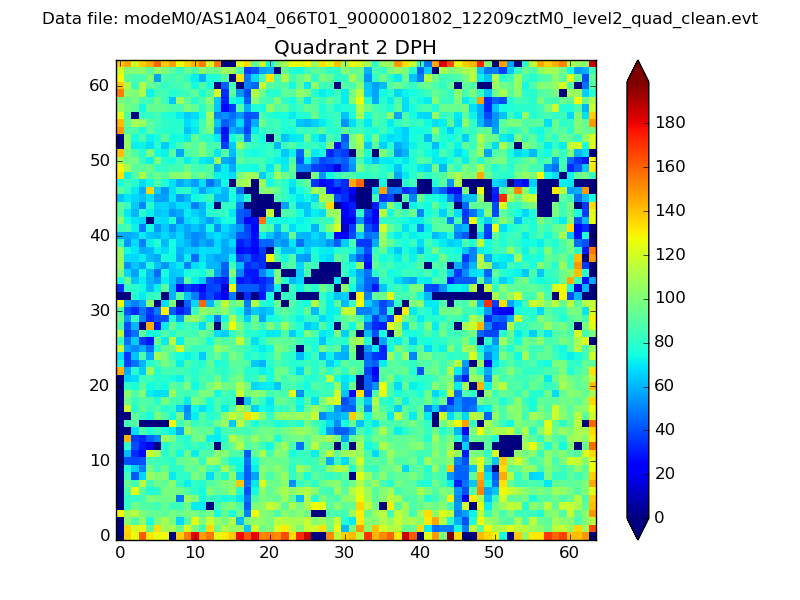 |
Quadrant C |
| Plot type | Count rate plots | Images |
|---|---|---|
| Comparison with Poisson distribution Blue bars denote a histogram of data divided into 1 sec bins. Red curve is a Poisson curve with rate = median count rate of data. |
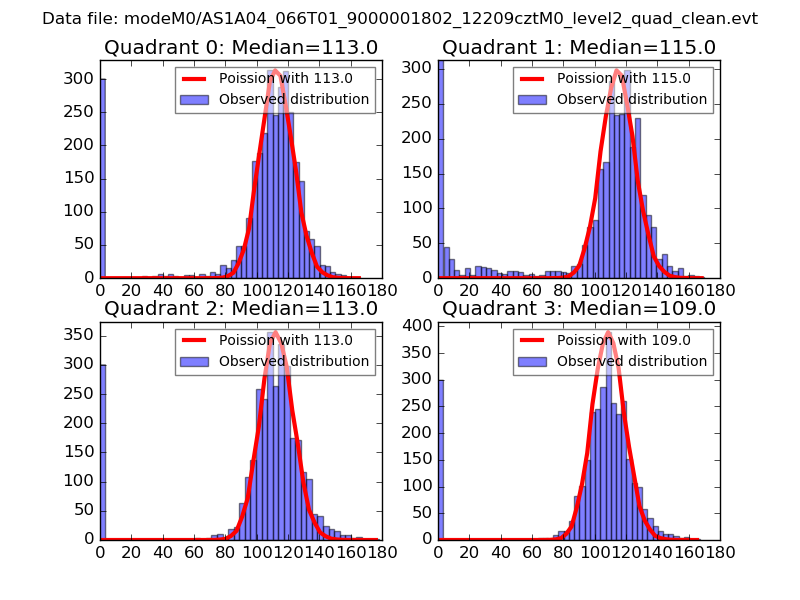 |
 |
| Quadrant-wise count rates Data is divided into 100 sec bins |
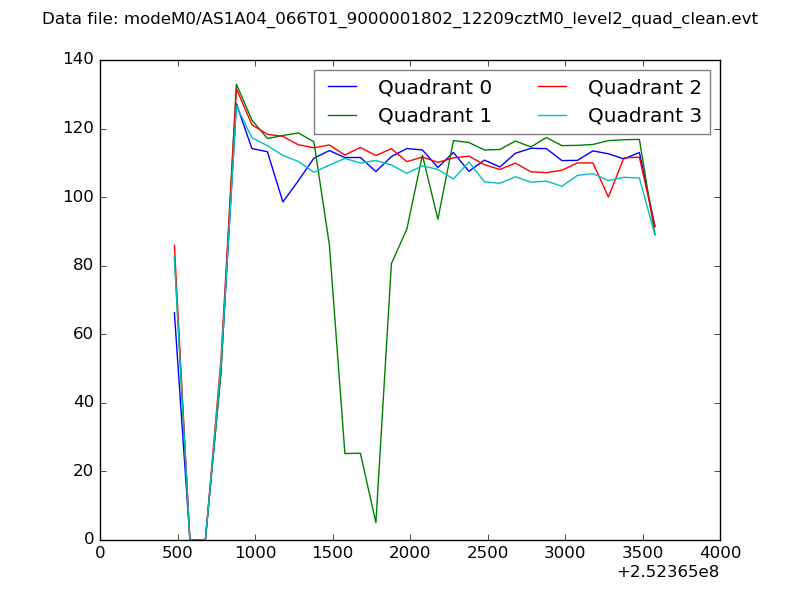 |
|
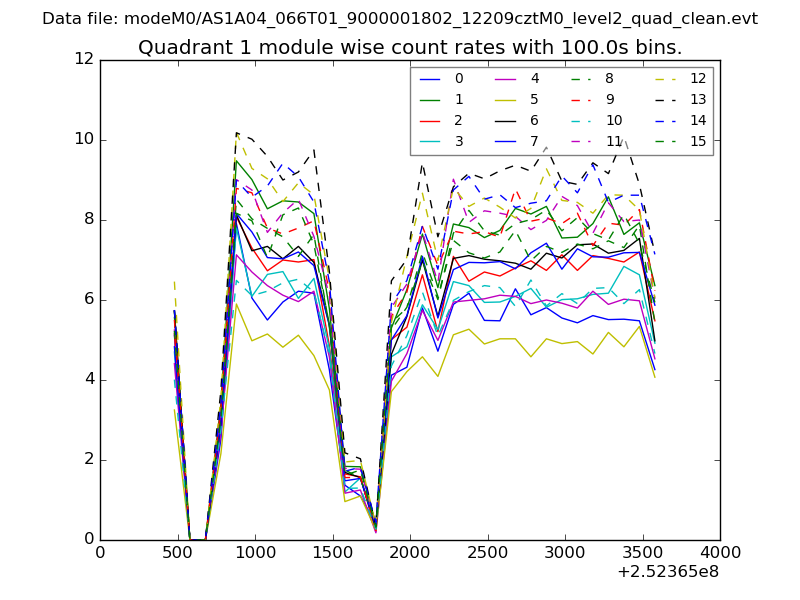
| Module-wise count rates for Quadrant A Data is divided into 100 sec bins |
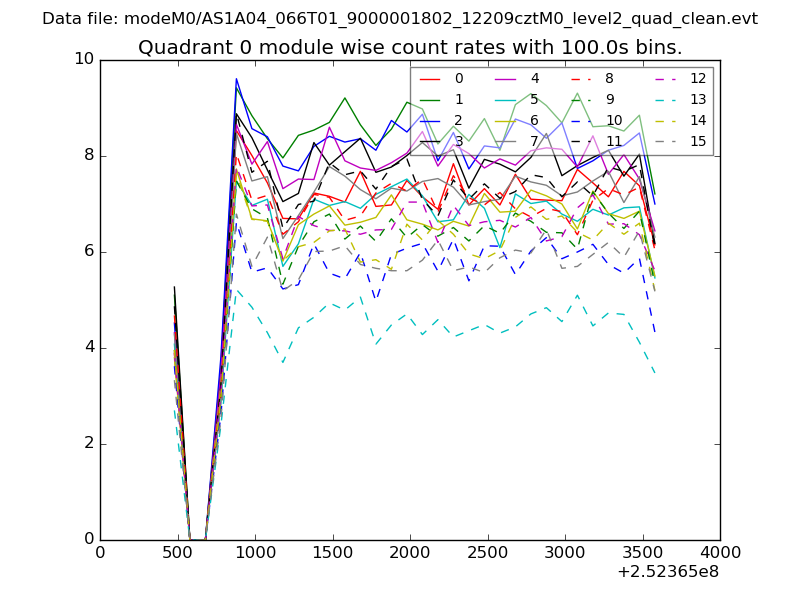 |
 |
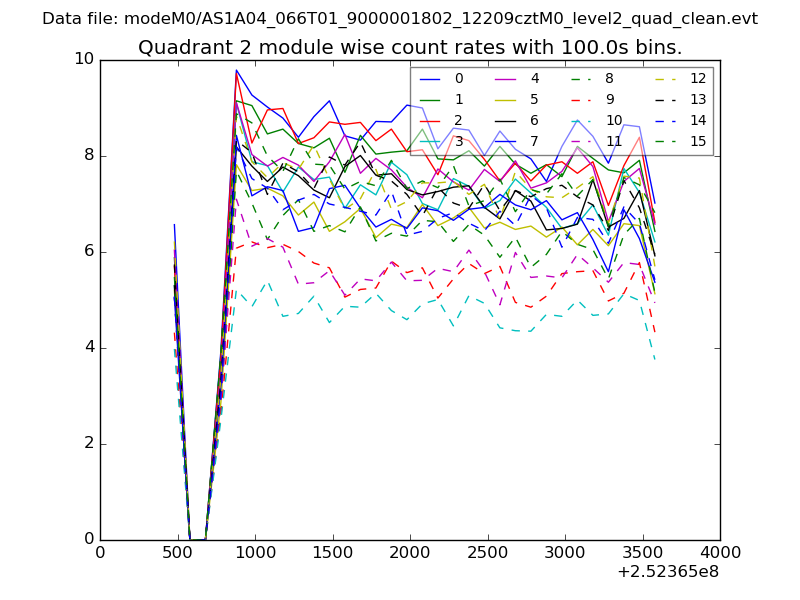
| Module-wise count rates for Quadrant B Data is divided into 100 sec bins |
 |
 |
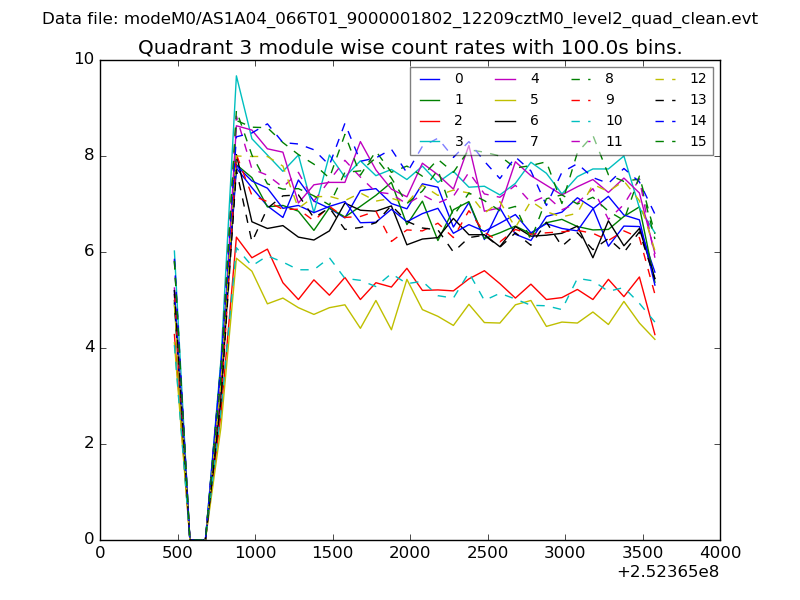
| Module-wise count rates for Quadrant C Data is divided into 100 sec bins |
 |
 |
| Module-wise count rates for Quadrant D Data is divided into 100 sec bins |
 |
 |
| Parameter | Plot |
|---|---|
| CZT HV Monitor | 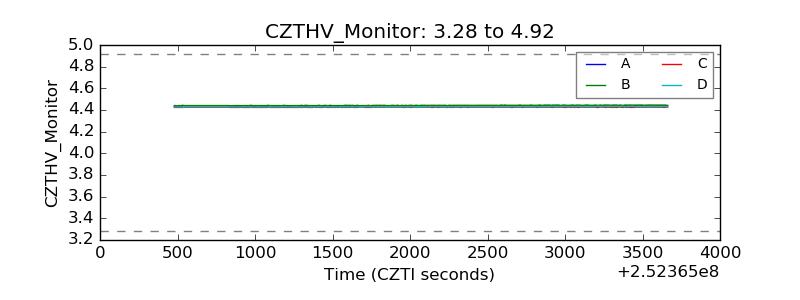 |
| D_VDD | 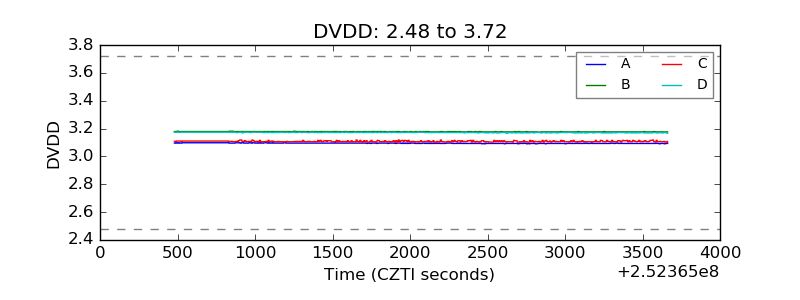 |
| Temperature 1 | 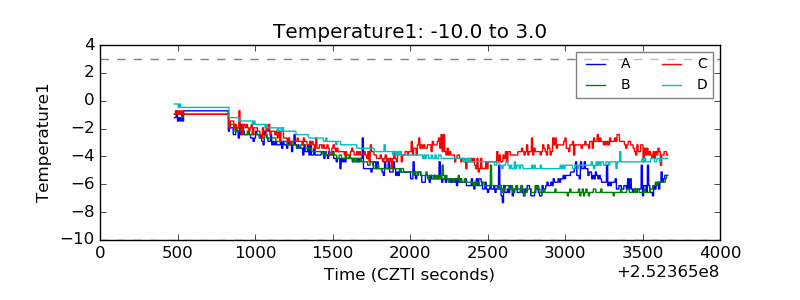 |
| Veto HV Monitor | 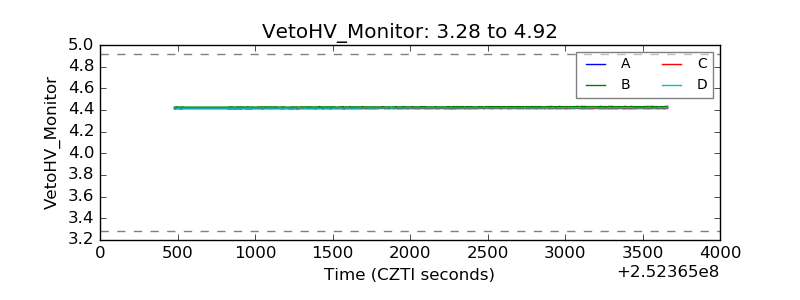 |
| Veto LLD | 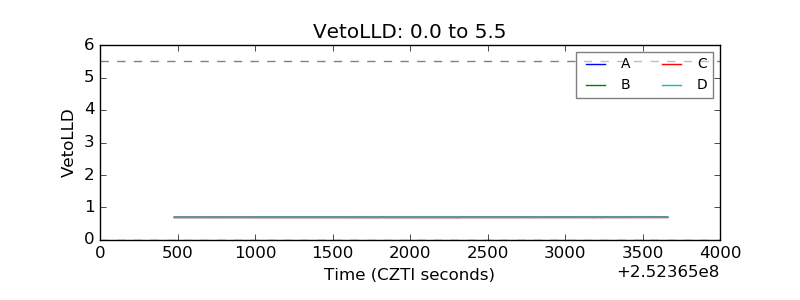 |
| Alpha Counter | 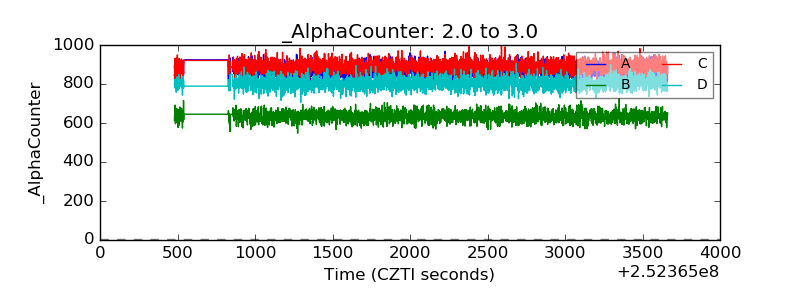 |
| _CPM_Rate | 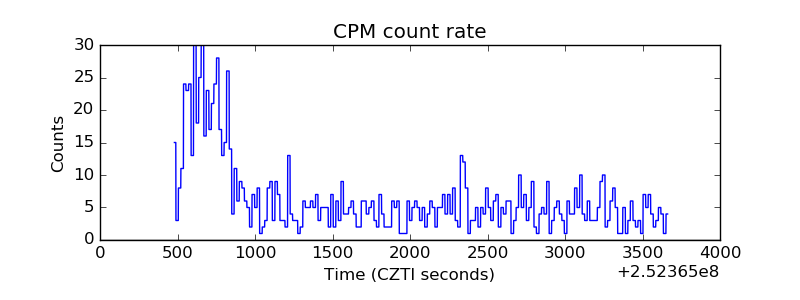 |
| CZT Counter | 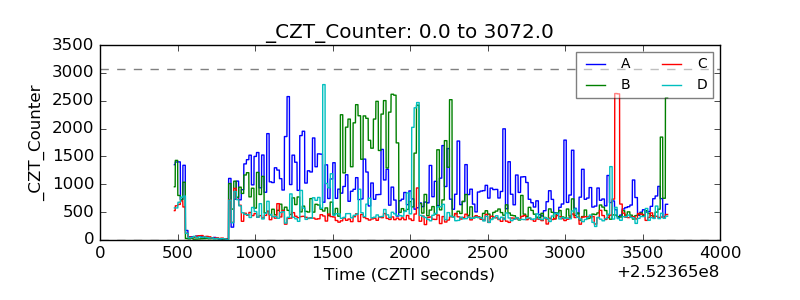 |
| +2.5 Volts monitor |  |
| +5 Volts monitor | 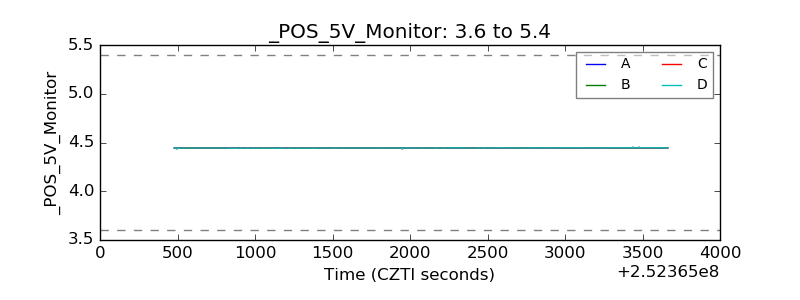 |
| _ROLL_ROT | 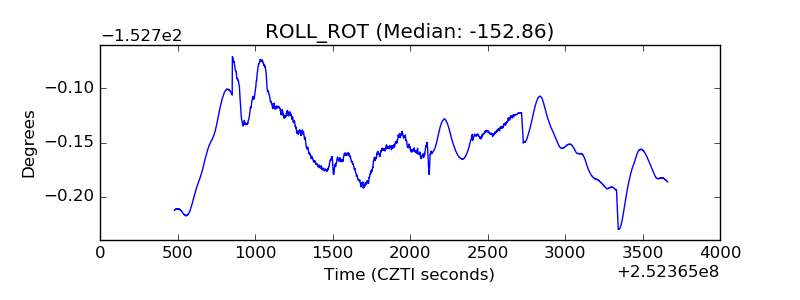 |
| _Roll_DEC | 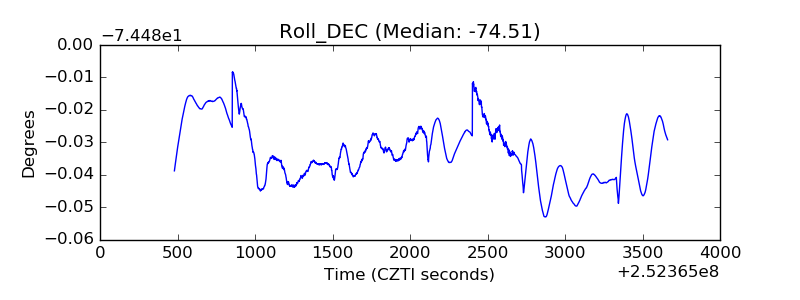 |
| _Roll_RA | 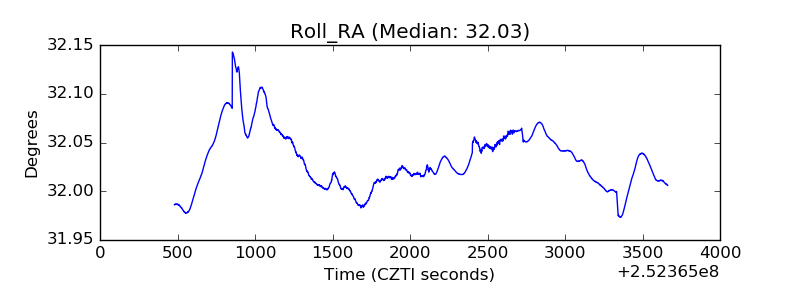 |
| Veto Counter | 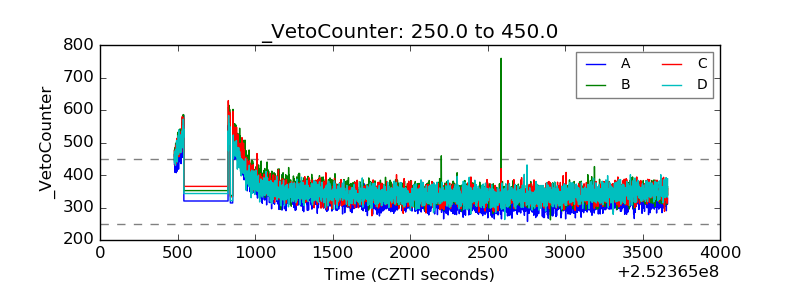 |