| Param | Original file | Final file |
|---|---|---|
| Filename | modeM0/AS1A04_066T01_9000001802_12210cztM0_level2.evt | modeM0/AS1A04_066T01_9000001802_12210cztM0_level2_quad_clean.evt |
| Size (bytes) | 1,516,394,880 | 283,446,720 |
| Size | 1.4 GB | 270.3 MB |
| Events in quadrant A | 14,522,748 | 1,877,081 |
| Events in quadrant B | 13,762,108 | 1,837,732 |
| Events in quadrant C | 7,325,400 | 1,923,681 |
| Events in quadrant D | 9,223,142 | 1,828,779 |
| Mode SS | |||
|---|---|---|---|
| Quadrant | BADHDUFLAG | Total packets | Discarded packets |
| A | 0 | 330 | 0 |
| B | 0 | 330 | 0 |
| C | 0 | 330 | 0 |
| D | 0 | 330 | 0 |
| Mode M0 | |||
|---|---|---|---|
| Quadrant | BADHDUFLAG | Total packets | Discarded packets |
| A | 0 | 54647 | 4 |
| B | 0 | 51947 | 3 |
| C | 0 | 33227 | 3 |
| D | 0 | 38857 | 3 |
| Mode M9 | |||
|---|---|---|---|
| Quadrant | BADHDUFLAG | Total packets | Discarded packets |
| A | 0 | 20 | 0 |
| B | 0 | 20 | 0 |
| C | 0 | 20 | 0 |
| D | 0 | 20 | 0 |
| Quadrant | Total seconds | Saturated seconds | Saturation percentage |
|---|---|---|---|
| A | 16196 | 974 | 6.013831% |
| B | 16196 | 1894 | 11.694245% |
| C | 16196 | 106 | 0.654483% |
| D | 16196 | 393 | 2.426525% |
Noise dominated data is calculated using 1-second bins in cleaned event files. If a bin has >2000 counts, and if more than 50% of those come from <1% of pixels, then it is considered to be noise-dominated and hence unusable.
| Quadrant | # 1 sec bins | Bins with >0 counts | Bins with >2000 counts | High rate bins dominated by noise | Noise dominated (total time) | Noise dominated (detector-on time) | Marked lightcurve |
|---|---|---|---|---|---|---|---|
| A | 18157 | 16200 | 361 | 361 | 1.99% | 2.23% | 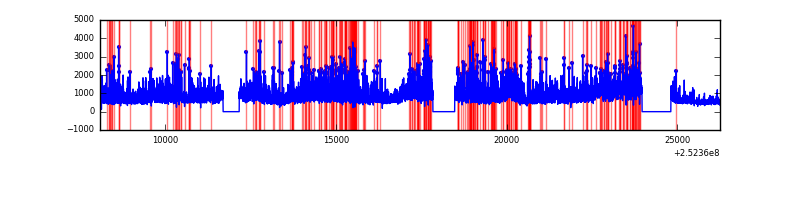 |
| B | 18157 | 16199 | 1056 | 1056 | 5.82% | 6.52% | 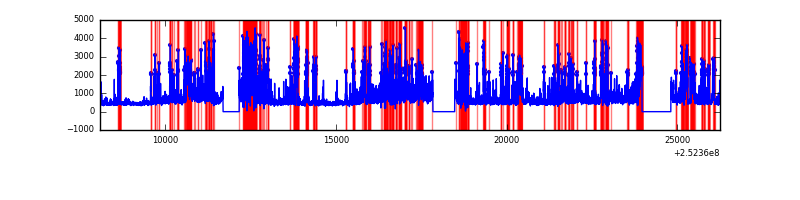 |
| C | 18157 | 16200 | 26 | 26 | 0.14% | 0.16% | 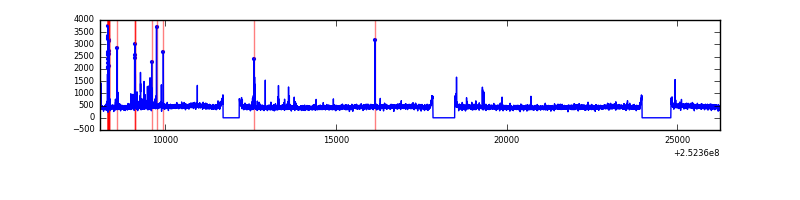 |
| D | 18157 | 16200 | 273 | 273 | 1.50% | 1.69% | 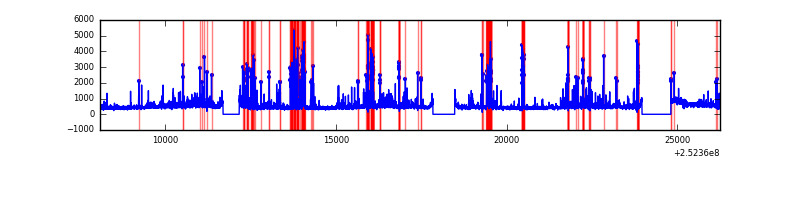 |
Top three noisy pixels from each quadrant. If the there are fewer than three noisy pixels in the level2.evt file, extra rows are filled as -1
| Pixel properties | Quadrant properties | ||||||
|---|---|---|---|---|---|---|---|
| Quadrant | DetID | PixID | Counts | Sigma | Mean | Median | Sigma |
| A | 13 | 251 | 6130840 | 16513.44 | 1833 | 1791 | 371.2 |
| A | 1 | 162 | 432730 | 1161.07 | 1833 | 1791 | 371.2 |
| A | 1 | 178 | 245147 | 655.67 | 1833 | 1791 | 371.2 |
| B | 4 | 239 | 4459534 | 13386.82 | 1772 | 1728 | 333.0 |
| B | 15 | 204 | 981648 | 2942.71 | 1772 | 1728 | 333.0 |
| B | 3 | 64 | 535218 | 1602.07 | 1772 | 1728 | 333.0 |
| C | 15 | 208 | 147772 | 351.28 | 1812 | 1816 | 415.5 |
| C | 5 | 112 | 59558 | 138.97 | 1812 | 1816 | 415.5 |
| C | 12 | 4 | 14845 | 31.36 | 1812 | 1816 | 415.5 |
| D | 1 | 52 | 1401588 | 3291.43 | 1792 | 1736 | 425.3 |
| D | 13 | 104 | 345671 | 808.68 | 1792 | 1736 | 425.3 |
| D | 10 | 199 | 189762 | 442.1 | 1792 | 1736 | 425.3 |
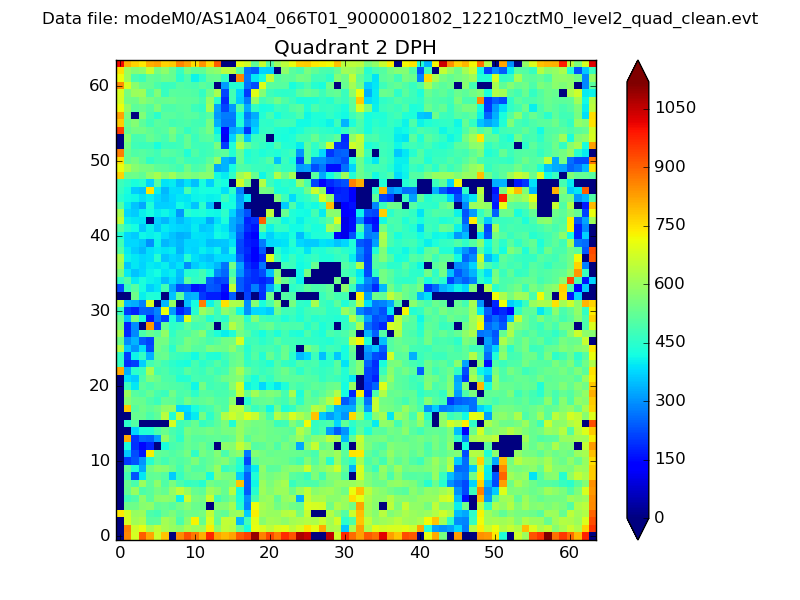
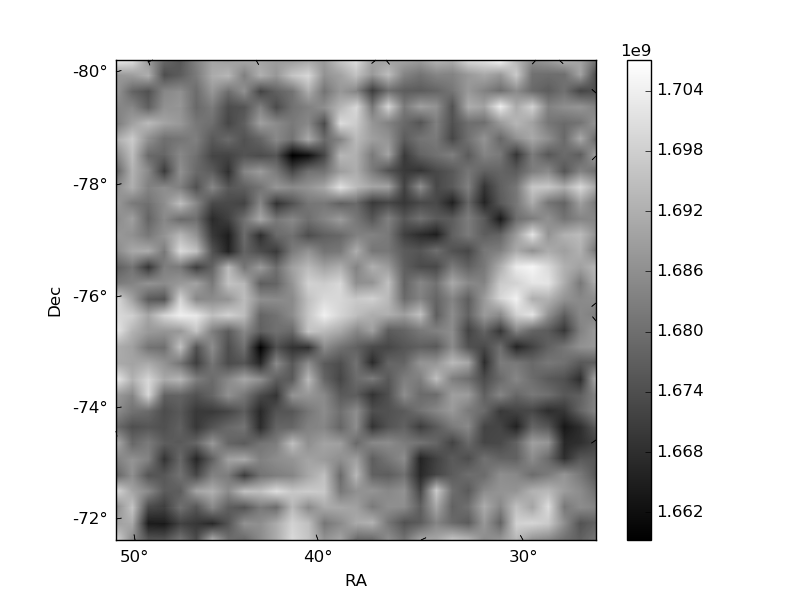
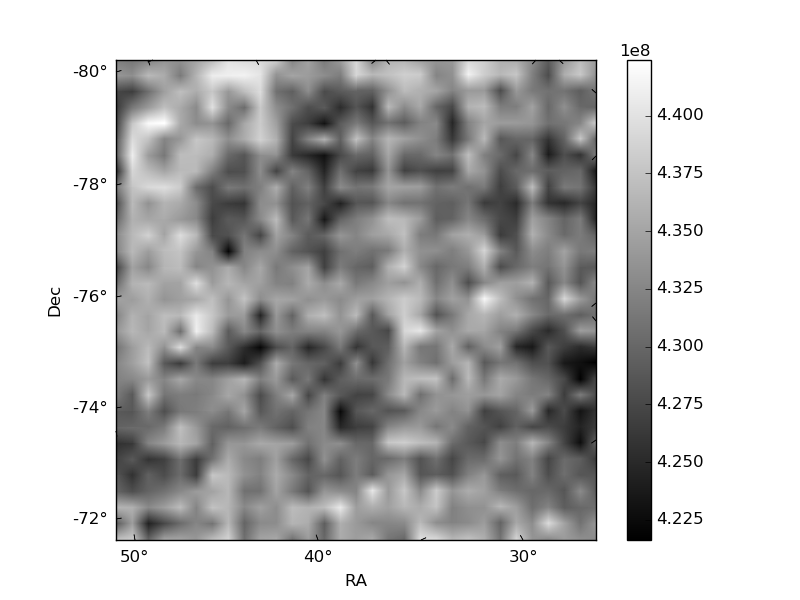
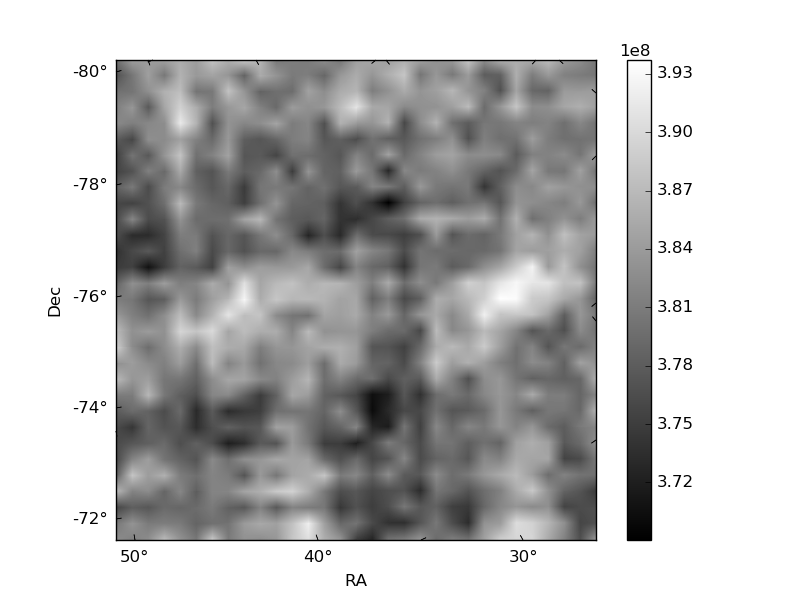
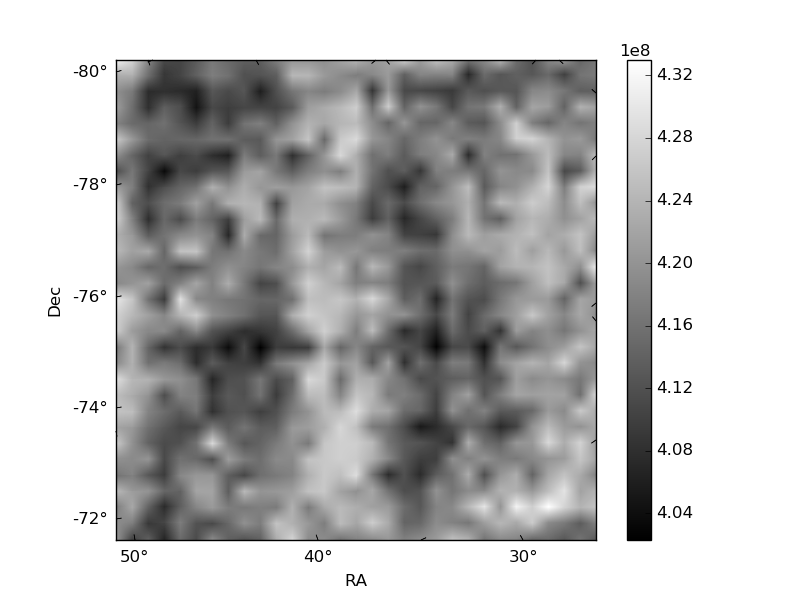
Histogram calculated using DETX and DETY for each event in the final _common_clean file
| Quadrant A | 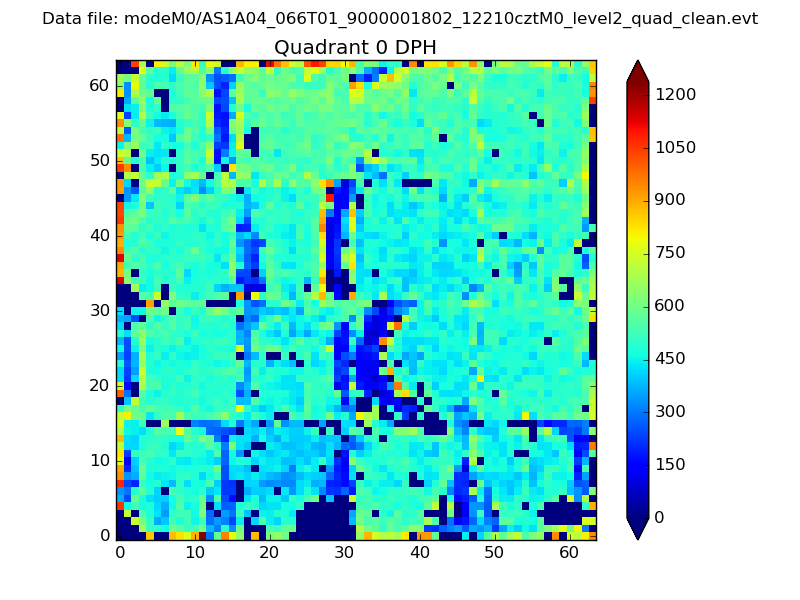 |
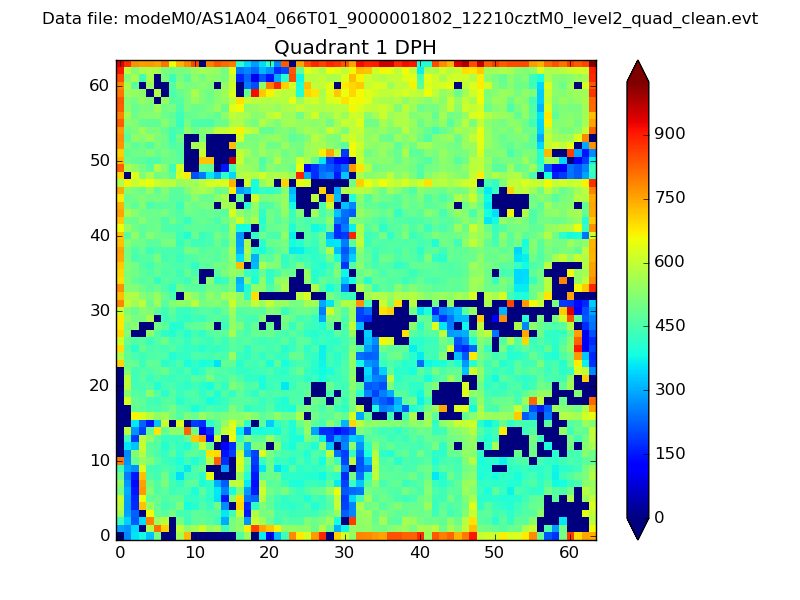 |
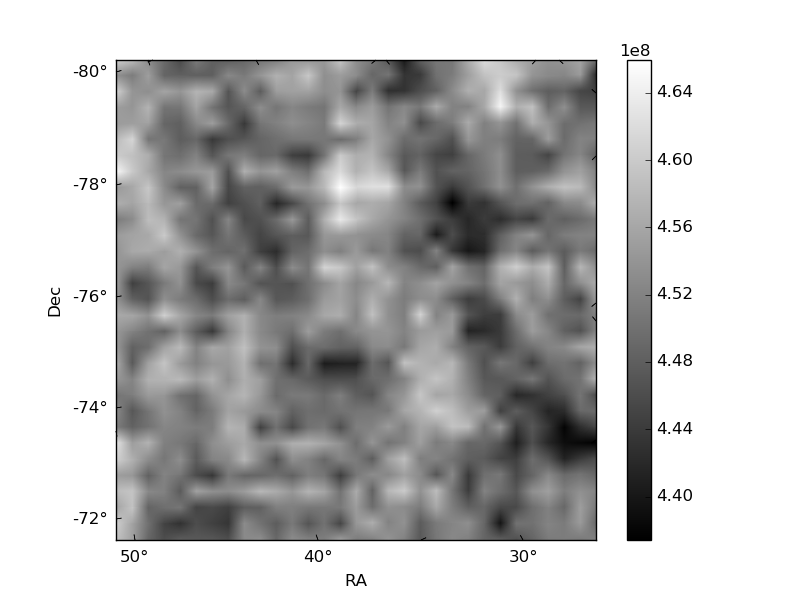
Quadrant B |
|---|---|---|---|
| Quadrant D | 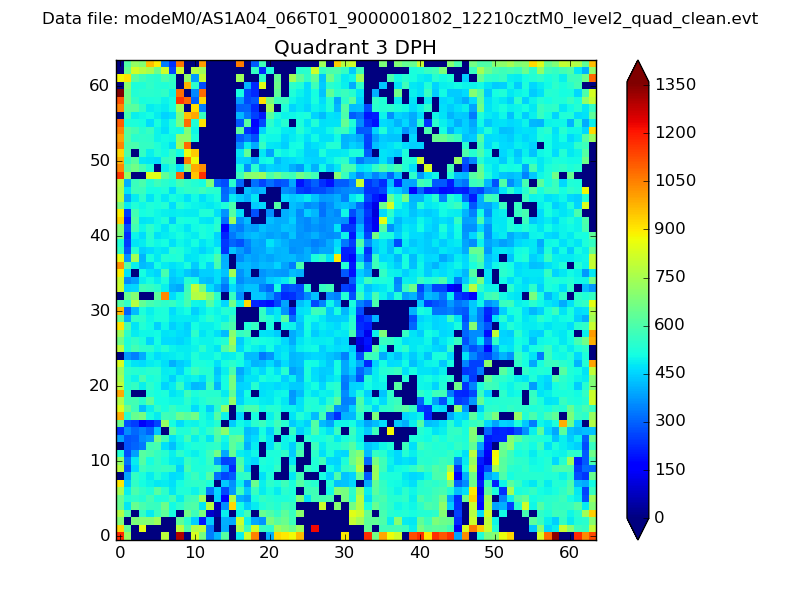 |
 |
Quadrant C |
| Plot type | Count rate plots | Images |
|---|---|---|
| Comparison with Poisson distribution Blue bars denote a histogram of data divided into 1 sec bins. Red curve is a Poisson curve with rate = median count rate of data. |
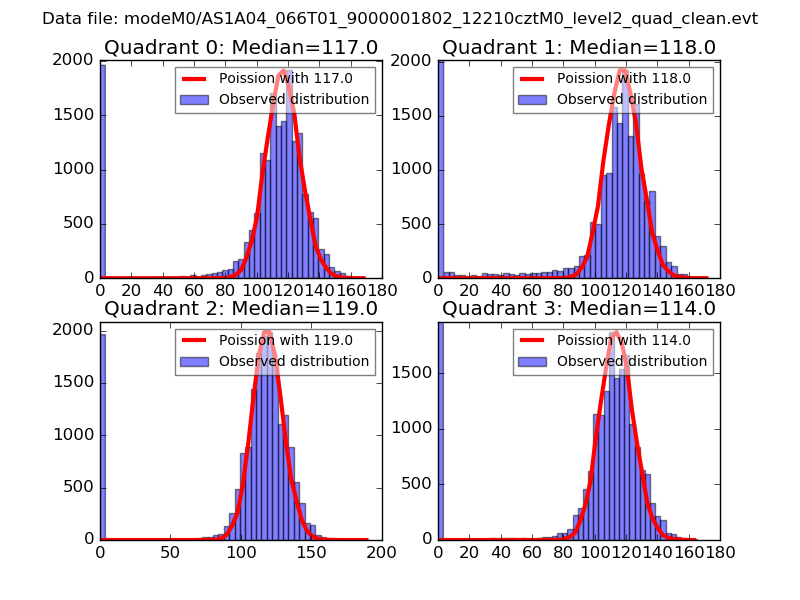 |
 |
| Quadrant-wise count rates Data is divided into 100 sec bins |
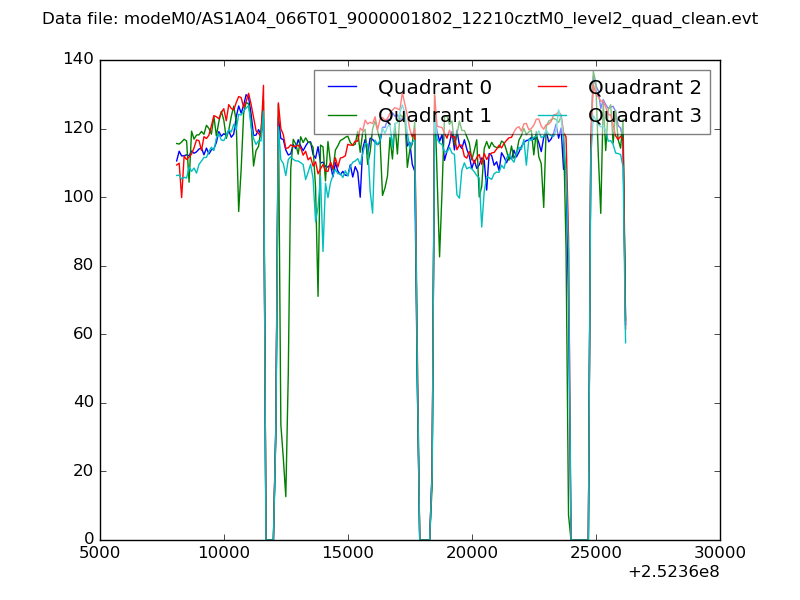 |
|
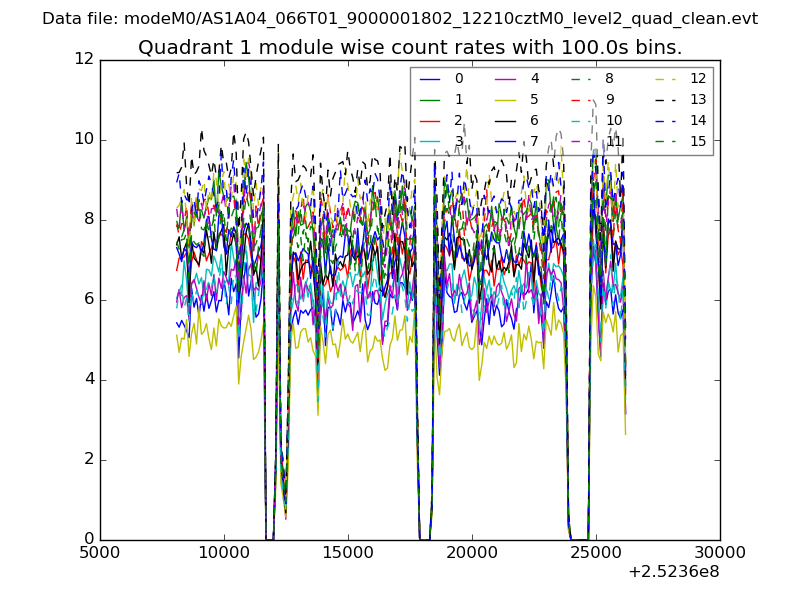
| Module-wise count rates for Quadrant A Data is divided into 100 sec bins |
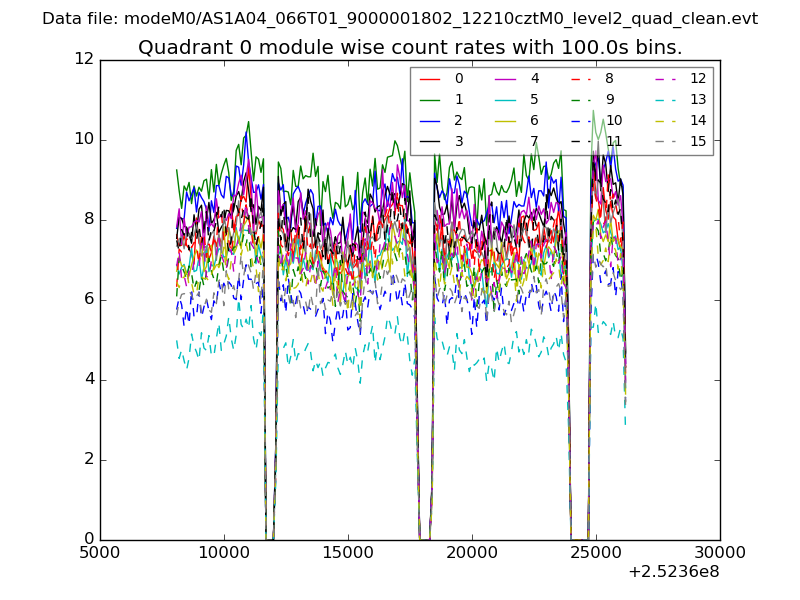 |
 |
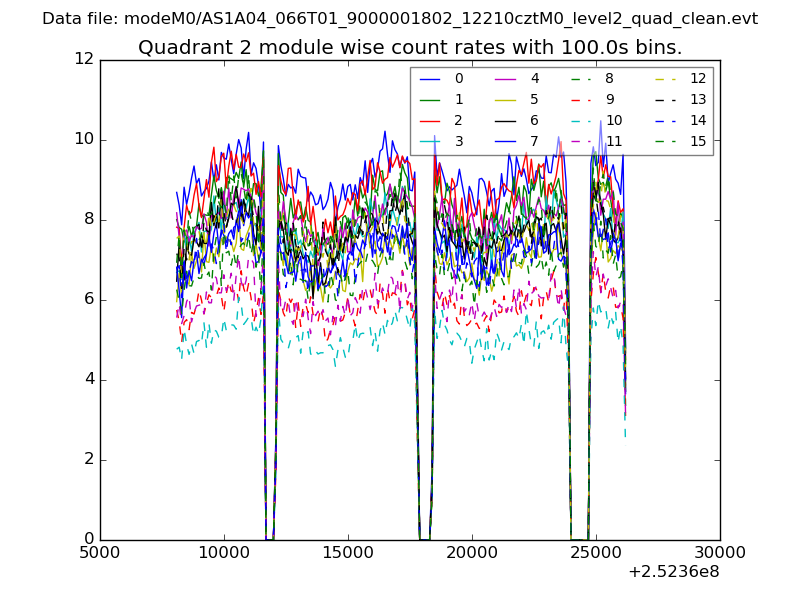
| Module-wise count rates for Quadrant B Data is divided into 100 sec bins |
 |
 |
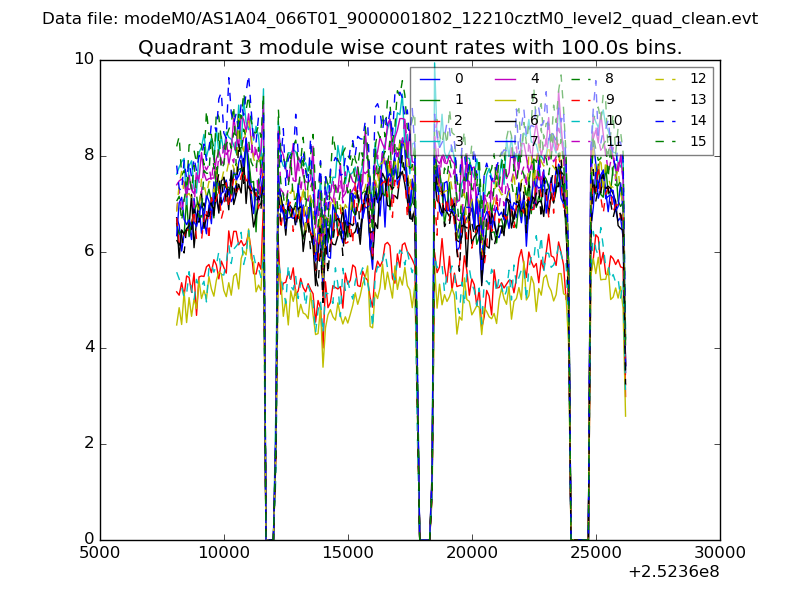
| Module-wise count rates for Quadrant C Data is divided into 100 sec bins |
 |
 |
| Module-wise count rates for Quadrant D Data is divided into 100 sec bins |
 |
 |
| Parameter | Plot |
|---|---|
| CZT HV Monitor | 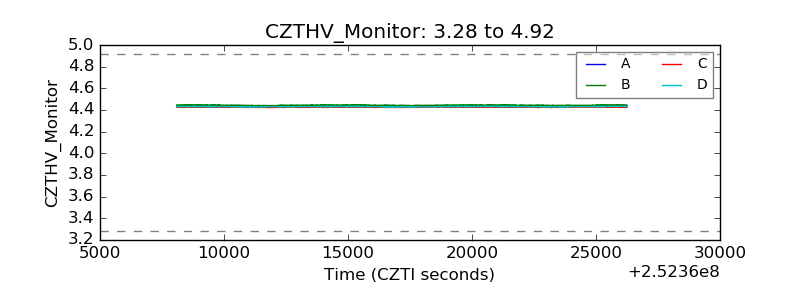 |
| D_VDD | 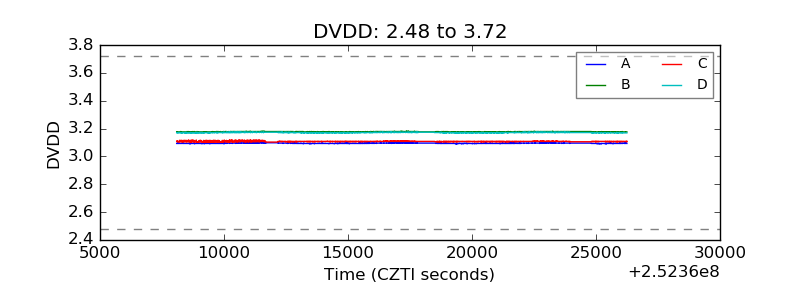 |
| Temperature 1 | 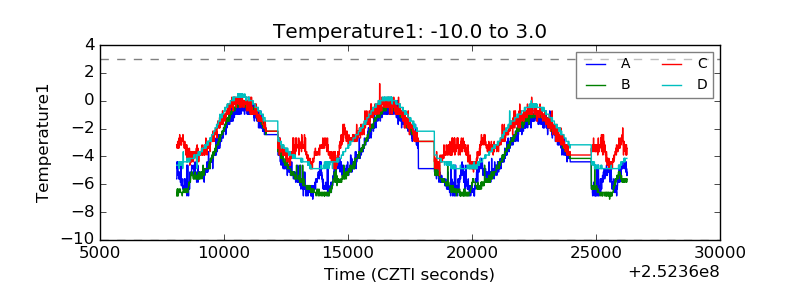 |
| Veto HV Monitor | 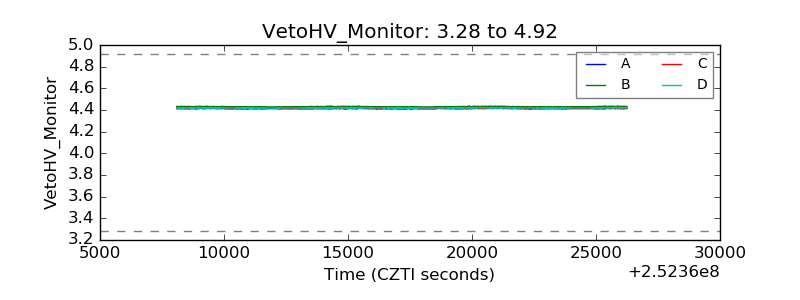 |
| Veto LLD | 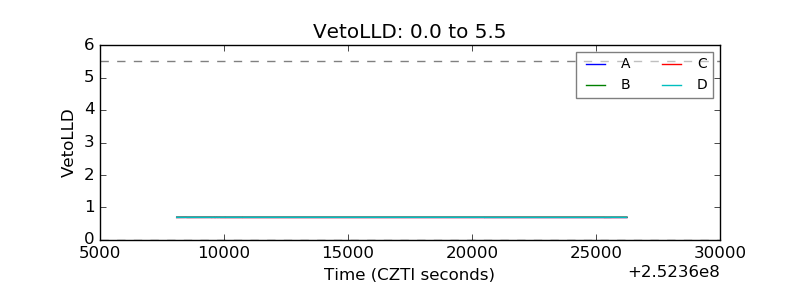 |
| Alpha Counter | 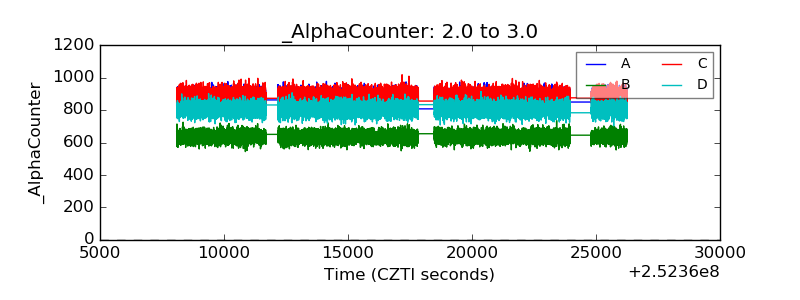 |
| _CPM_Rate | 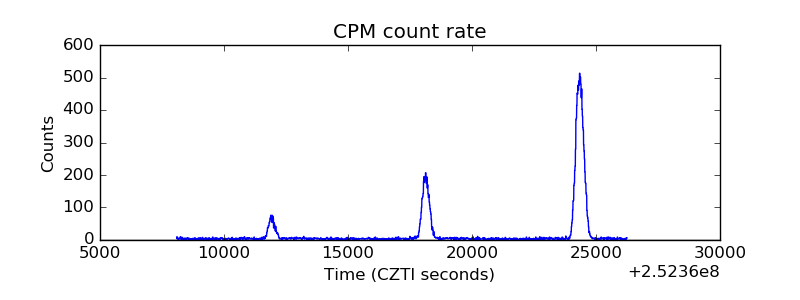 |
| CZT Counter | 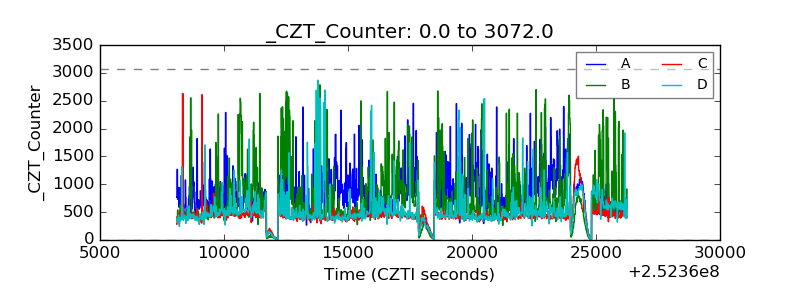 |
| +2.5 Volts monitor | 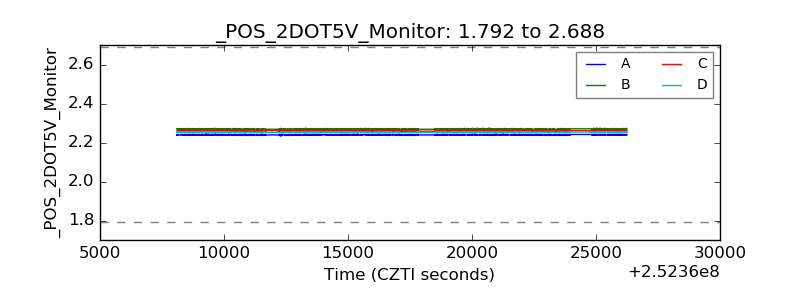 |
| +5 Volts monitor | 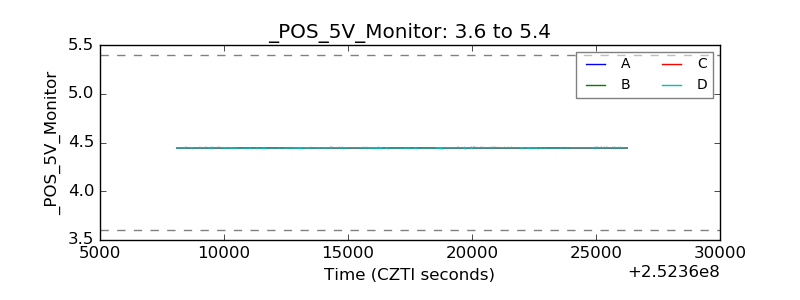 |
| _ROLL_ROT | 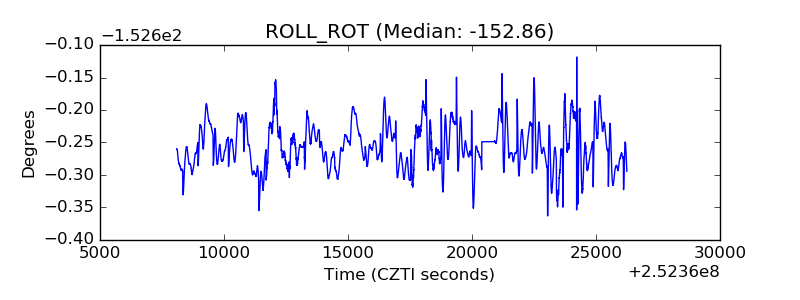 |
| _Roll_DEC | 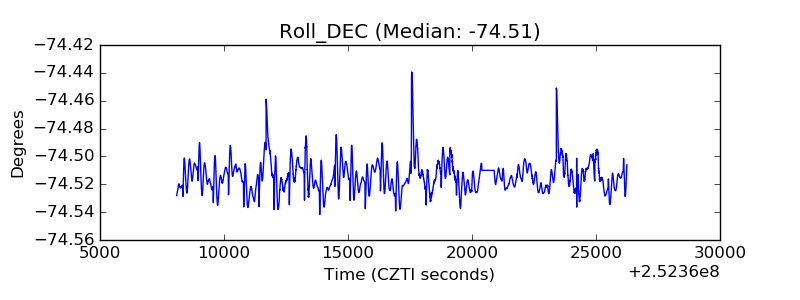 |
| _Roll_RA |  |
| Veto Counter | 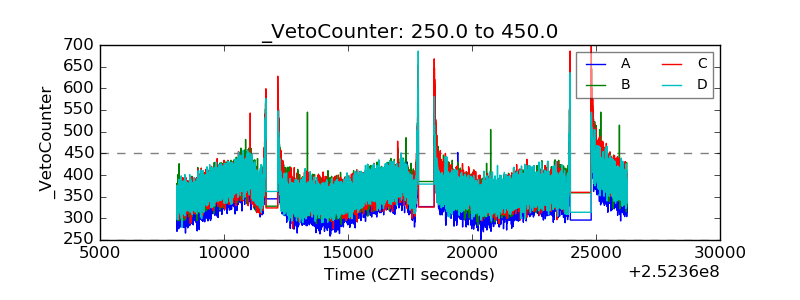 |