| Param | Original file | Final file |
|---|---|---|
| Filename | modeM0/AS1A04_066T01_9000001802_12211cztM0_level2.evt | modeM0/AS1A04_066T01_9000001802_12211cztM0_level2_quad_clean.evt |
| Size (bytes) | 647,582,400 | 121,083,840 |
| Size | 617.6 MB | 115.5 MB |
| Events in quadrant A | 5,314,368 | 819,220 |
| Events in quadrant B | 6,360,775 | 768,918 |
| Events in quadrant C | 3,086,116 | 834,879 |
| Events in quadrant D | 4,396,039 | 774,990 |
| Mode SS | |||
|---|---|---|---|
| Quadrant | BADHDUFLAG | Total packets | Discarded packets |
| A | 0 | 138 | 0 |
| B | 0 | 138 | 0 |
| C | 0 | 138 | 0 |
| D | 0 | 138 | 0 |
| Mode M0 | |||
|---|---|---|---|
| Quadrant | BADHDUFLAG | Total packets | Discarded packets |
| A | 0 | 20486 | 3 |
| B | 0 | 23366 | 2 |
| C | 0 | 13809 | 2 |
| D | 0 | 17770 | 2 |
| Mode M9 | |||
|---|---|---|---|
| Quadrant | BADHDUFLAG | Total packets | Discarded packets |
| A | 0 | 13 | 0 |
| B | 0 | 13 | 0 |
| C | 0 | 13 | 0 |
| D | 0 | 14 | 0 |
| Quadrant | Total seconds | Saturated seconds | Saturation percentage |
|---|---|---|---|
| A | 6718 | 250 | 3.721346% |
| B | 6718 | 1114 | 16.582316% |
| C | 6718 | 43 | 0.640071% |
| D | 6718 | 357 | 5.314082% |
Noise dominated data is calculated using 1-second bins in cleaned event files. If a bin has >2000 counts, and if more than 50% of those come from <1% of pixels, then it is considered to be noise-dominated and hence unusable.
| Quadrant | # 1 sec bins | Bins with >0 counts | Bins with >2000 counts | High rate bins dominated by noise | Noise dominated (total time) | Noise dominated (detector-on time) | Marked lightcurve |
|---|---|---|---|---|---|---|---|
| A | 7704 | 6720 | 98 | 98 | 1.27% | 1.46% | 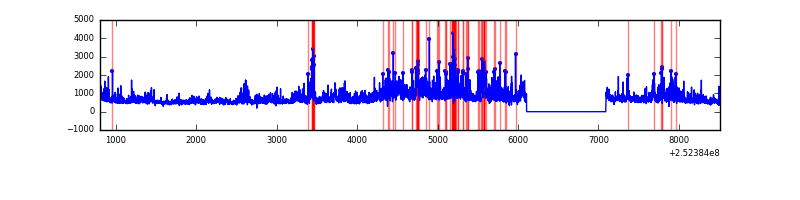 |
| B | 7704 | 6720 | 680 | 680 | 8.83% | 10.12% | 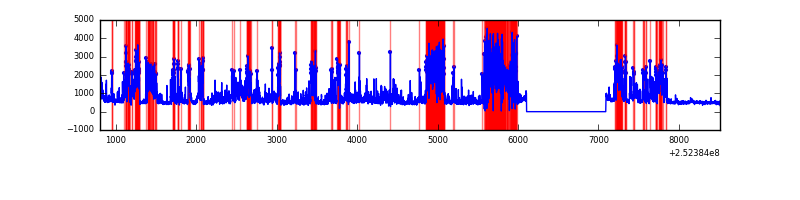 |
| C | 7704 | 6720 | 3 | 3 | 0.04% | 0.04% | 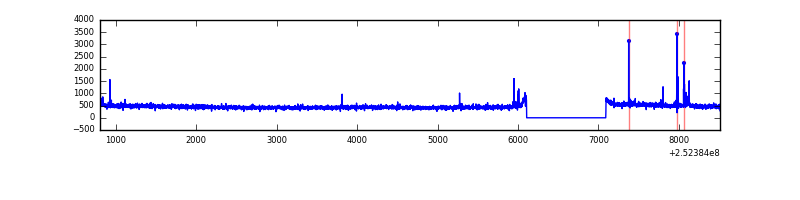 |
| D | 7704 | 6720 | 241 | 241 | 3.13% | 3.59% | 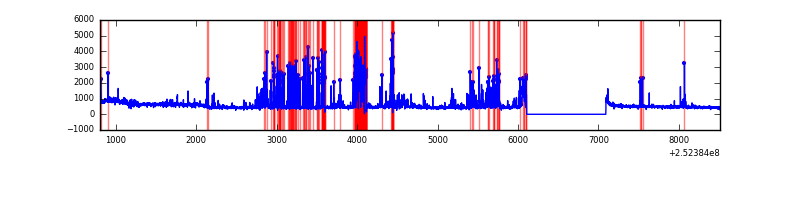 |
Top three noisy pixels from each quadrant. If the there are fewer than three noisy pixels in the level2.evt file, extra rows are filled as -1
| Pixel properties | Quadrant properties | ||||||
|---|---|---|---|---|---|---|---|
| Quadrant | DetID | PixID | Counts | Sigma | Mean | Median | Sigma |
| A | 13 | 251 | 1345517 | 8470.43 | 779 | 761 | 158.8 |
| A | 8 | 15 | 650732 | 4094.07 | 779 | 761 | 158.8 |
| A | 1 | 162 | 122174 | 764.76 | 779 | 761 | 158.8 |
| B | 4 | 239 | 2945919 | 21713.32 | 726 | 709 | 135.6 |
| B | 15 | 204 | 251263 | 1847.19 | 726 | 709 | 135.6 |
| B | 0 | 214 | 67591 | 493.08 | 726 | 709 | 135.6 |
| C | 15 | 208 | 53132 | 294.27 | 771 | 774 | 177.9 |
| C | 14 | 234 | 8164 | 41.53 | 771 | 774 | 177.9 |
| C | 13 | 61 | 5736 | 27.89 | 771 | 774 | 177.9 |
| D | 1 | 52 | 1034187 | 5791.41 | 747 | 724 | 178.4 |
| D | 10 | 50 | 193266 | 1078.98 | 747 | 724 | 178.4 |
| D | 10 | 199 | 102592 | 570.86 | 747 | 724 | 178.4 |
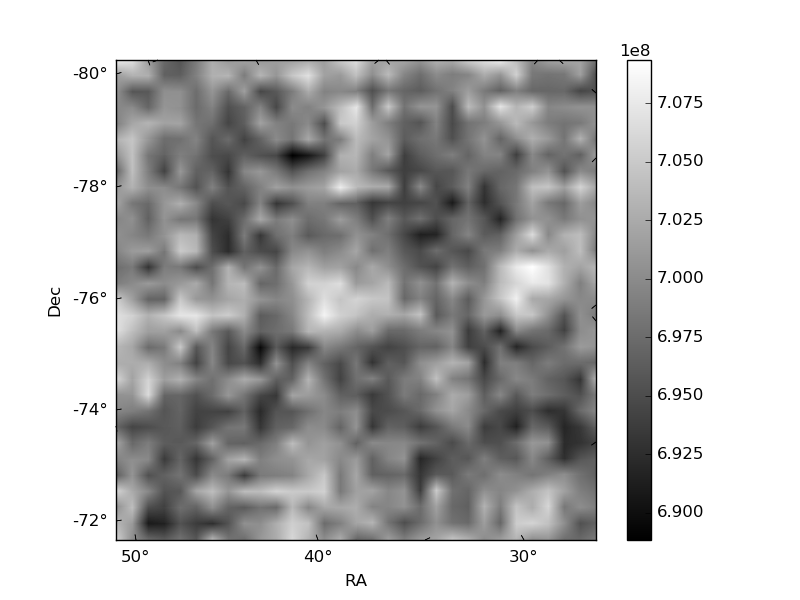
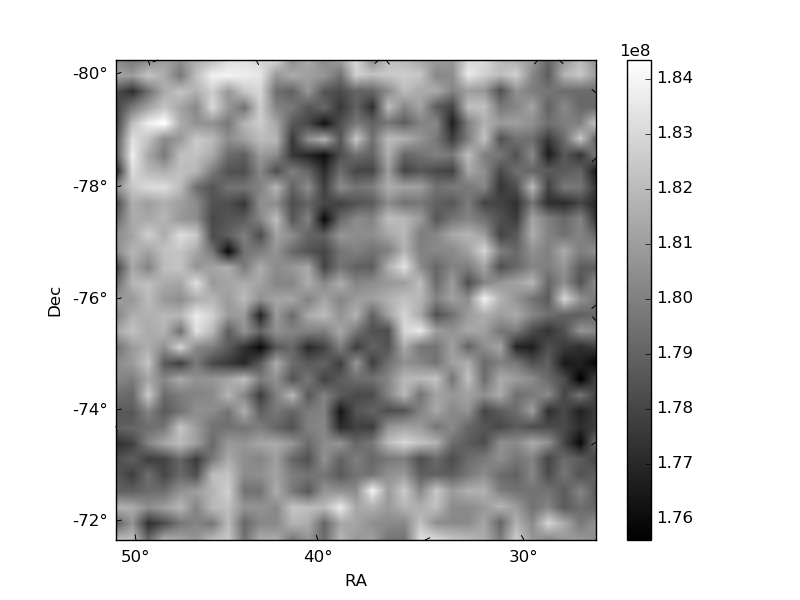
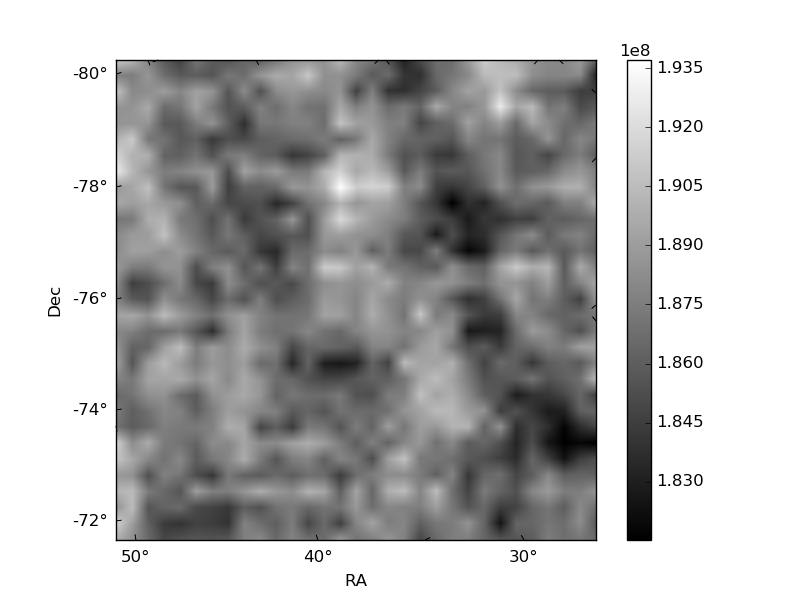
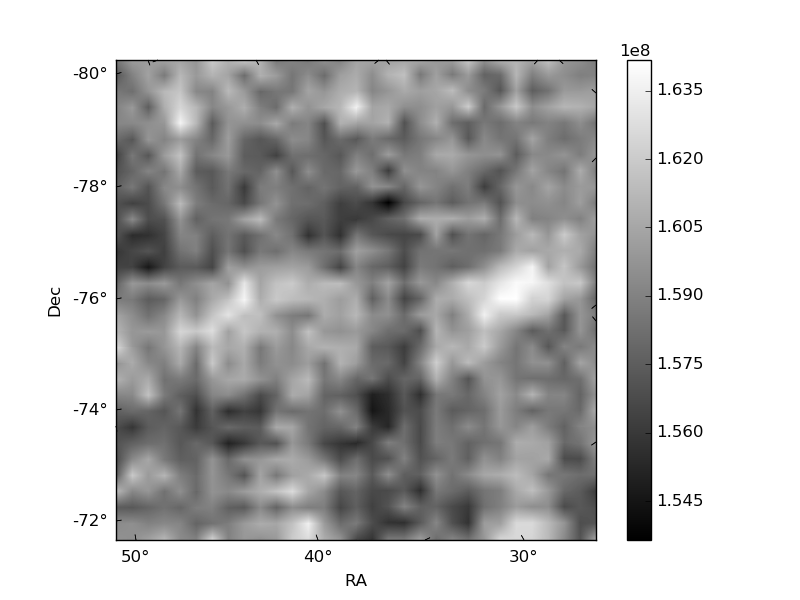
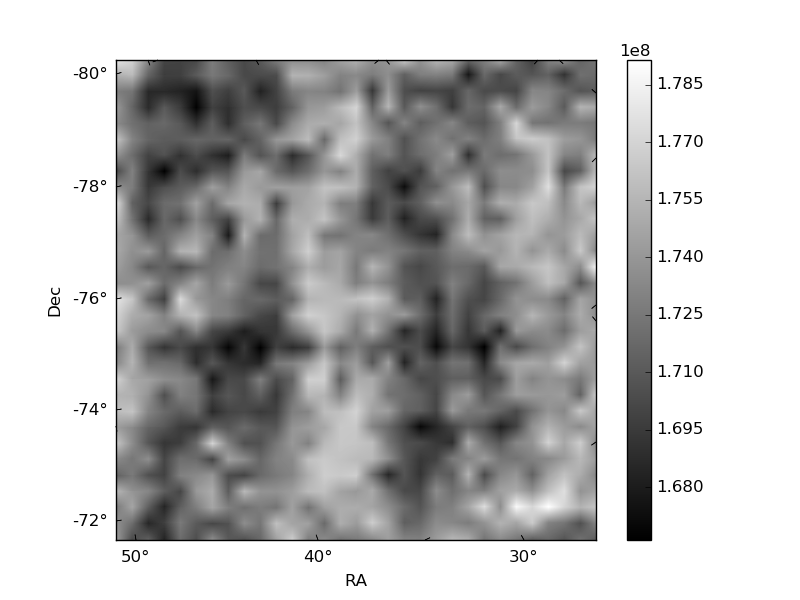
Histogram calculated using DETX and DETY for each event in the final _common_clean file
| Quadrant A | 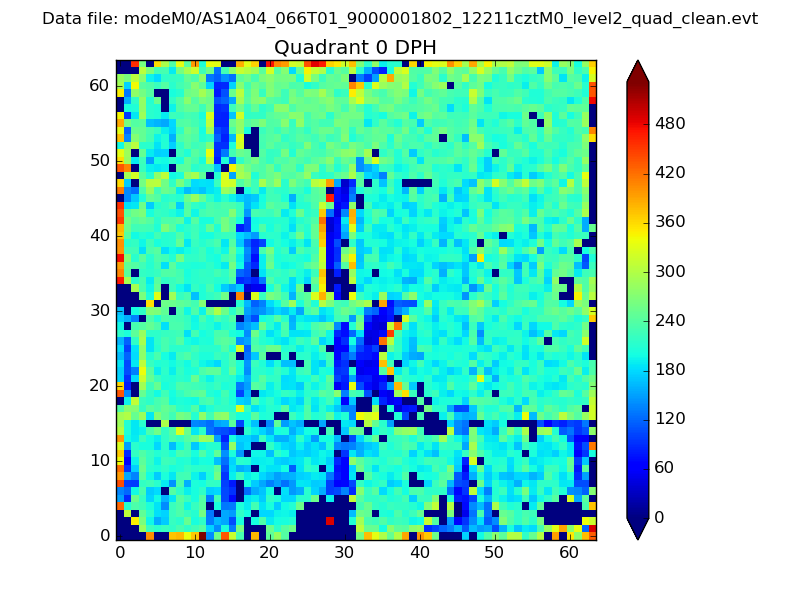 |
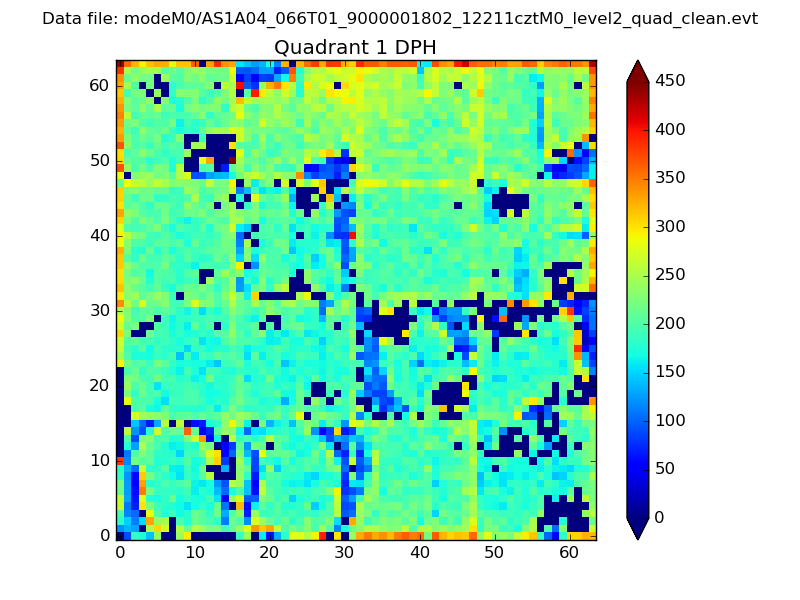 |
Quadrant B |
|---|---|---|---|
| Quadrant D | 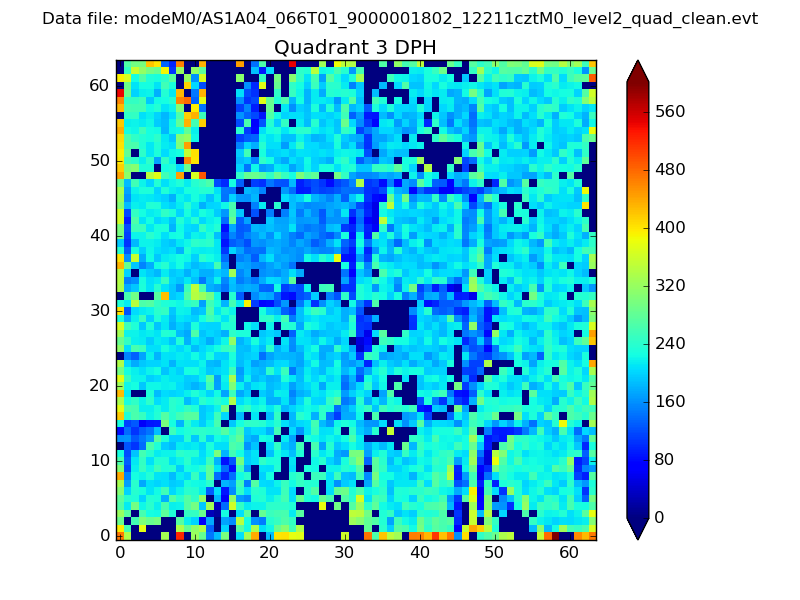 |
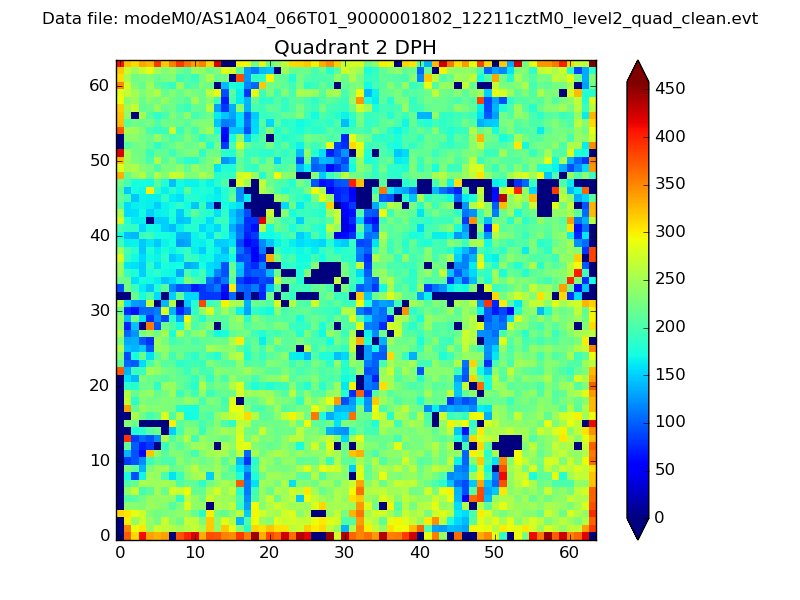 |
Quadrant C |
| Plot type | Count rate plots | Images |
|---|---|---|
| Comparison with Poisson distribution Blue bars denote a histogram of data divided into 1 sec bins. Red curve is a Poisson curve with rate = median count rate of data. |
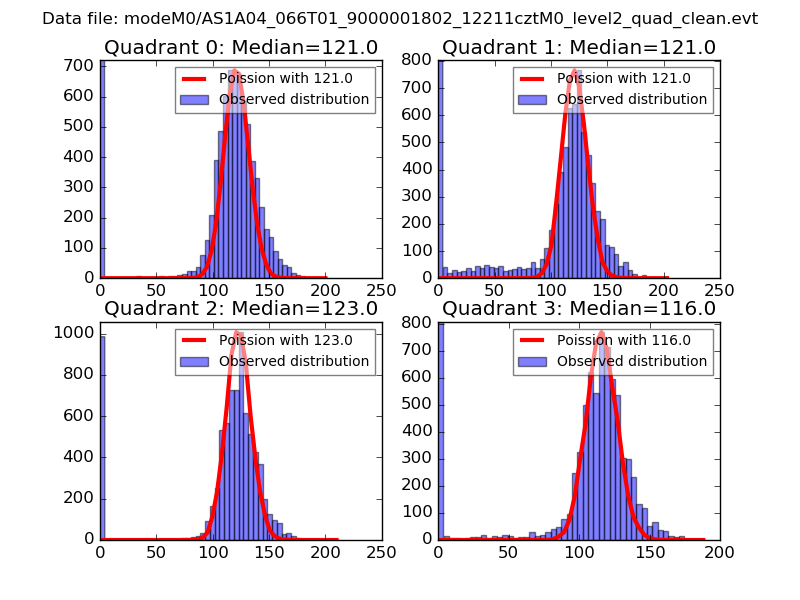 |
 |
| Quadrant-wise count rates Data is divided into 100 sec bins |
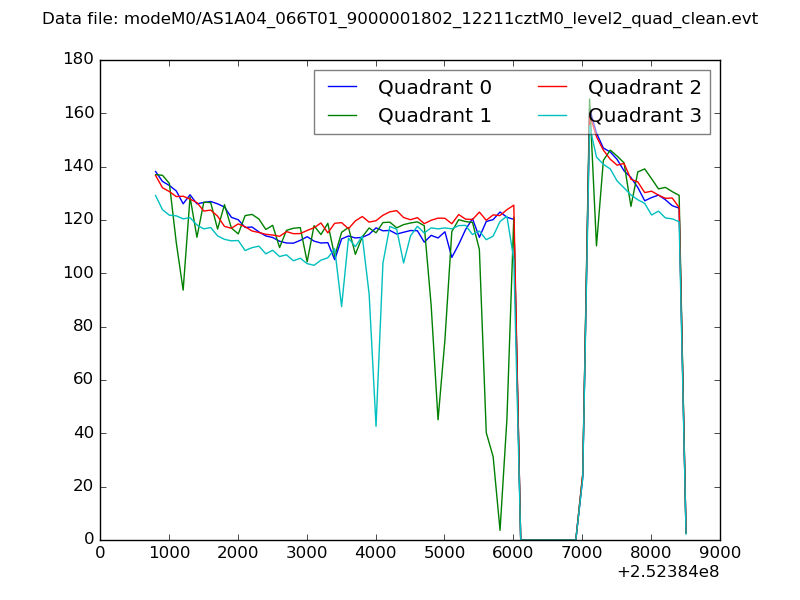 |
|
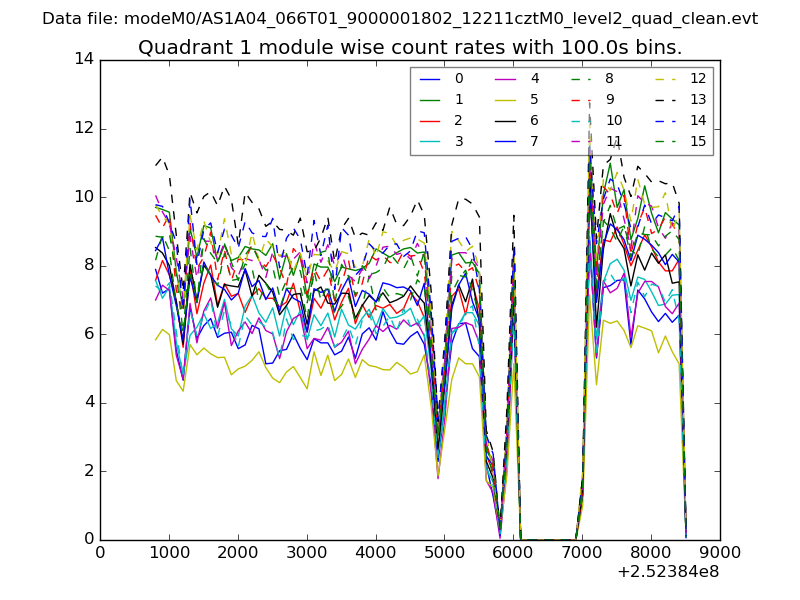
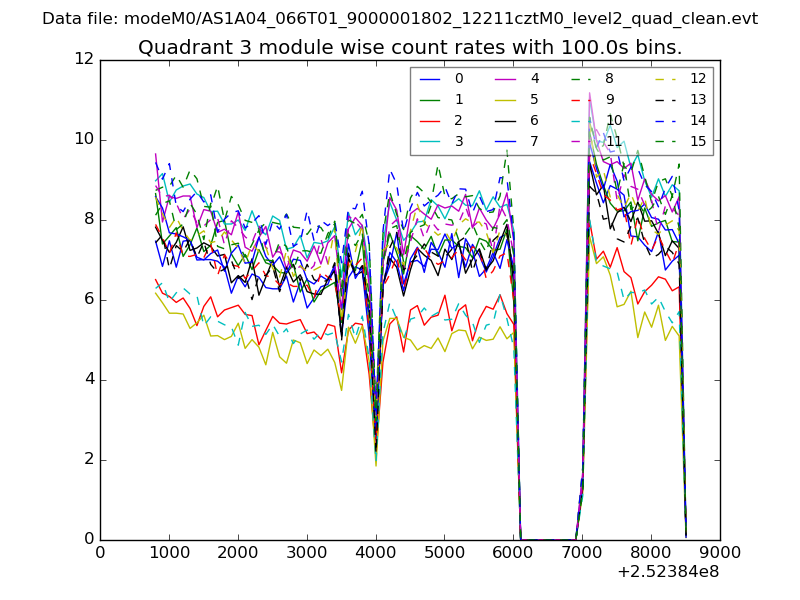
| Module-wise count rates for Quadrant A Data is divided into 100 sec bins |
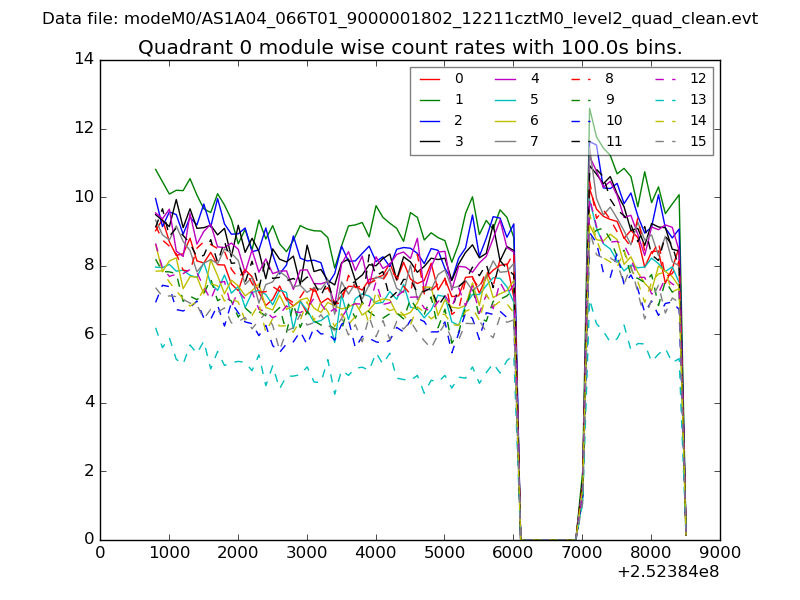 |
 |
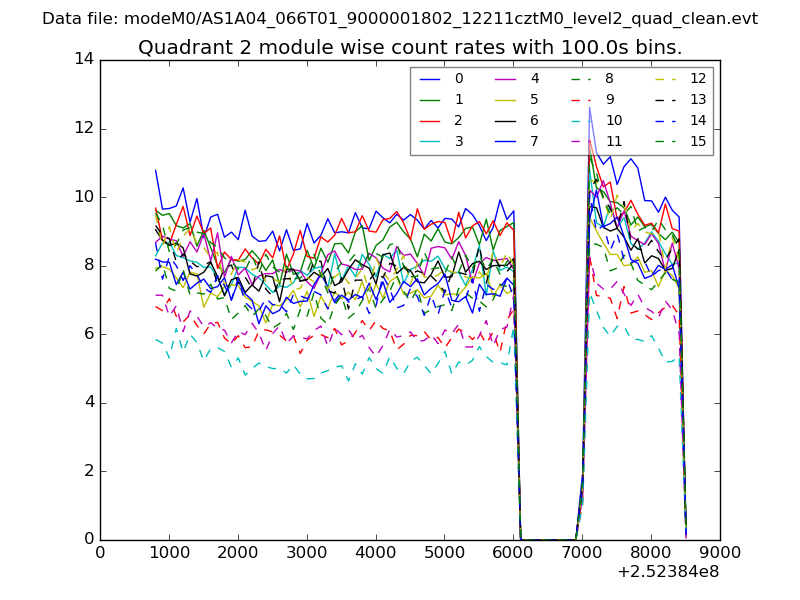
| Module-wise count rates for Quadrant B Data is divided into 100 sec bins |
 |
 |
| Module-wise count rates for Quadrant C Data is divided into 100 sec bins |
 |
 |
| Module-wise count rates for Quadrant D Data is divided into 100 sec bins |
 |
 |
| Parameter | Plot |
|---|---|
| CZT HV Monitor | 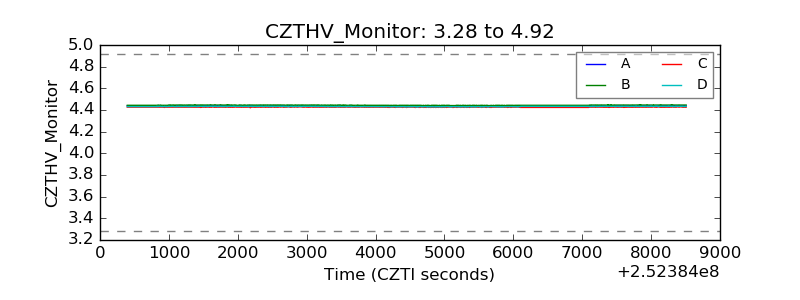 |
| D_VDD | 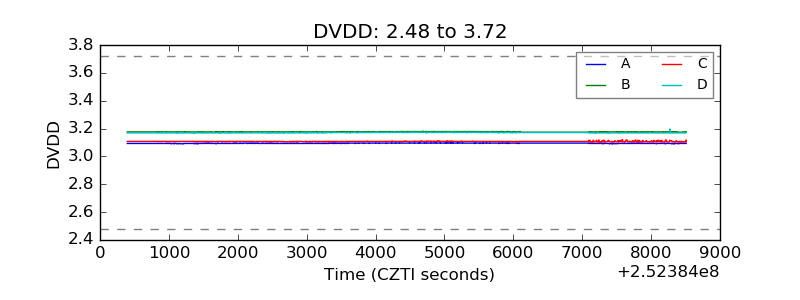 |
| Temperature 1 | 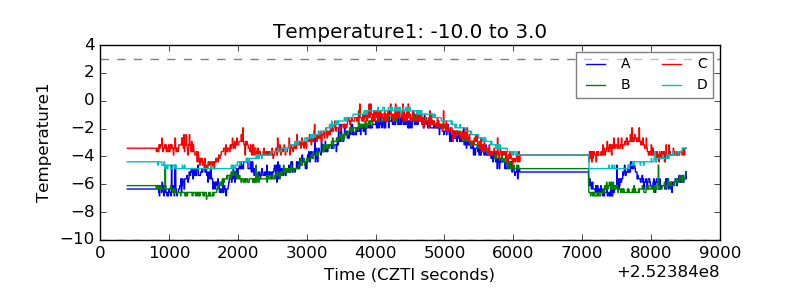 |
| Veto HV Monitor | 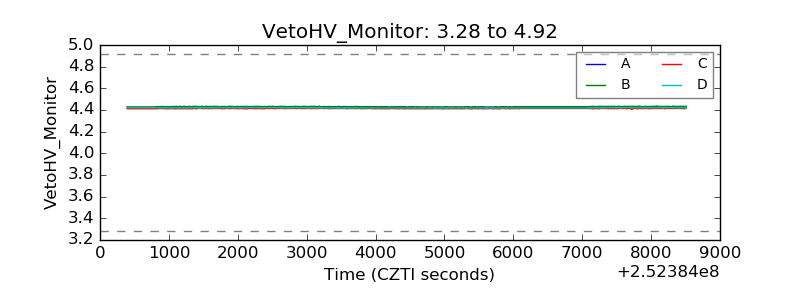 |
| Veto LLD | 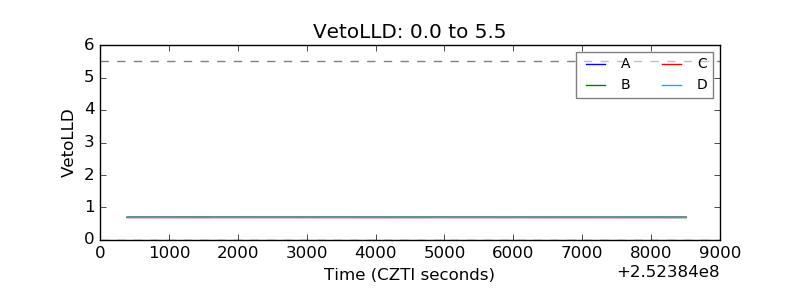 |
| Alpha Counter | 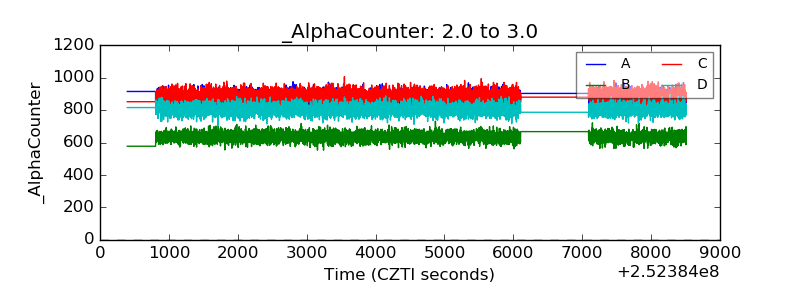 |
| _CPM_Rate | 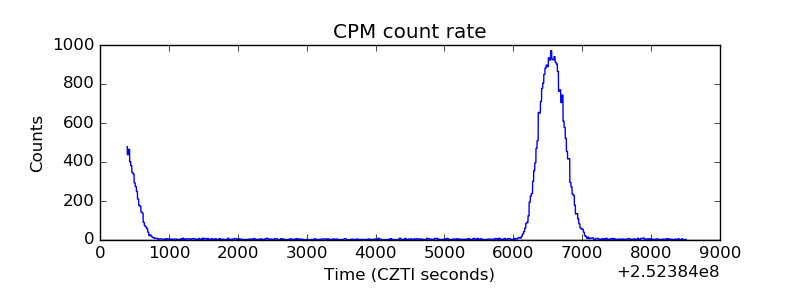 |
| CZT Counter | 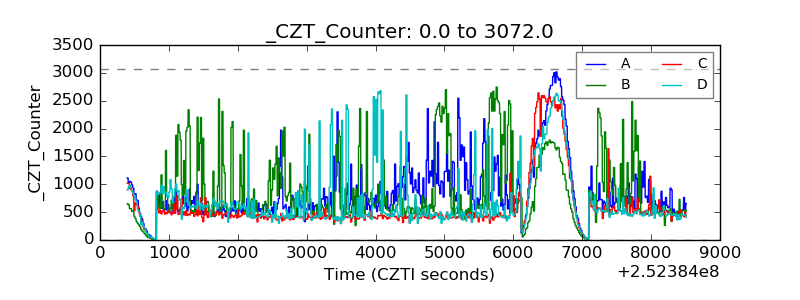 |
| +2.5 Volts monitor | 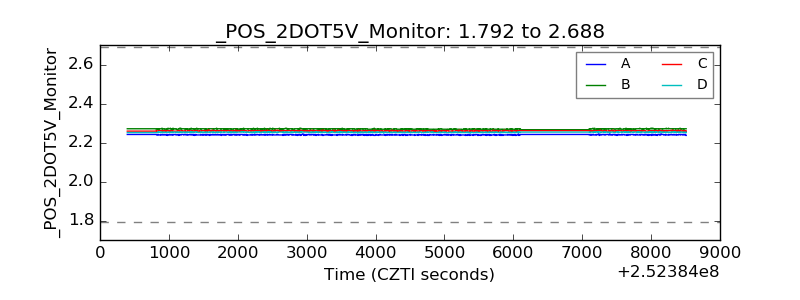 |
| +5 Volts monitor | 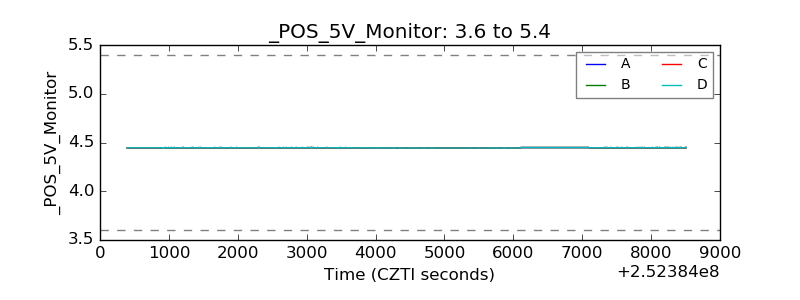 |
| _ROLL_ROT | 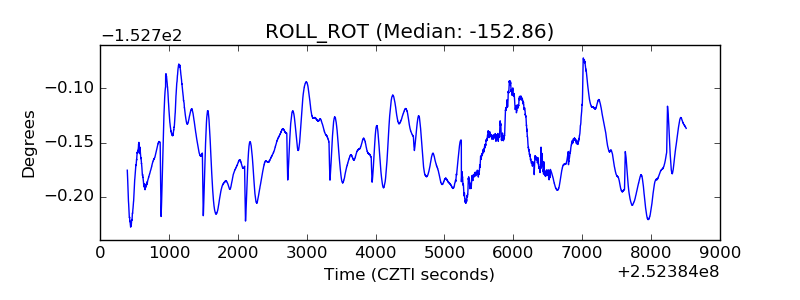 |
| _Roll_DEC | 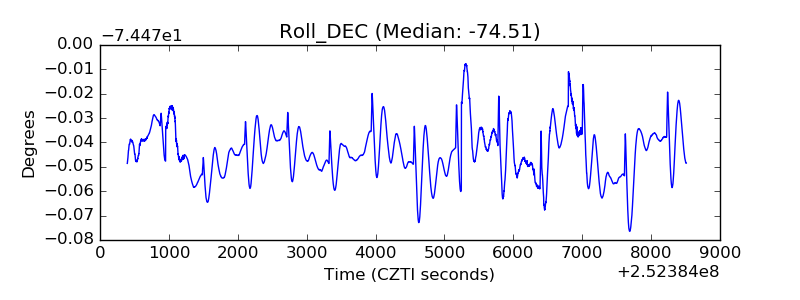 |
| _Roll_RA | 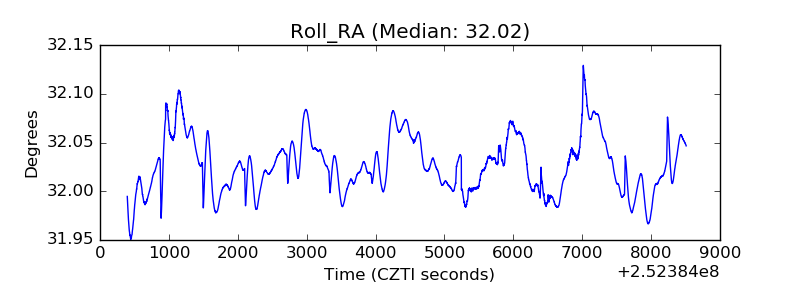 |
| Veto Counter | 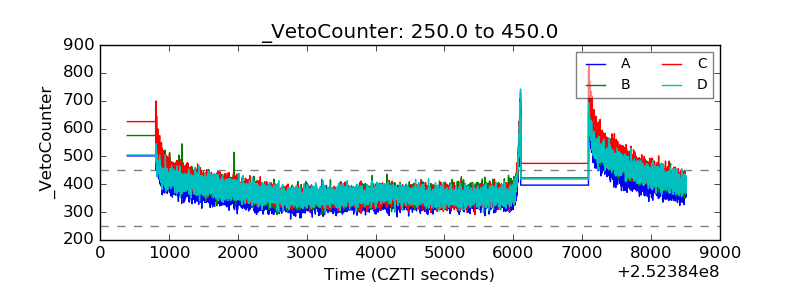 |