| Param | Original file | Final file |
|---|---|---|
| Filename | modeM0/AS1A04_066T01_9000001802_12216cztM0_level2.evt | modeM0/AS1A04_066T01_9000001802_12216cztM0_level2_quad_clean.evt |
| Size (bytes) | 1,345,294,080 | 279,659,520 |
| Size | 1.3 GB | 266.7 MB |
| Events in quadrant A | 11,509,211 | 1,894,039 |
| Events in quadrant B | 13,205,095 | 1,797,440 |
| Events in quadrant C | 6,915,632 | 1,943,181 |
| Events in quadrant D | 8,151,461 | 1,850,792 |
| Mode SS | |||
|---|---|---|---|
| Quadrant | BADHDUFLAG | Total packets | Discarded packets |
| A | 0 | 294 | 5 |
| B | 0 | 296 | 6 |
| C | 0 | 296 | 8 |
| D | 0 | 296 | 12 |
| Mode M0 | |||
|---|---|---|---|
| Quadrant | BADHDUFLAG | Total packets | Discarded packets |
| A | 0 | 45732 | 1513 |
| B | 0 | 51182 | 2410 |
| C | 0 | 31086 | 812 |
| D | 0 | 34800 | 851 |
| Mode M9 | |||
|---|---|---|---|
| Quadrant | BADHDUFLAG | Total packets | Discarded packets |
| A | 0 | 24 | 0 |
| B | 0 | 24 | 0 |
| C | 0 | 24 | 0 |
| D | 0 | 24 | 0 |
| Quadrant | Total seconds | Saturated seconds | Saturation percentage |
|---|---|---|---|
| A | 14243 | 681 | 4.781296% |
| B | 14186 | 1957 | 13.795291% |
| C | 14314 | 144 | 1.006008% |
| D | 14321 | 381 | 2.660429% |
Noise dominated data is calculated using 1-second bins in cleaned event files. If a bin has >2000 counts, and if more than 50% of those come from <1% of pixels, then it is considered to be noise-dominated and hence unusable.
| Quadrant | # 1 sec bins | Bins with >0 counts | Bins with >2000 counts | High rate bins dominated by noise | Noise dominated (total time) | Noise dominated (detector-on time) | Marked lightcurve |
|---|---|---|---|---|---|---|---|
| A | 25852 | 14421 | 304 | 304 | 1.18% | 2.11% | 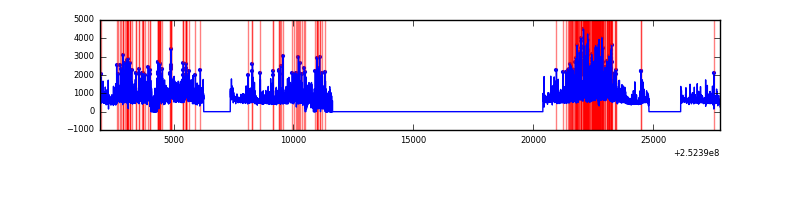 |
| B | 25852 | 14342 | 1117 | 1117 | 4.32% | 7.79% | 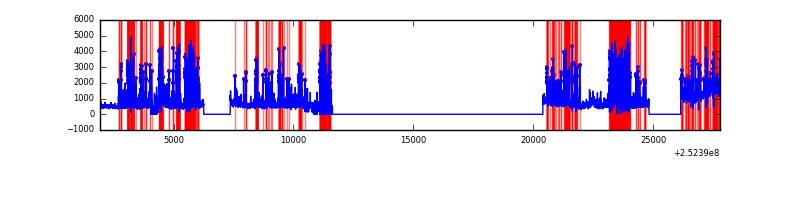 |
| C | 25852 | 14487 | 19 | 19 | 0.07% | 0.13% | 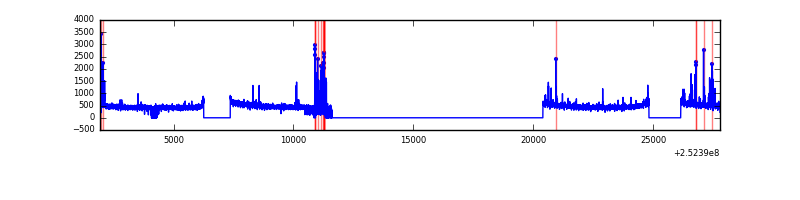 |
| D | 25851 | 14483 | 192 | 192 | 0.74% | 1.33% | 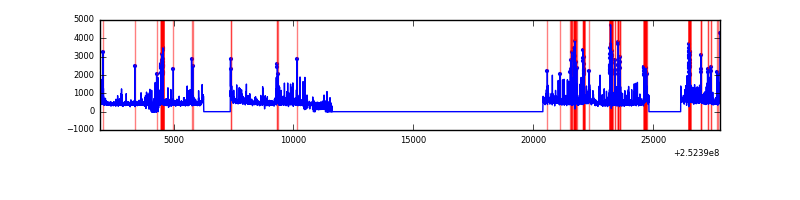 |
Top three noisy pixels from each quadrant. If the there are fewer than three noisy pixels in the level2.evt file, extra rows are filled as -1
| Pixel properties | Quadrant properties | ||||||
|---|---|---|---|---|---|---|---|
| Quadrant | DetID | PixID | Counts | Sigma | Mean | Median | Sigma |
| A | 13 | 251 | 3760851 | 10993.33 | 1717 | 1686 | 341.9 |
| A | 1 | 162 | 322717 | 938.83 | 1717 | 1686 | 341.9 |
| A | 8 | 15 | 212498 | 616.5 | 1717 | 1686 | 341.9 |
| B | 4 | 239 | 3838216 | 13079.58 | 1614 | 1579 | 293.3 |
| B | 4 | 206 | 1185075 | 4034.69 | 1614 | 1579 | 293.3 |
| B | 3 | 64 | 596342 | 2027.62 | 1614 | 1579 | 293.3 |
| C | 15 | 208 | 274197 | 713.2 | 1681 | 1692 | 382.1 |
| C | 4 | 175 | 45183 | 113.82 | 1681 | 1692 | 382.1 |
| C | 3 | 233 | 20111 | 48.21 | 1681 | 1692 | 382.1 |
| D | 10 | 199 | 423985 | 1069.07 | 1679 | 1633 | 395.1 |
| D | 13 | 104 | 393677 | 992.35 | 1679 | 1633 | 395.1 |
| D | 10 | 157 | 203246 | 510.33 | 1679 | 1633 | 395.1 |
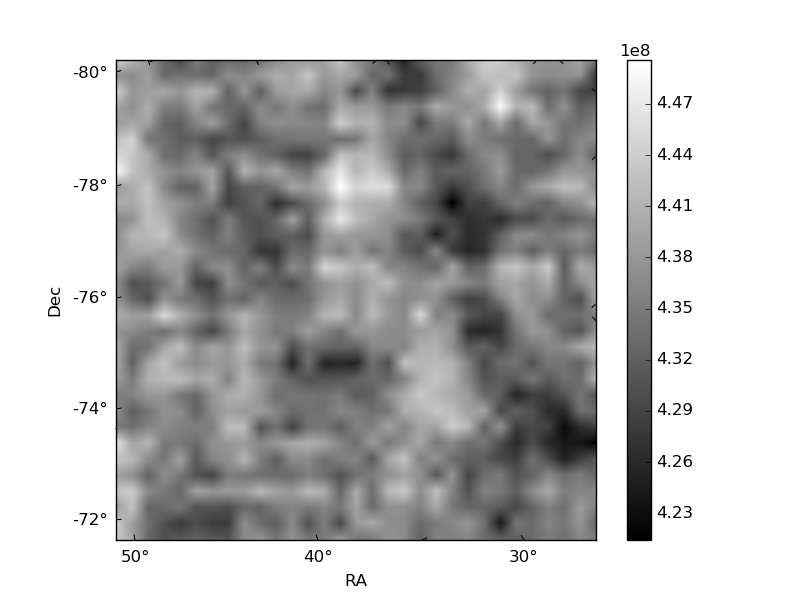
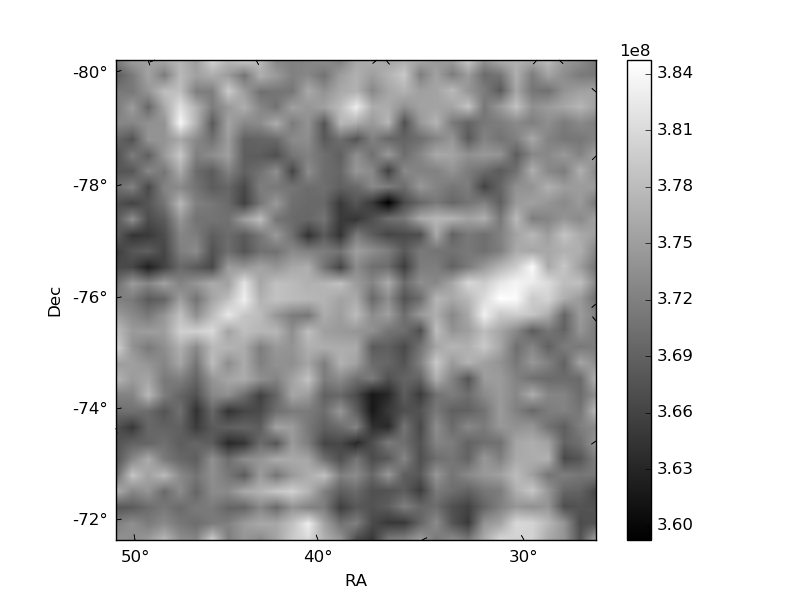
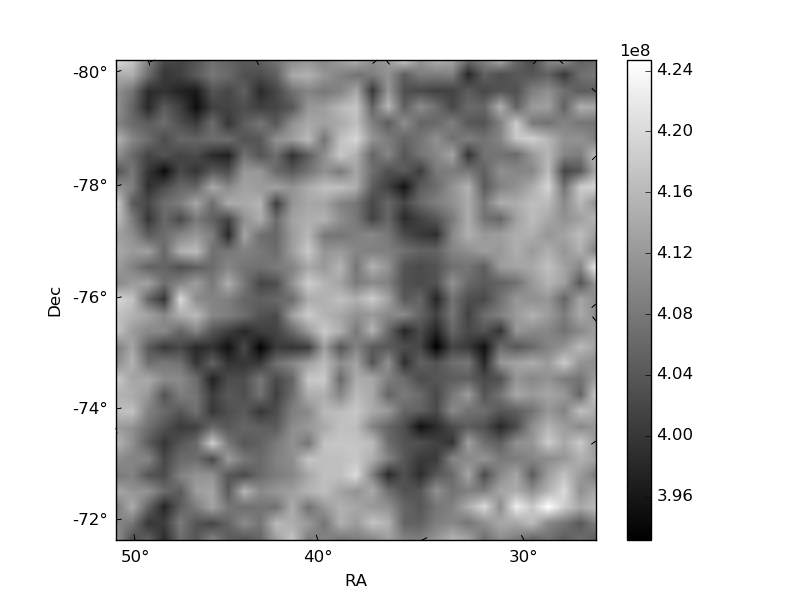
Histogram calculated using DETX and DETY for each event in the final _common_clean file
| Quadrant A | 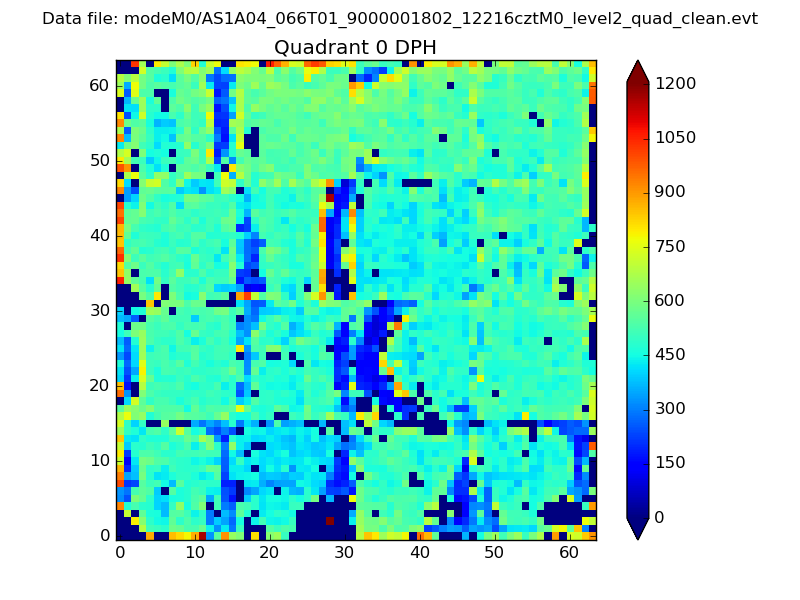 |
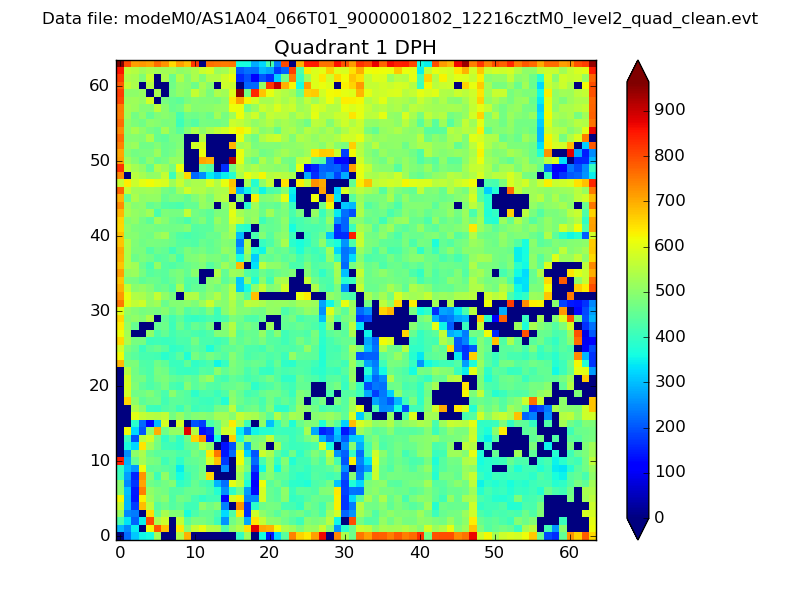 |
Quadrant B |
|---|---|---|---|
| Quadrant D | 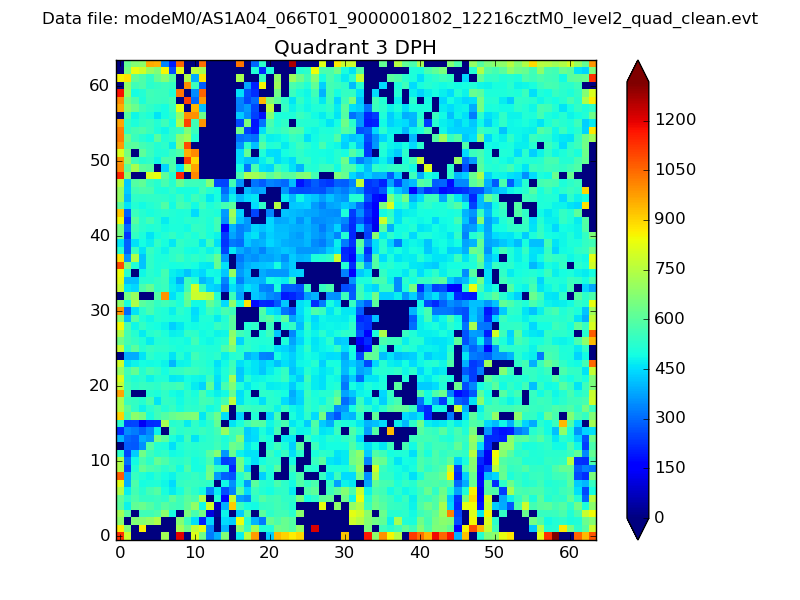 |
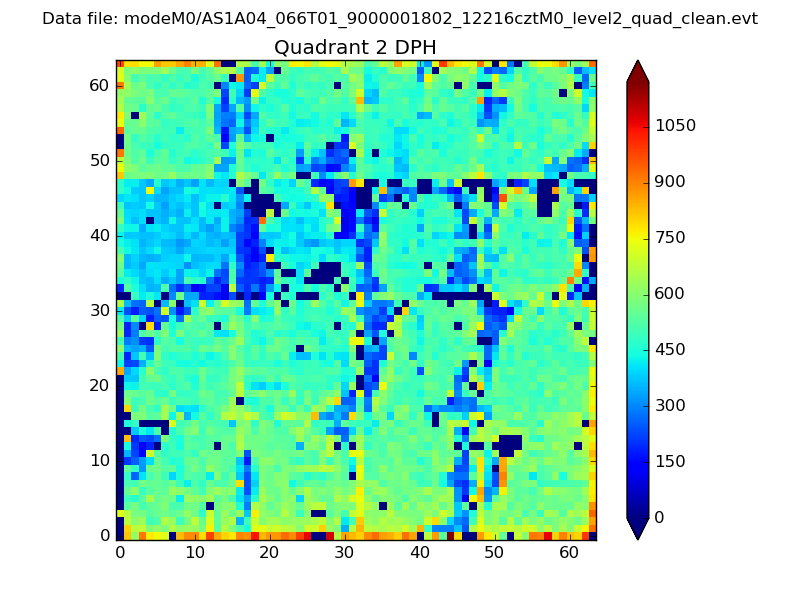 |
Quadrant C |
| Plot type | Count rate plots | Images |
|---|---|---|
| Comparison with Poisson distribution Blue bars denote a histogram of data divided into 1 sec bins. Red curve is a Poisson curve with rate = median count rate of data. |
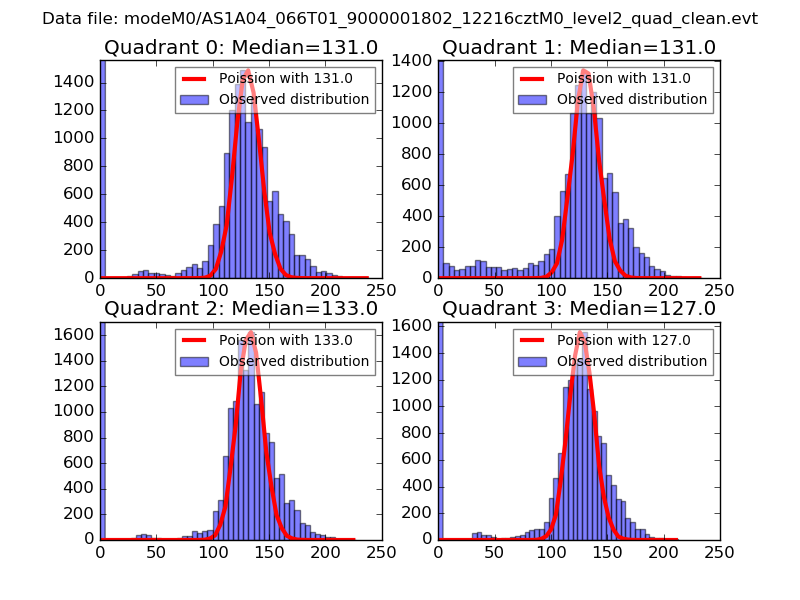 |
 |
| Quadrant-wise count rates Data is divided into 100 sec bins |
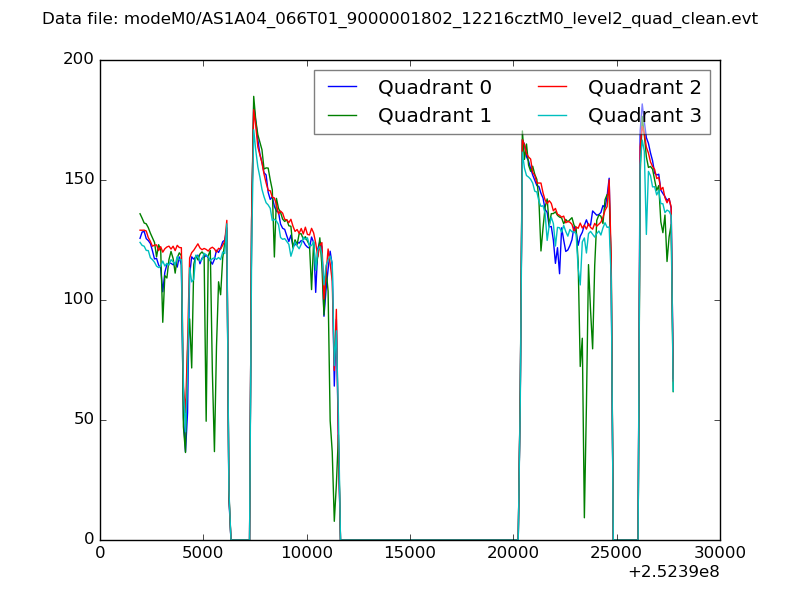 |
|
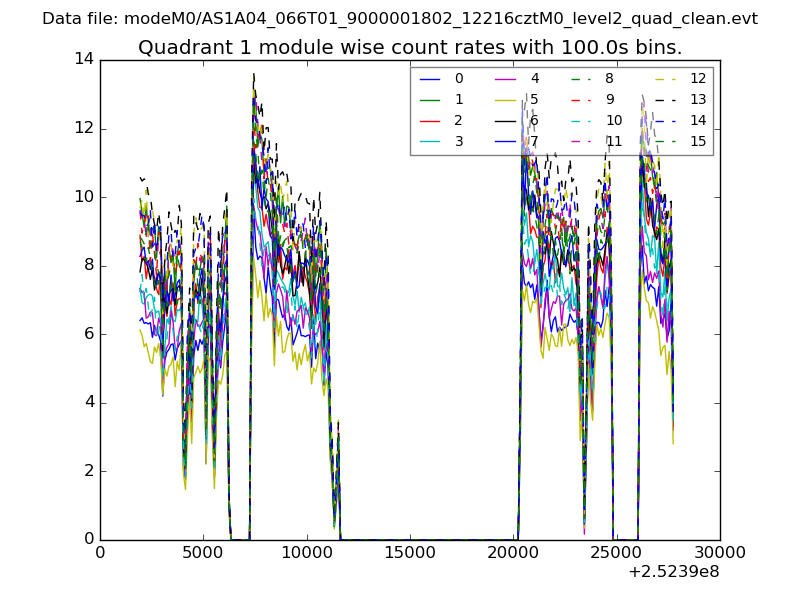
| Module-wise count rates for Quadrant A Data is divided into 100 sec bins |
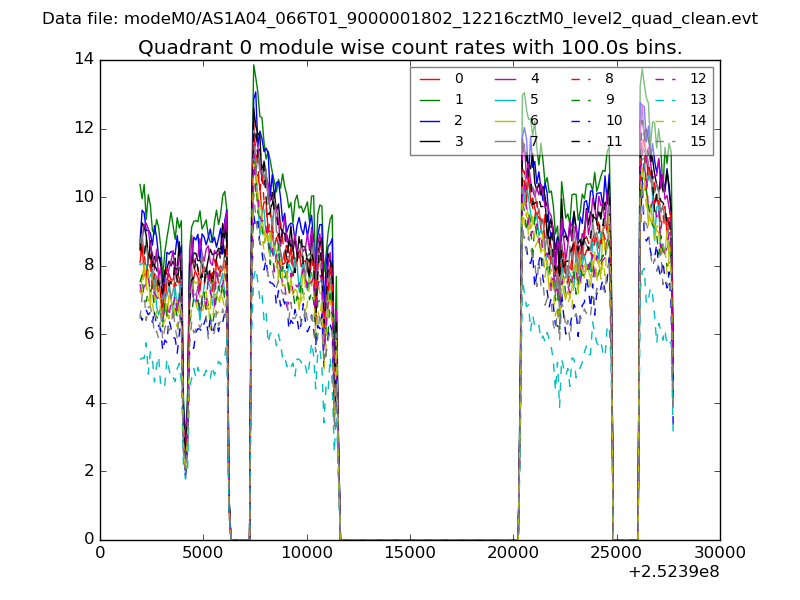 |
 |
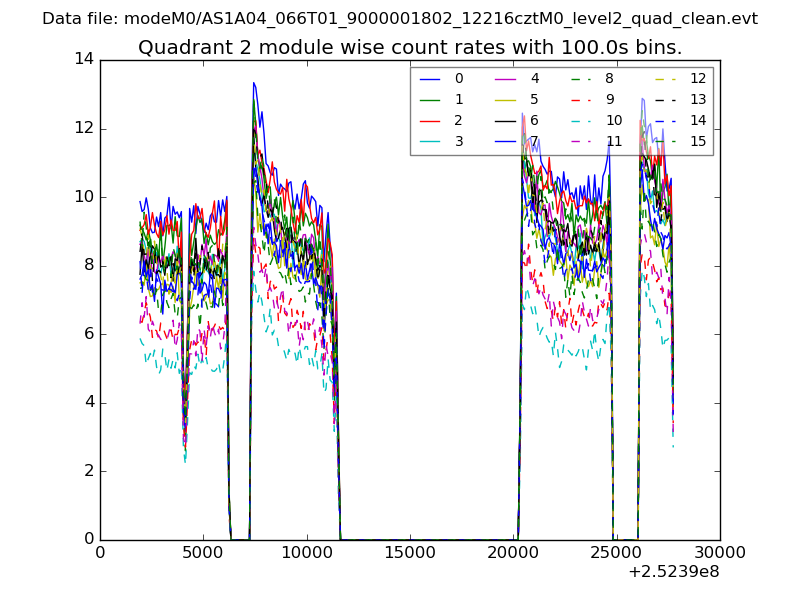
| Module-wise count rates for Quadrant B Data is divided into 100 sec bins |
 |
 |
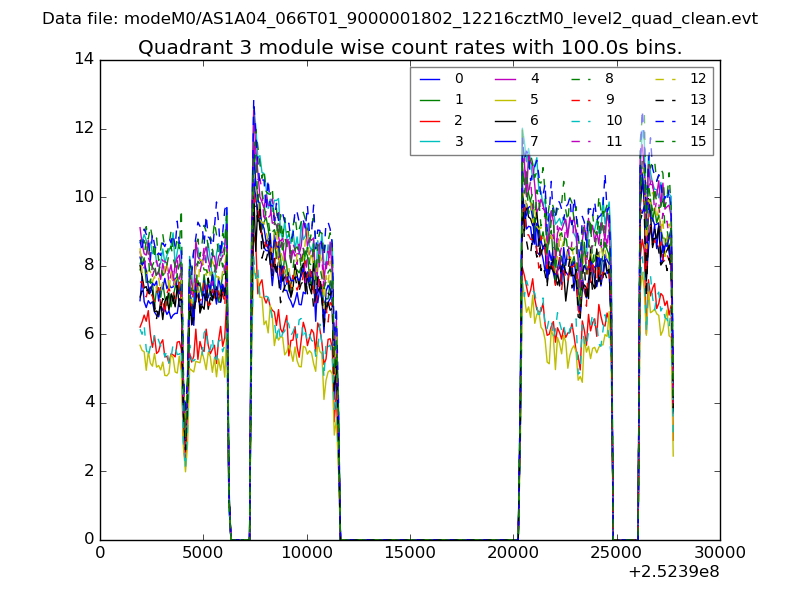
| Module-wise count rates for Quadrant C Data is divided into 100 sec bins |
 |
 |
| Module-wise count rates for Quadrant D Data is divided into 100 sec bins |
 |
 |
| Parameter | Plot |
|---|---|
| CZT HV Monitor | 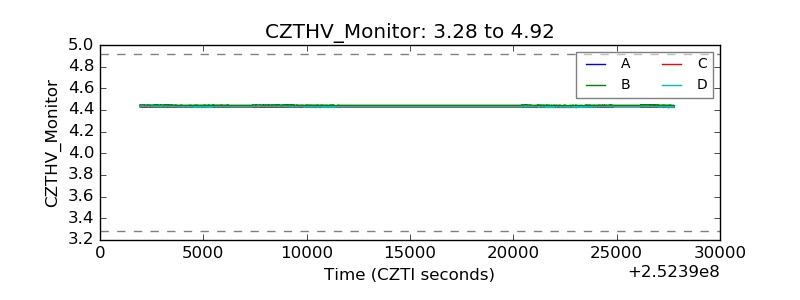 |
| D_VDD | 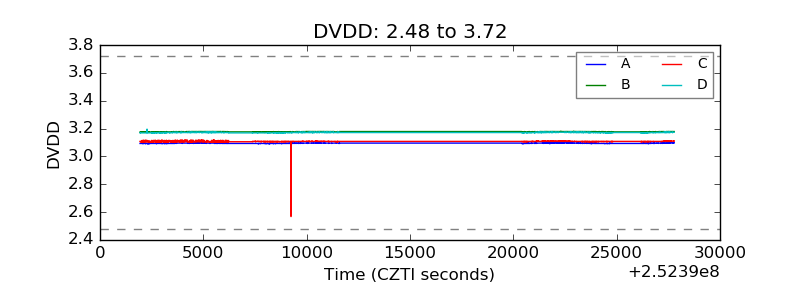 |
| Temperature 1 | 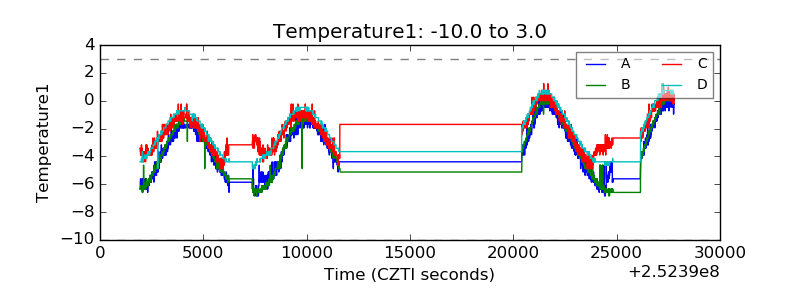 |
| Veto HV Monitor | 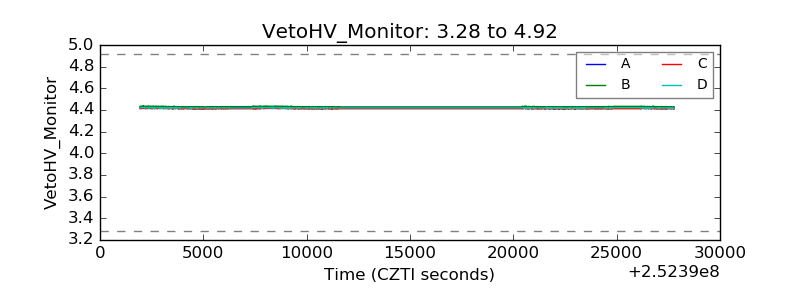 |
| Veto LLD | 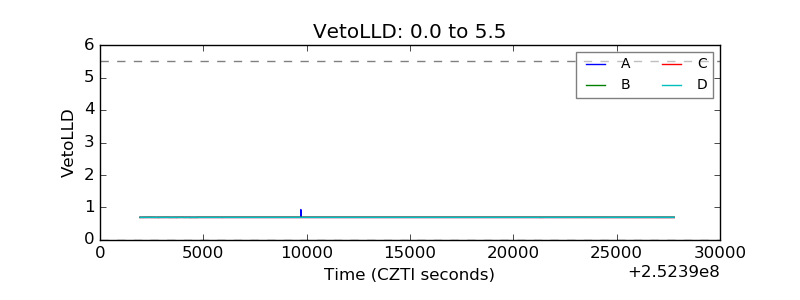 |
| Alpha Counter | 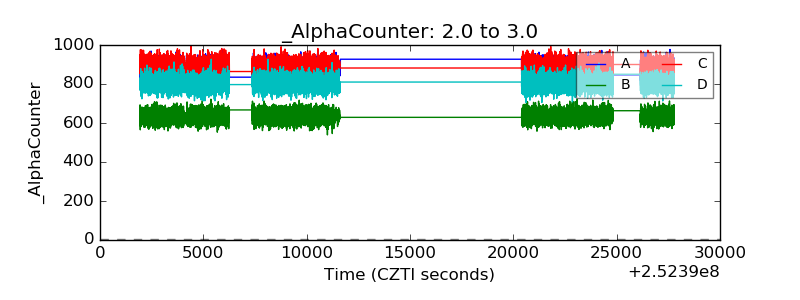 |
| _CPM_Rate | 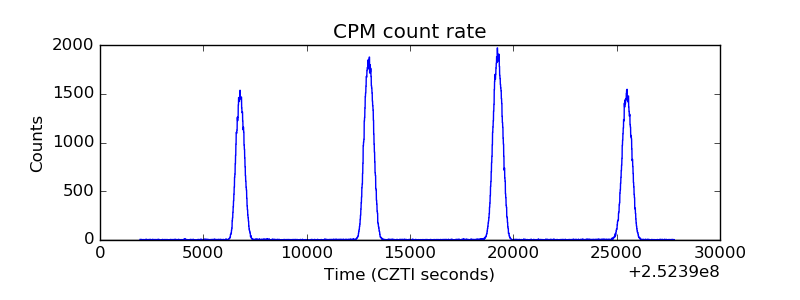 |
| CZT Counter | 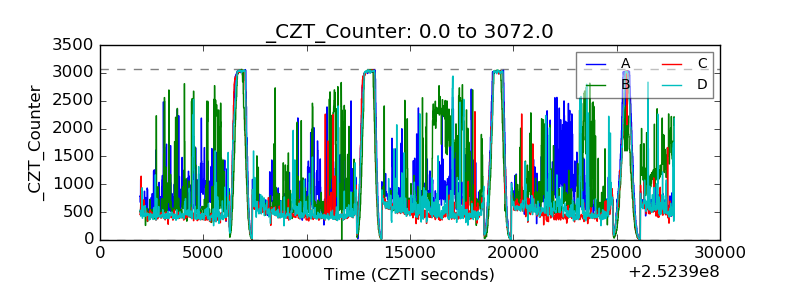 |
| +2.5 Volts monitor |  |
| +5 Volts monitor |  |
| _ROLL_ROT | 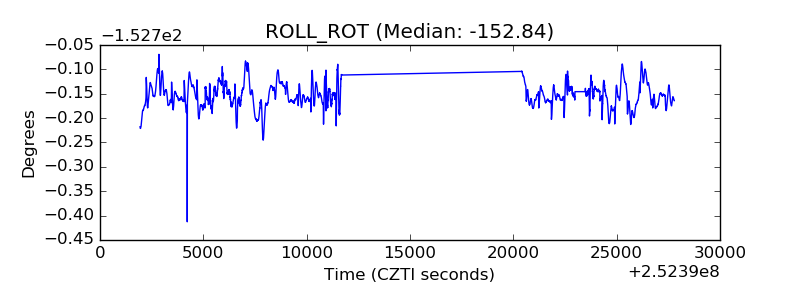 |
| _Roll_DEC | 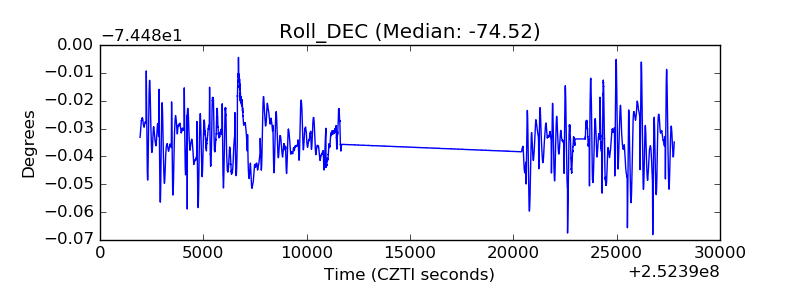 |
| _Roll_RA | 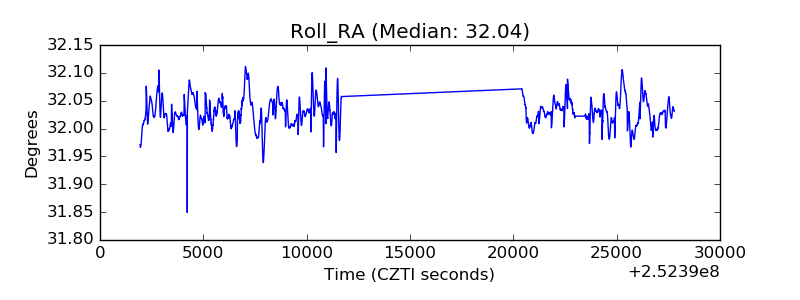 |
| Veto Counter | 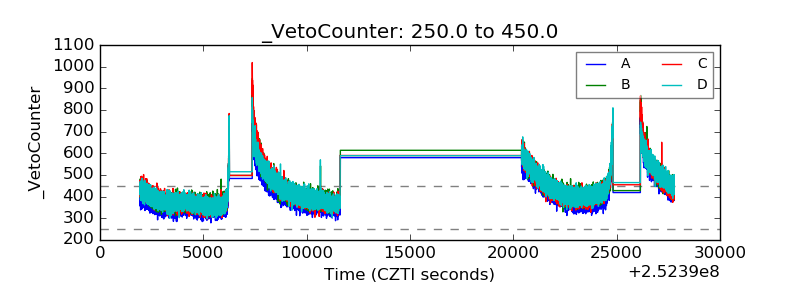 |