| Param | Original file | Final file |
|---|---|---|
| Filename | modeM0/AS1A04_066T01_9000001802_12217cztM0_level2.evt | modeM0/AS1A04_066T01_9000001802_12217cztM0_level2_quad_clean.evt |
| Size (bytes) | 2,509,617,600 | 510,776,640 |
| Size | 2.3 GB | 487.1 MB |
| Events in quadrant A | 20,128,415 | 3,507,996 |
| Events in quadrant B | 26,211,480 | 3,264,831 |
| Events in quadrant C | 12,681,307 | 3,546,757 |
| Events in quadrant D | 15,242,660 | 3,370,830 |
| Mode SS | |||
|---|---|---|---|
| Quadrant | BADHDUFLAG | Total packets | Discarded packets |
| A | 0 | 530 | 0 |
| B | 0 | 530 | 0 |
| C | 0 | 530 | 0 |
| D | 0 | 530 | 0 |
| Mode M0 | |||
|---|---|---|---|
| Quadrant | BADHDUFLAG | Total packets | Discarded packets |
| A | 0 | 77933 | 6 |
| B | 0 | 95867 | 5 |
| C | 0 | 55318 | 5 |
| D | 0 | 62887 | 5 |
| Mode M9 | |||
|---|---|---|---|
| Quadrant | BADHDUFLAG | Total packets | Discarded packets |
| A | 0 | 61 | 0 |
| B | 0 | 61 | 0 |
| C | 0 | 61 | 0 |
| D | 0 | 61 | 0 |
| Quadrant | Total seconds | Saturated seconds | Saturation percentage |
|---|---|---|---|
| A | 25866 | 1216 | 4.701152% |
| B | 25866 | 4576 | 17.691178% |
| C | 25866 | 311 | 1.202351% |
| D | 25866 | 831 | 3.212712% |
Noise dominated data is calculated using 1-second bins in cleaned event files. If a bin has >2000 counts, and if more than 50% of those come from <1% of pixels, then it is considered to be noise-dominated and hence unusable.
| Quadrant | # 1 sec bins | Bins with >0 counts | Bins with >2000 counts | High rate bins dominated by noise | Noise dominated (total time) | Noise dominated (detector-on time) | Marked lightcurve |
|---|---|---|---|---|---|---|---|
| A | 32077 | 25872 | 470 | 470 | 1.47% | 1.82% |  |
| B | 32077 | 25872 | 2805 | 2805 | 8.74% | 10.84% |  |
| C | 32077 | 25872 | 44 | 44 | 0.14% | 0.17% | 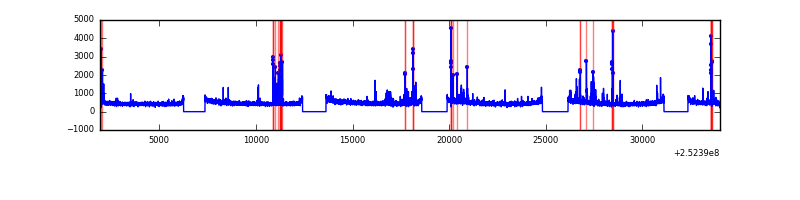 |
| D | 32077 | 25872 | 418 | 418 | 1.30% | 1.62% | 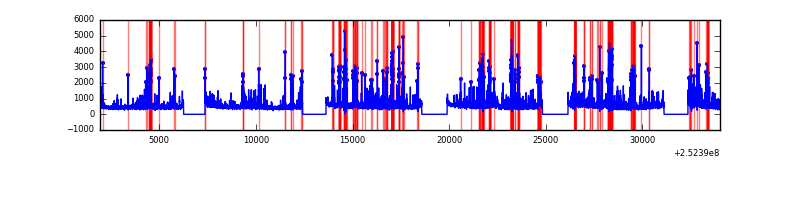 |
Top three noisy pixels from each quadrant. If the there are fewer than three noisy pixels in the level2.evt file, extra rows are filled as -1
| Pixel properties | Quadrant properties | ||||||
|---|---|---|---|---|---|---|---|
| Quadrant | DetID | PixID | Counts | Sigma | Mean | Median | Sigma |
| A | 13 | 251 | 5489668 | 8769.16 | 3156 | 3101 | 625.7 |
| A | 1 | 162 | 649047 | 1032.41 | 3156 | 3101 | 625.7 |
| A | 1 | 178 | 370345 | 586.96 | 3156 | 3101 | 625.7 |
| B | 4 | 239 | 7465973 | 14142.75 | 2940 | 2879 | 527.7 |
| B | 4 | 206 | 3990595 | 7556.82 | 2940 | 2879 | 527.7 |
| B | 15 | 204 | 866338 | 1636.28 | 2940 | 2879 | 527.7 |
| C | 15 | 208 | 491070 | 701.47 | 3068 | 3086 | 695.7 |
| C | 4 | 175 | 100648 | 140.24 | 3068 | 3086 | 695.7 |
| C | 0 | 207 | 64808 | 88.72 | 3068 | 3086 | 695.7 |
| D | 10 | 199 | 925140 | 1282.87 | 3056 | 2973 | 718.8 |
| D | 13 | 104 | 606741 | 839.93 | 3056 | 2973 | 718.8 |
| D | 1 | 52 | 338899 | 467.32 | 3056 | 2973 | 718.8 |
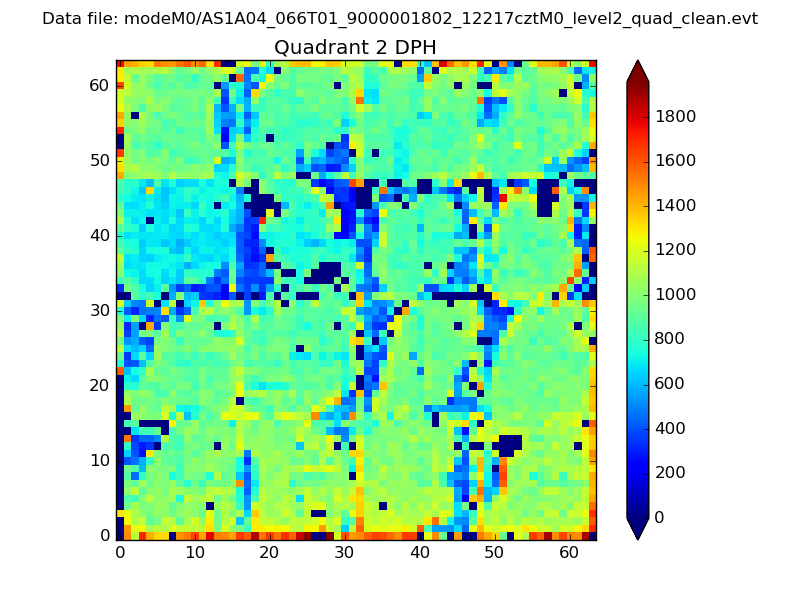
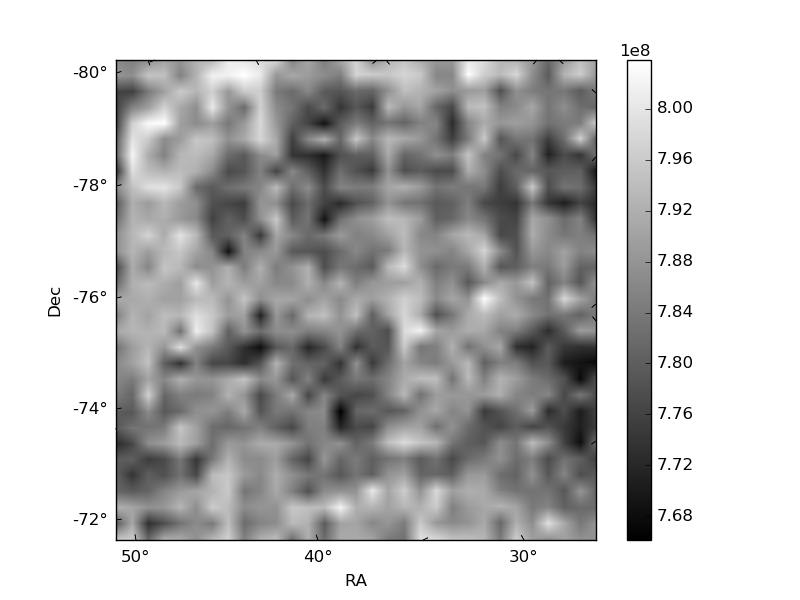
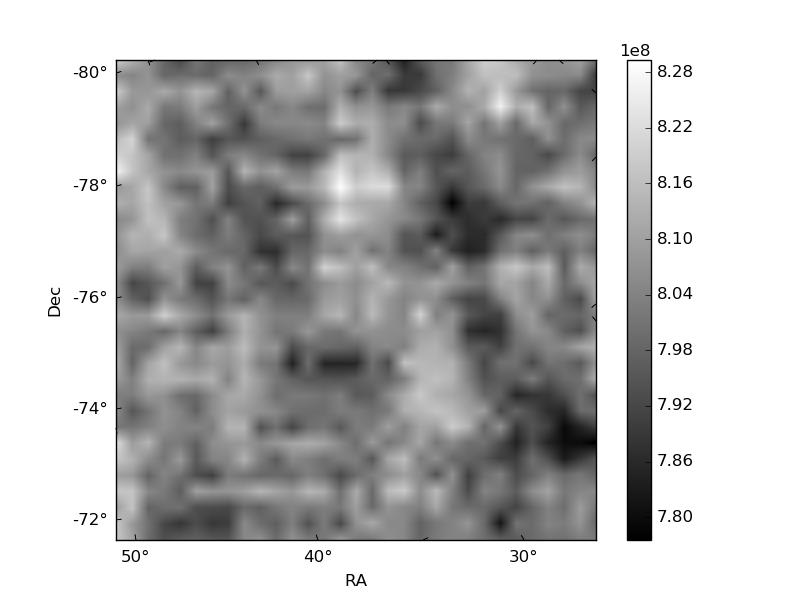
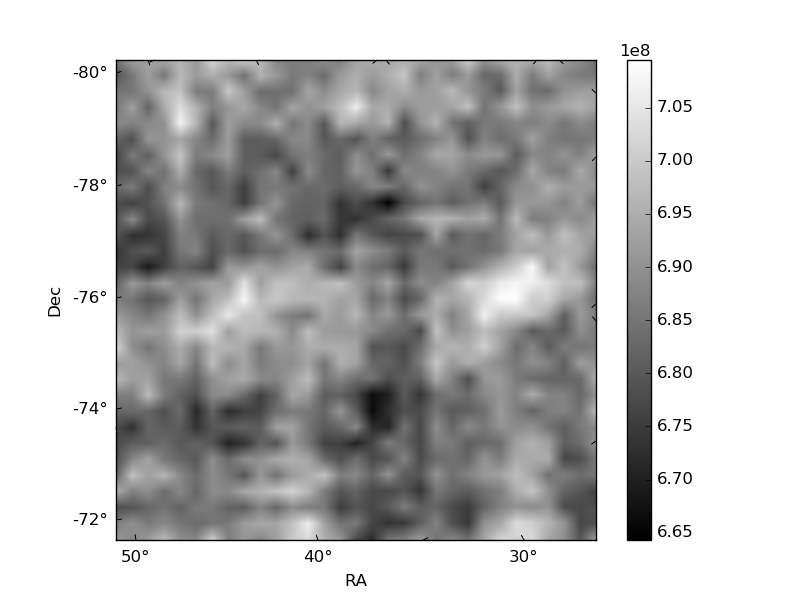
Histogram calculated using DETX and DETY for each event in the final _common_clean file
| Quadrant A | 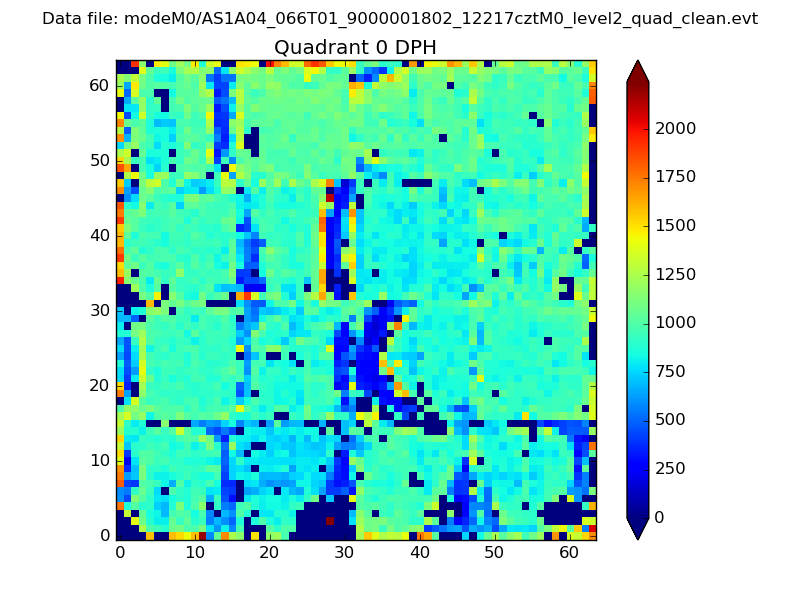 |
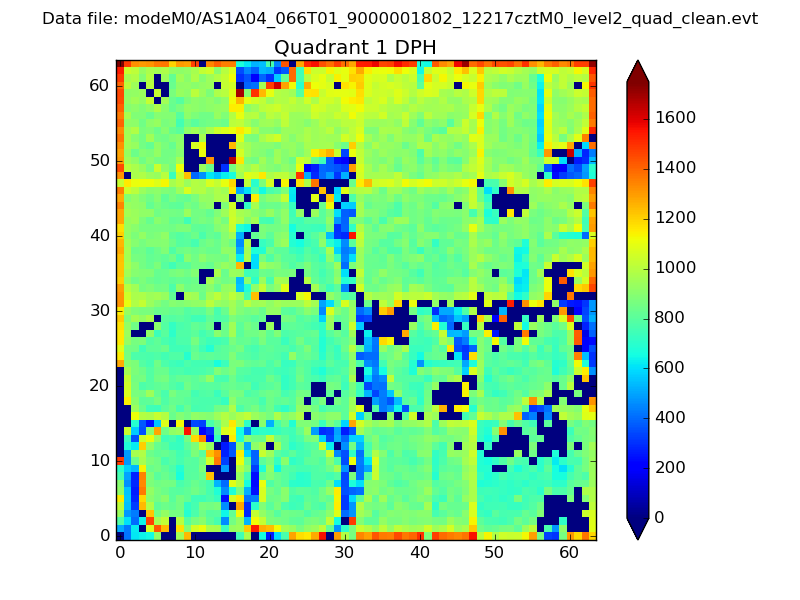 |
Quadrant B |
|---|---|---|---|
| Quadrant D | 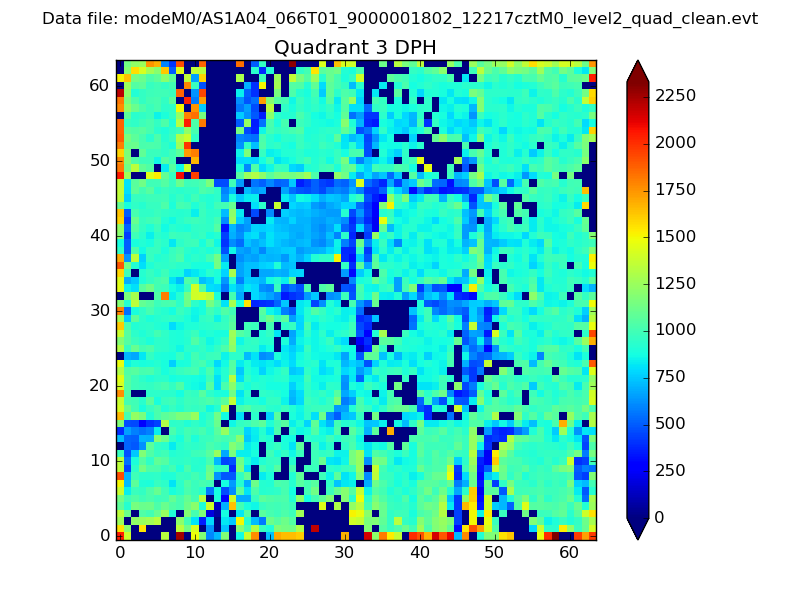 |
 |
Quadrant C |
| Plot type | Count rate plots | Images |
|---|---|---|
| Comparison with Poisson distribution Blue bars denote a histogram of data divided into 1 sec bins. Red curve is a Poisson curve with rate = median count rate of data. |
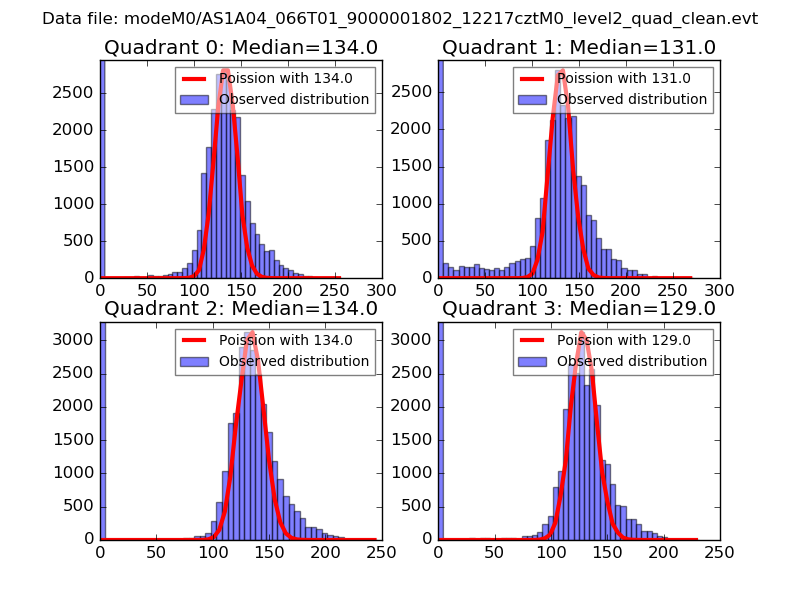 |
 |
| Quadrant-wise count rates Data is divided into 100 sec bins |
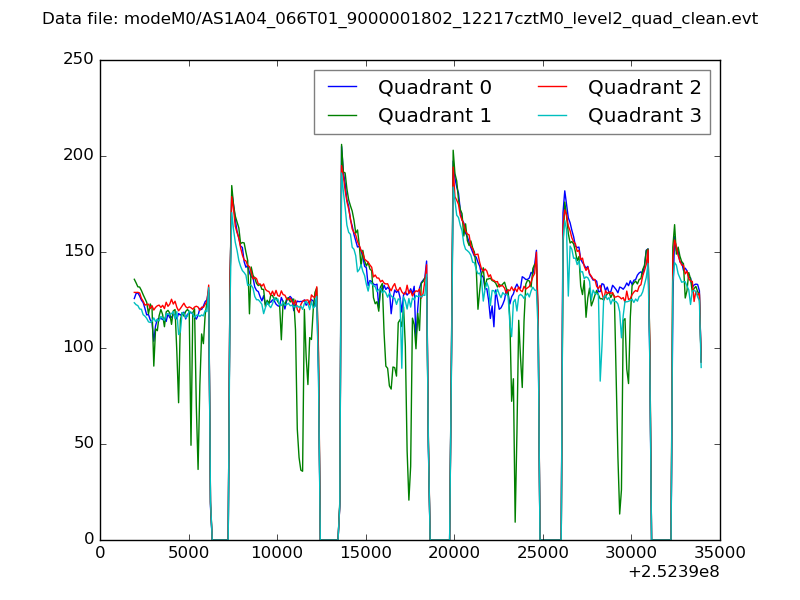 |
|
| Module-wise count rates for Quadrant A Data is divided into 100 sec bins |
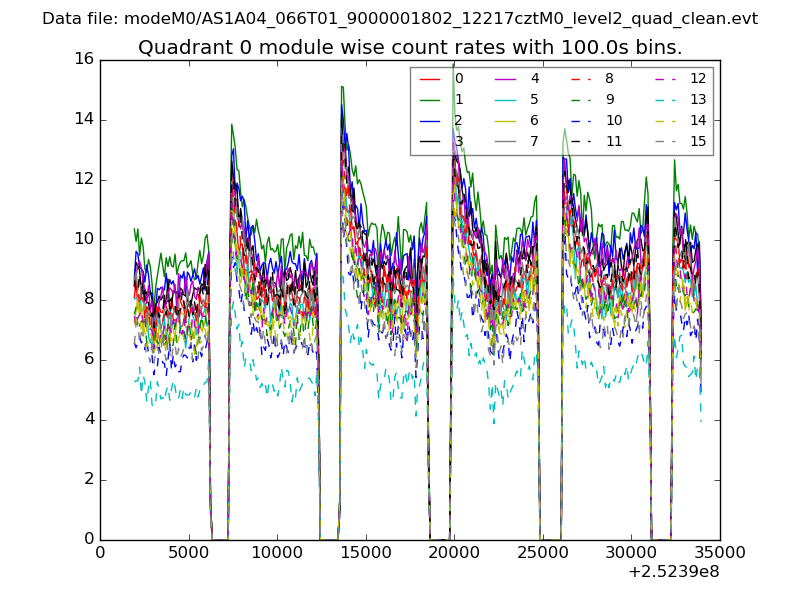 |
 |
| Module-wise count rates for Quadrant B Data is divided into 100 sec bins |
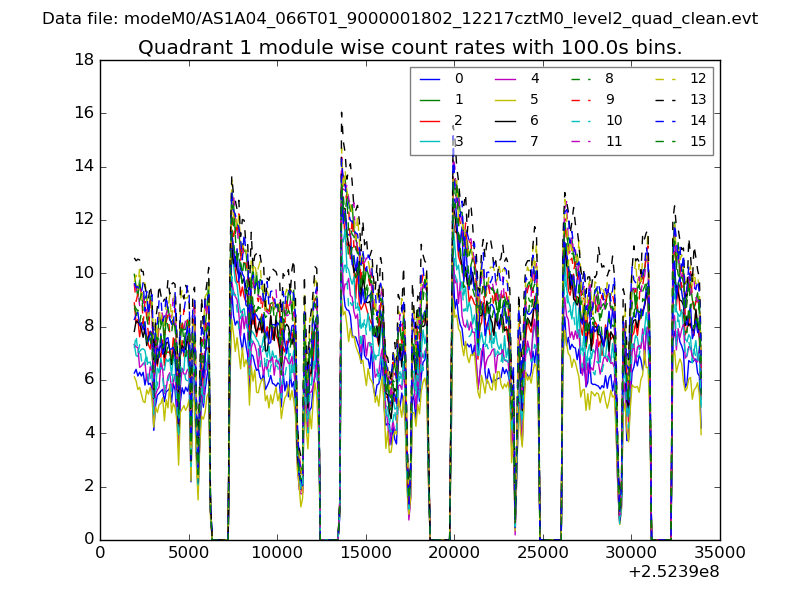 |
 |
| Module-wise count rates for Quadrant C Data is divided into 100 sec bins |
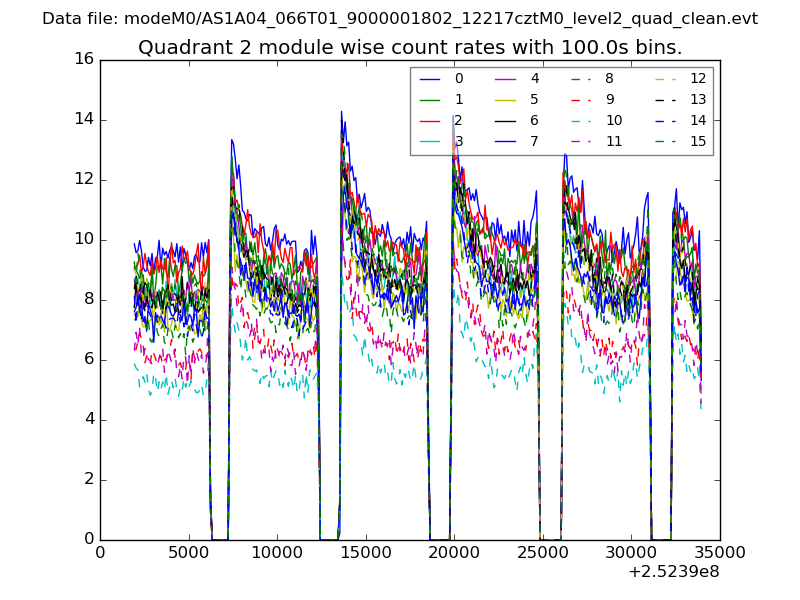 |
 |
| Module-wise count rates for Quadrant D Data is divided into 100 sec bins |
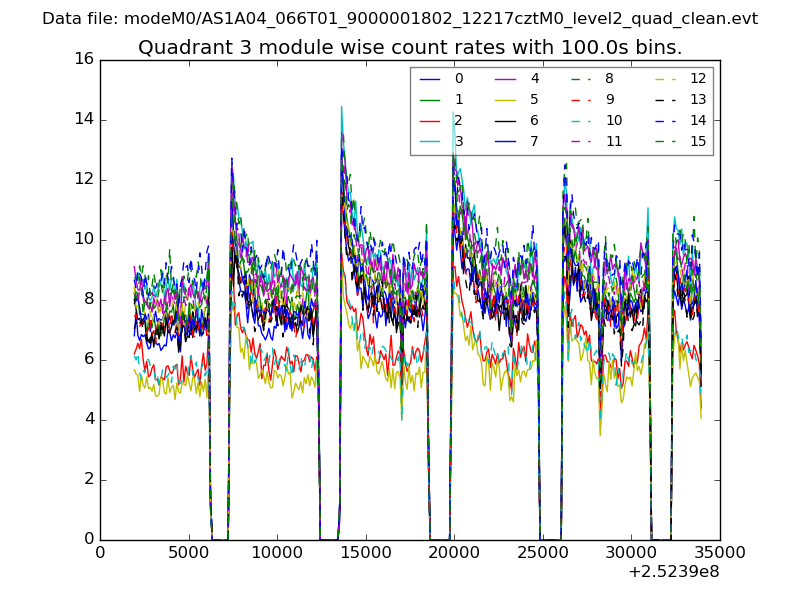 |
 |
| Parameter | Plot |
|---|---|
| CZT HV Monitor | 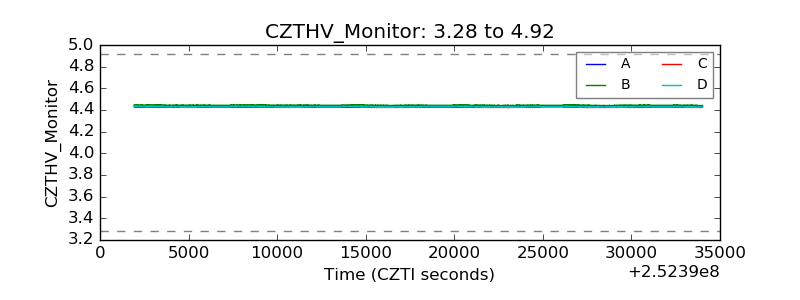 |
| D_VDD | 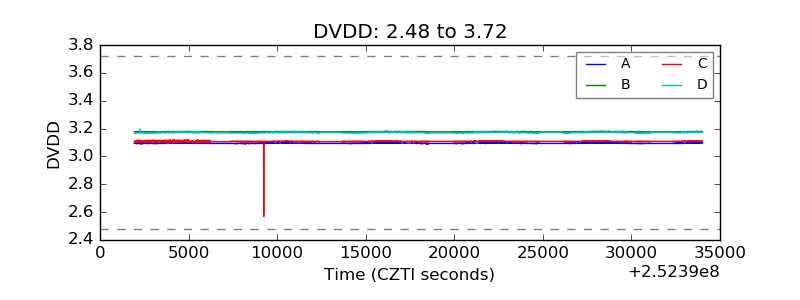 |
| Temperature 1 | 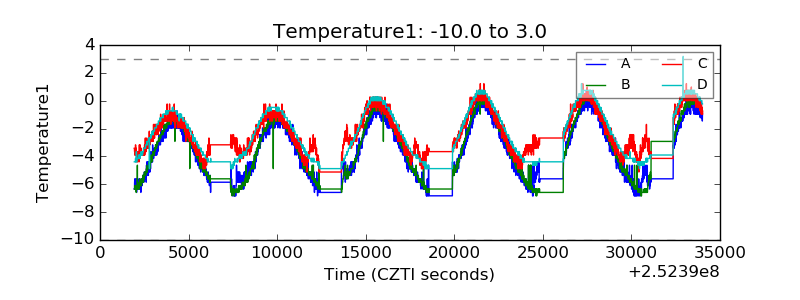 |
| Veto HV Monitor | 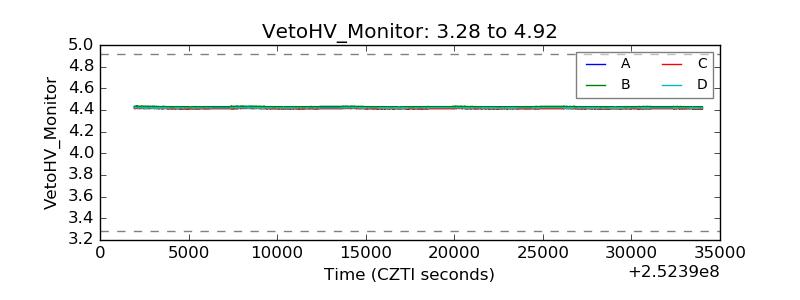 |
| Veto LLD | 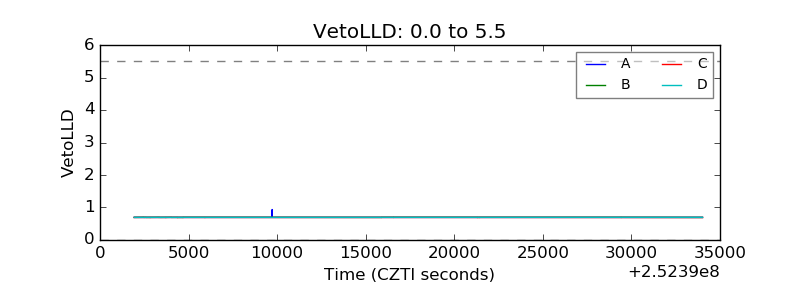 |
| Alpha Counter | 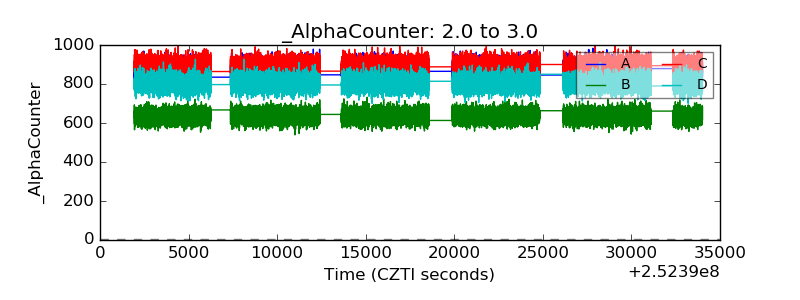 |
| _CPM_Rate | 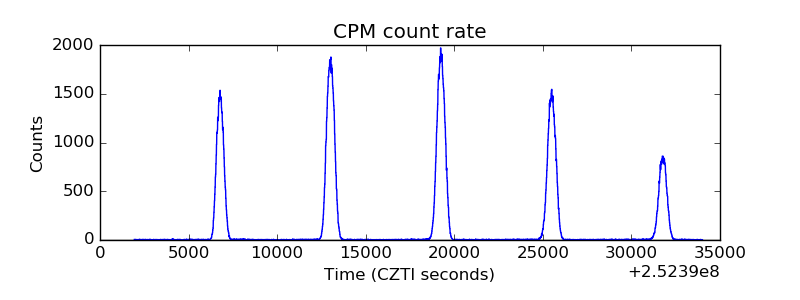 |
| CZT Counter | 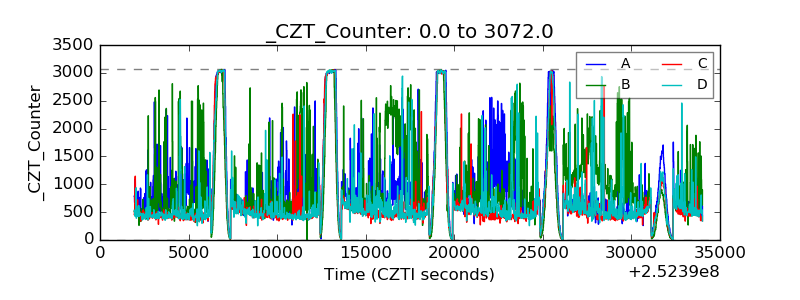 |
| +2.5 Volts monitor |  |
| +5 Volts monitor |  |
| _ROLL_ROT | 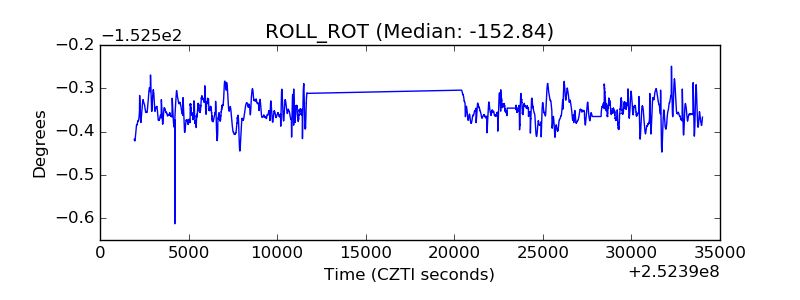 |
| _Roll_DEC | 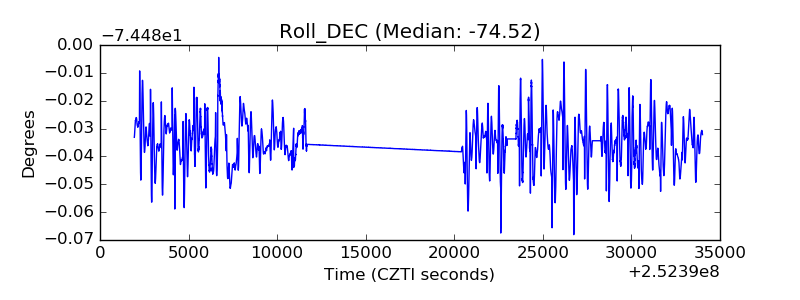 |
| _Roll_RA | 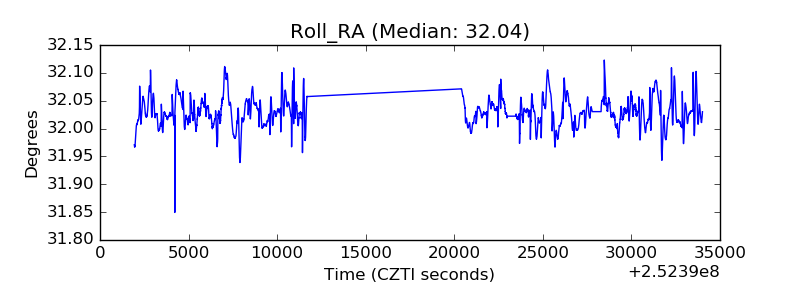 |
| Veto Counter | 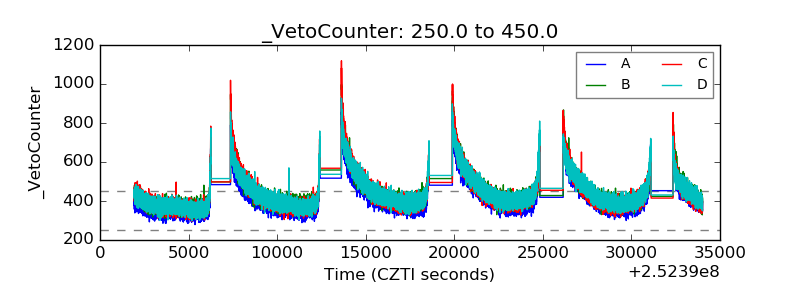 |