| Param | Original file | Final file |
|---|---|---|
| Filename | modeM0/AS1A04_066T01_9000001802_12218cztM0_level2.evt | modeM0/AS1A04_066T01_9000001802_12218cztM0_level2_quad_clean.evt |
| Size (bytes) | 158,117,760 | 36,077,760 |
| Size | 150.8 MB | 34.4 MB |
| Events in quadrant A | 1,207,171 | 243,101 |
| Events in quadrant B | 1,537,073 | 240,231 |
| Events in quadrant C | 875,070 | 241,138 |
| Events in quadrant D | 1,042,838 | 234,096 |
| Mode SS | |||
|---|---|---|---|
| Quadrant | BADHDUFLAG | Total packets | Discarded packets |
| A | 0 | 36 | 0 |
| B | 0 | 36 | 0 |
| C | 0 | 36 | 0 |
| D | 0 | 36 | 0 |
| Mode M0 | |||
|---|---|---|---|
| Quadrant | BADHDUFLAG | Total packets | Discarded packets |
| A | 0 | 4820 | 0 |
| B | 0 | 5850 | 0 |
| C | 0 | 3819 | 0 |
| D | 0 | 4336 | 0 |
| Quadrant | Total seconds | Saturated seconds | Saturation percentage |
|---|---|---|---|
| A | 1828 | 39 | 2.133479% |
| B | 1828 | 69 | 3.774617% |
| C | 1828 | 10 | 0.547046% |
| D | 1828 | 22 | 1.203501% |
Noise dominated data is calculated using 1-second bins in cleaned event files. If a bin has >2000 counts, and if more than 50% of those come from <1% of pixels, then it is considered to be noise-dominated and hence unusable.
| Quadrant | # 1 sec bins | Bins with >0 counts | Bins with >2000 counts | High rate bins dominated by noise | Noise dominated (total time) | Noise dominated (detector-on time) | Marked lightcurve |
|---|---|---|---|---|---|---|---|
| A | 1829 | 1829 | 16 | 16 | 0.87% | 0.87% | 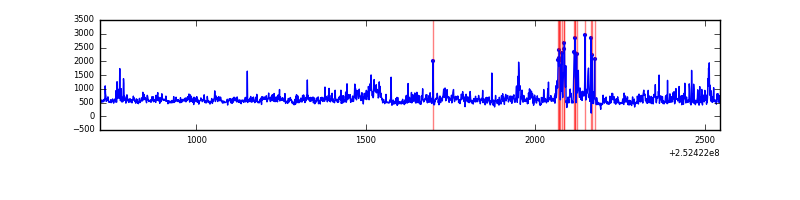 |
| B | 1829 | 1829 | 31 | 31 | 1.69% | 1.69% | 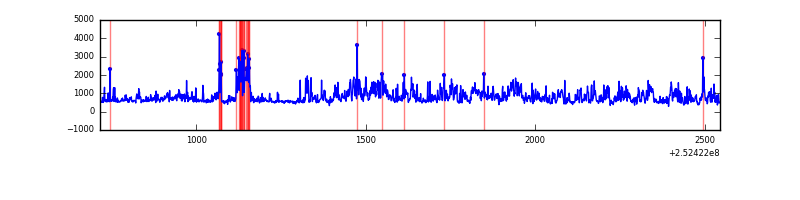 |
| C | 1829 | 1829 | 7 | 7 | 0.38% | 0.38% | 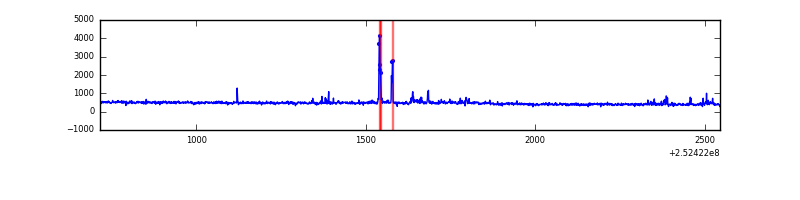 |
| D | 1829 | 1829 | 14 | 14 | 0.77% | 0.77% | 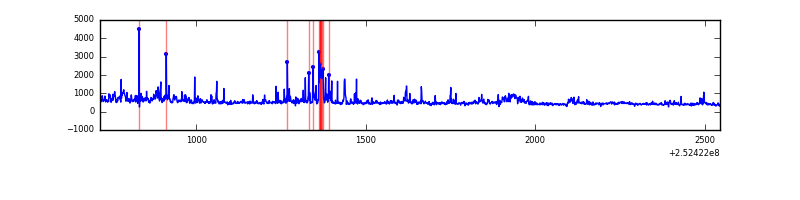 |
Top three noisy pixels from each quadrant. If the there are fewer than three noisy pixels in the level2.evt file, extra rows are filled as -1
| Pixel properties | Quadrant properties | ||||||
|---|---|---|---|---|---|---|---|
| Quadrant | DetID | PixID | Counts | Sigma | Mean | Median | Sigma |
| A | 5 | 16 | 90951 | 1993.85 | 218 | 214 | 45.5 |
| A | 1 | 162 | 72337 | 1584.83 | 218 | 214 | 45.5 |
| A | 13 | 251 | 47621 | 1041.72 | 218 | 214 | 45.5 |
| B | 15 | 204 | 413854 | 10110.36 | 213 | 208 | 40.9 |
| B | 4 | 239 | 127451 | 3110.08 | 213 | 208 | 40.9 |
| B | 0 | 219 | 57363 | 1396.99 | 213 | 208 | 40.9 |
| C | 0 | 207 | 34972 | 725.66 | 203 | 204 | 47.9 |
| C | 4 | 175 | 24290 | 502.71 | 203 | 204 | 47.9 |
| C | 15 | 208 | 18674 | 385.49 | 203 | 204 | 47.9 |
| D | 2 | 33 | 61043 | 1185.75 | 208 | 201 | 51.3 |
| D | 10 | 157 | 57619 | 1119.02 | 208 | 201 | 51.3 |
| D | 13 | 122 | 32142 | 622.5 | 208 | 201 | 51.3 |
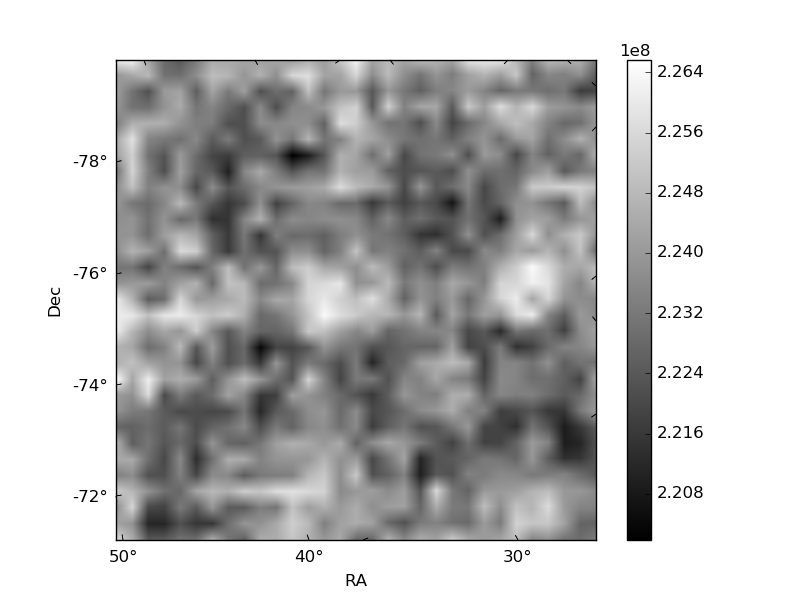
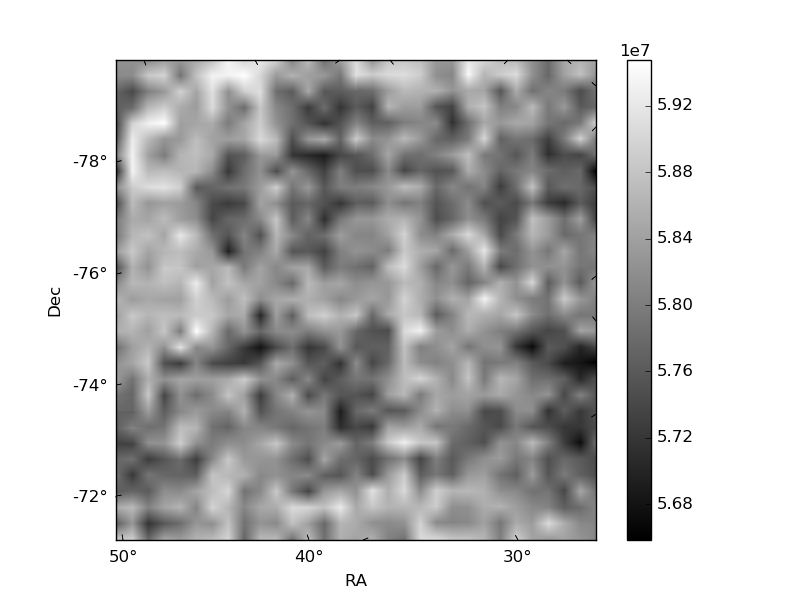
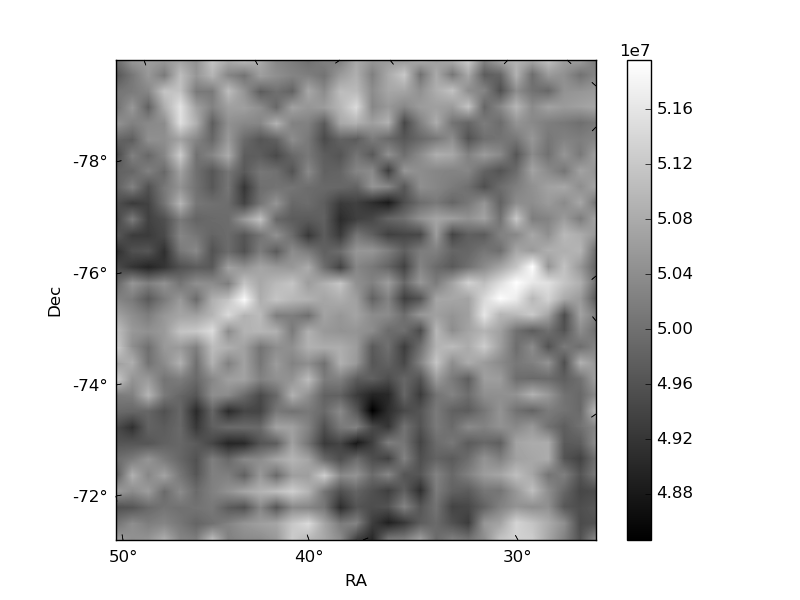
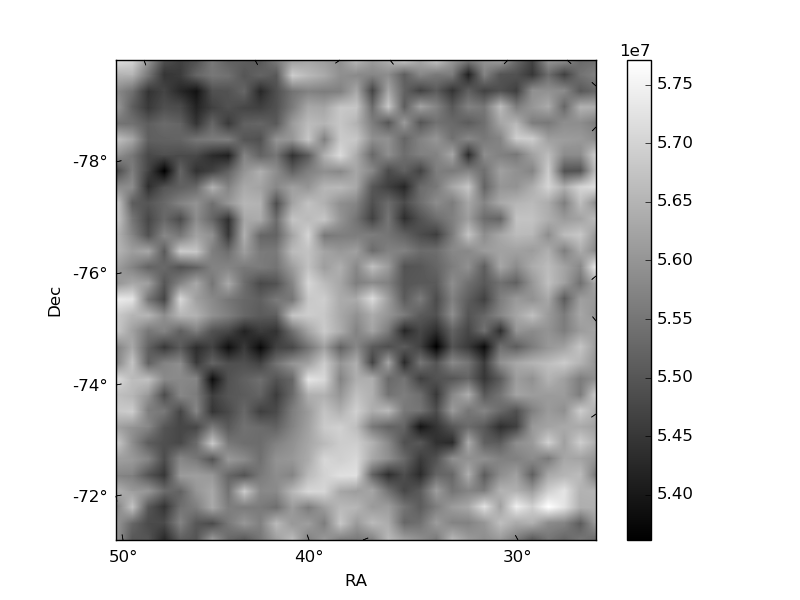
Histogram calculated using DETX and DETY for each event in the final _common_clean file
| Quadrant A | 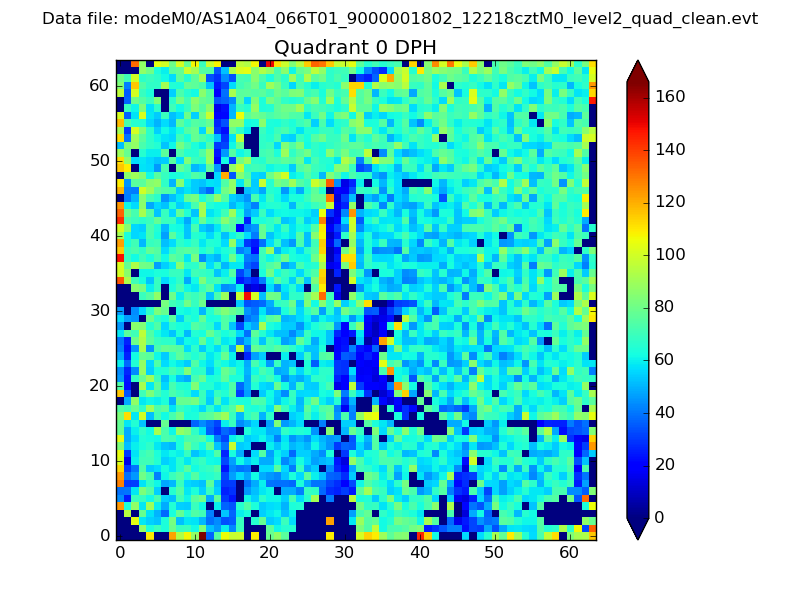 |
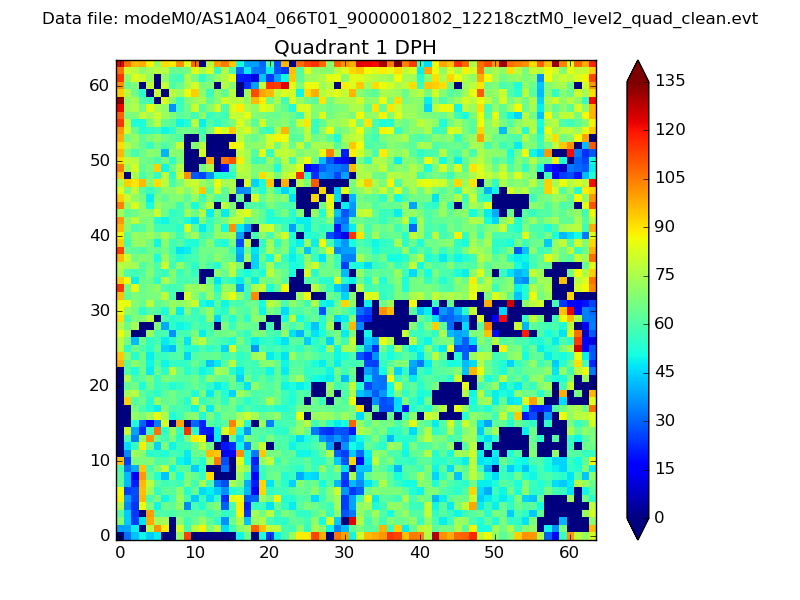 |
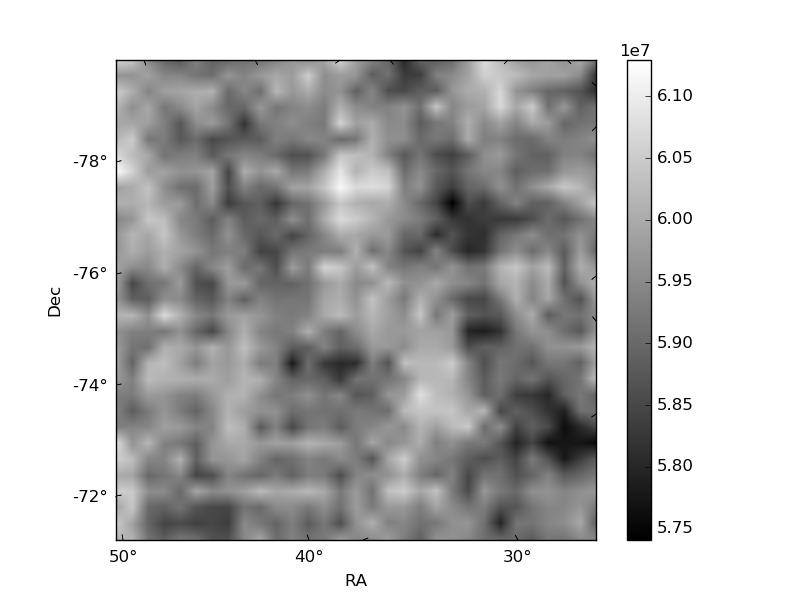
Quadrant B |
|---|---|---|---|
| Quadrant D | 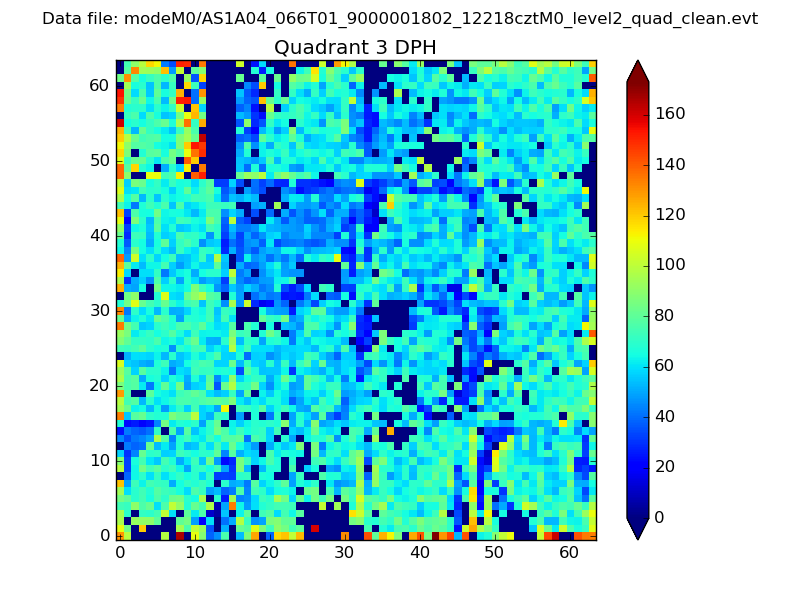 |
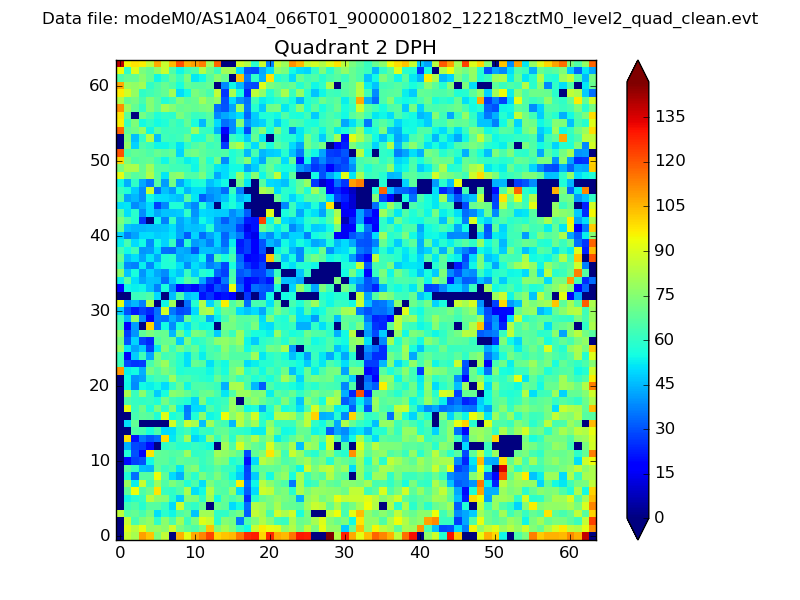 |
Quadrant C |
| Plot type | Count rate plots | Images |
|---|---|---|
| Comparison with Poisson distribution Blue bars denote a histogram of data divided into 1 sec bins. Red curve is a Poisson curve with rate = median count rate of data. |
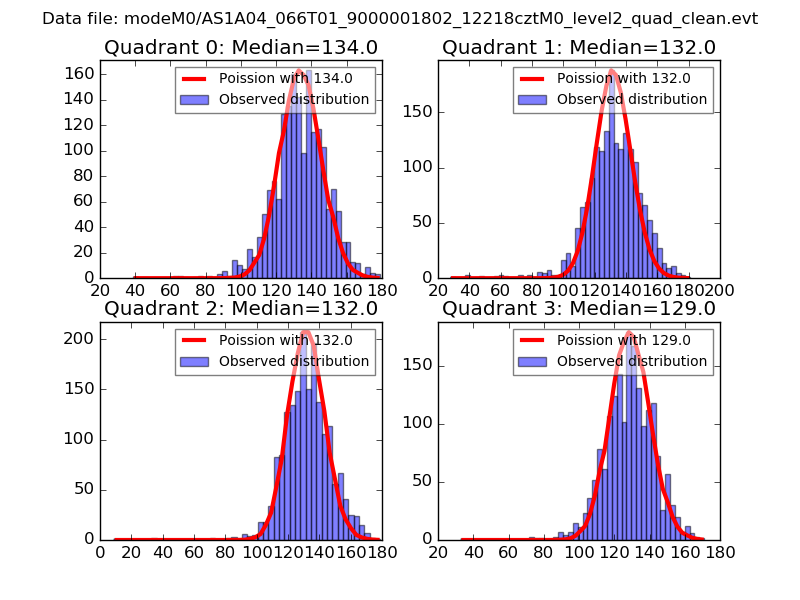 |
 |
| Quadrant-wise count rates Data is divided into 100 sec bins |
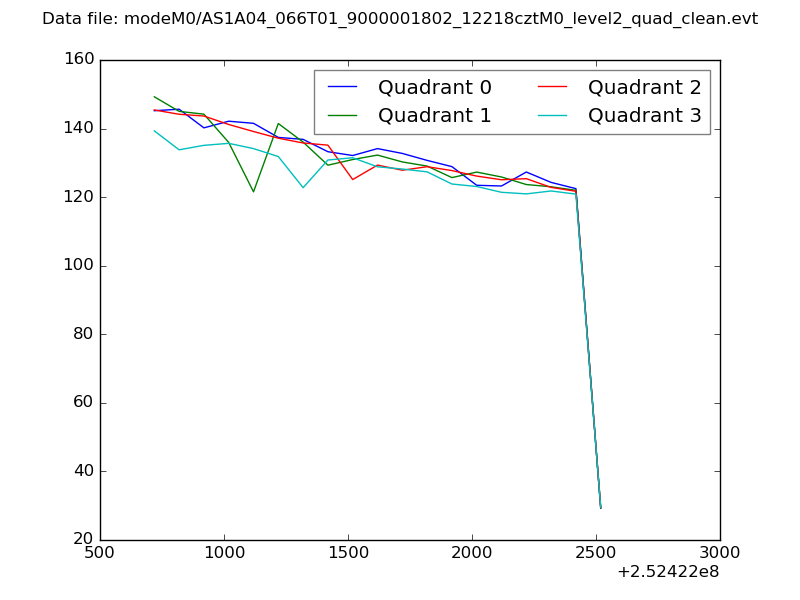 |
|
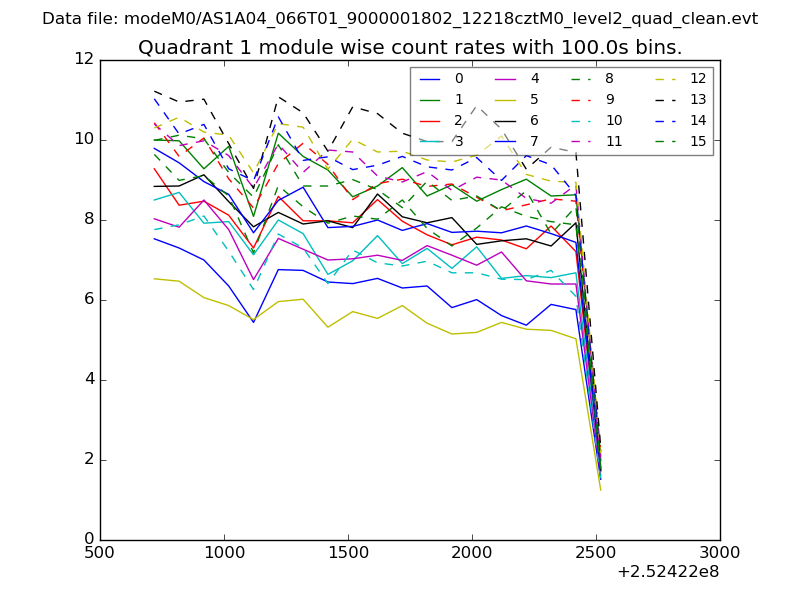
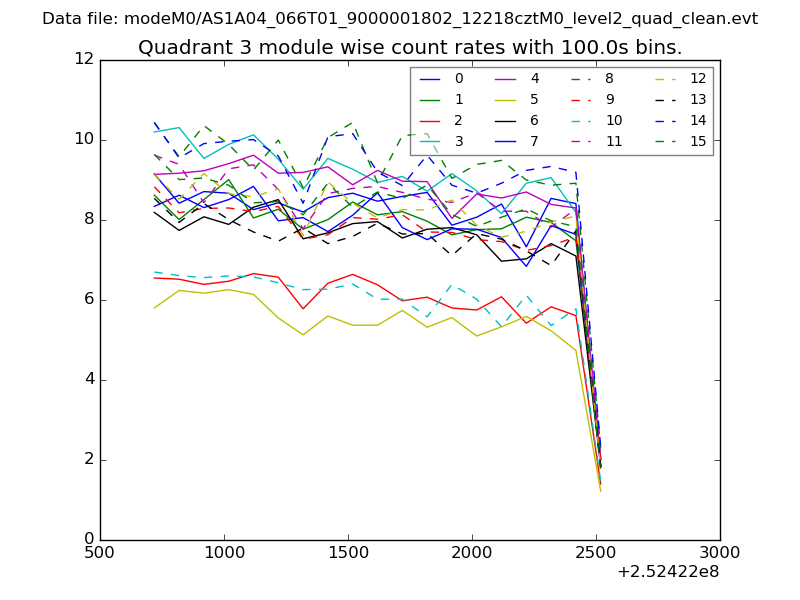
| Module-wise count rates for Quadrant A Data is divided into 100 sec bins |
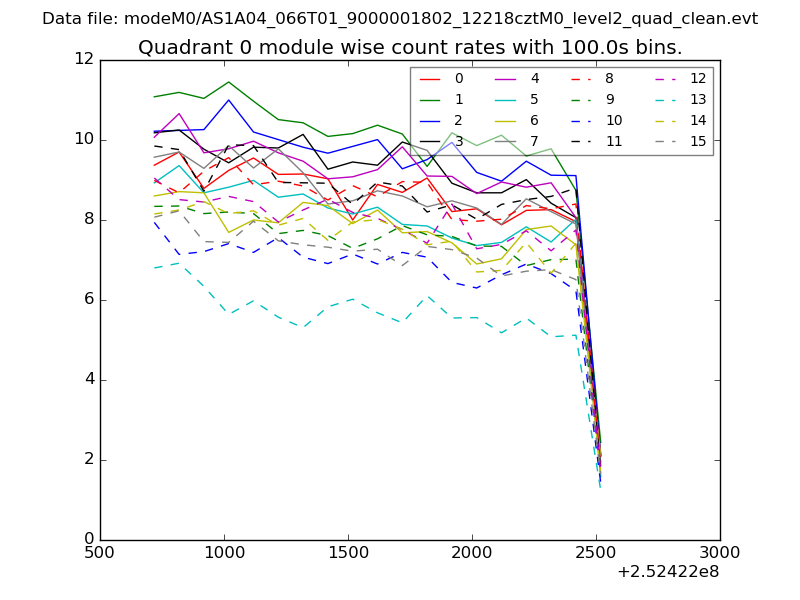 |
 |
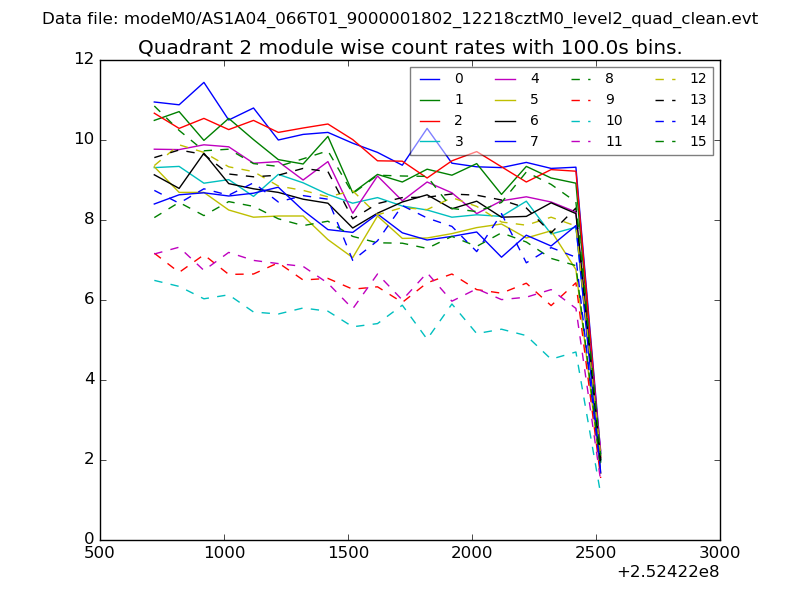
| Module-wise count rates for Quadrant B Data is divided into 100 sec bins |
 |
 |
| Module-wise count rates for Quadrant C Data is divided into 100 sec bins |
 |
 |
| Module-wise count rates for Quadrant D Data is divided into 100 sec bins |
 |
 |
| Parameter | Plot |
|---|---|
| CZT HV Monitor | 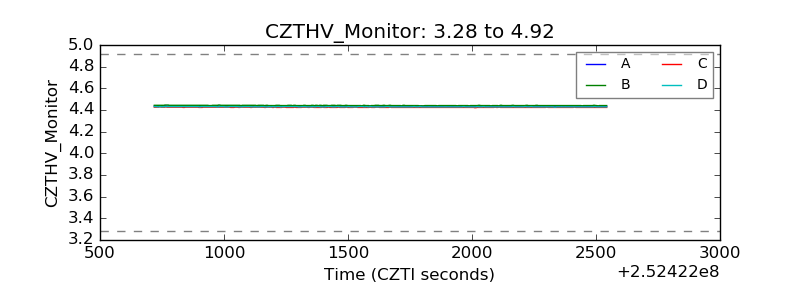 |
| D_VDD | 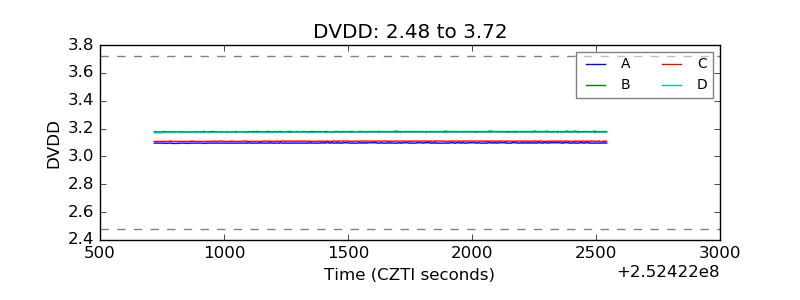 |
| Temperature 1 | 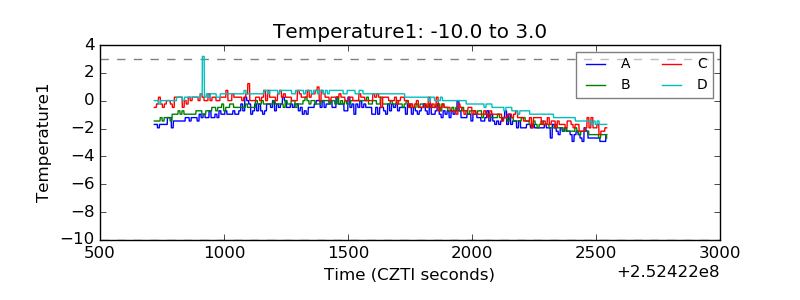 |
| Veto HV Monitor | 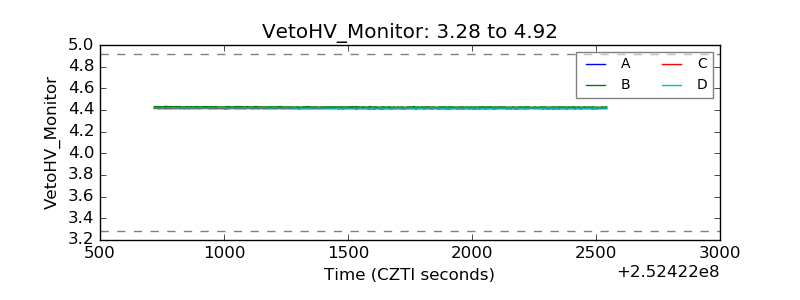 |
| Veto LLD | 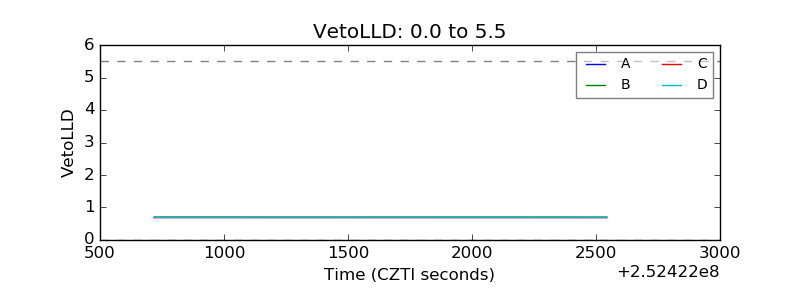 |
| Alpha Counter | 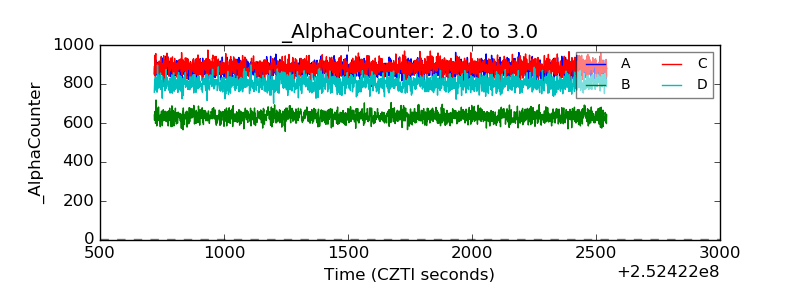 |
| _CPM_Rate | 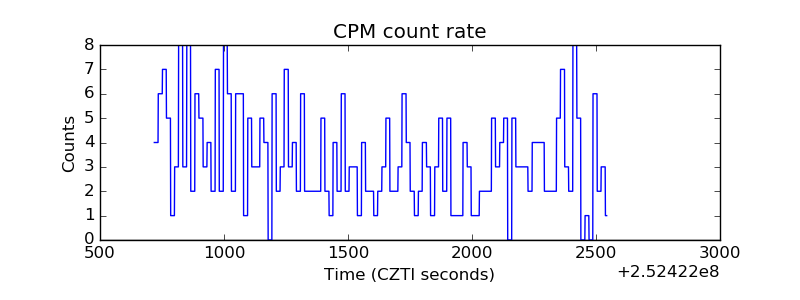 |
| CZT Counter | 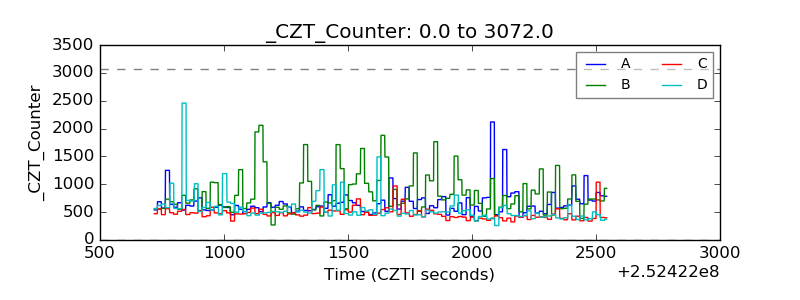 |
| +2.5 Volts monitor |  |
| +5 Volts monitor |  |
| _ROLL_ROT | 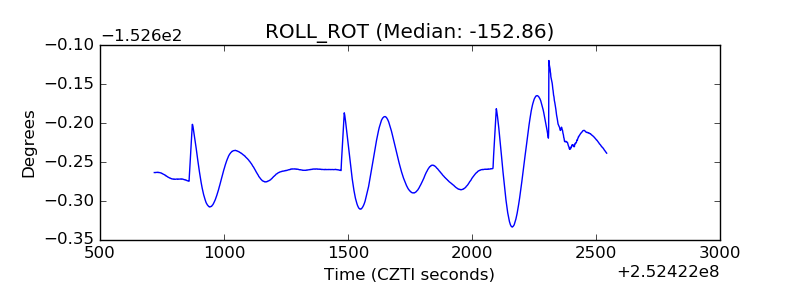 |
| _Roll_DEC | 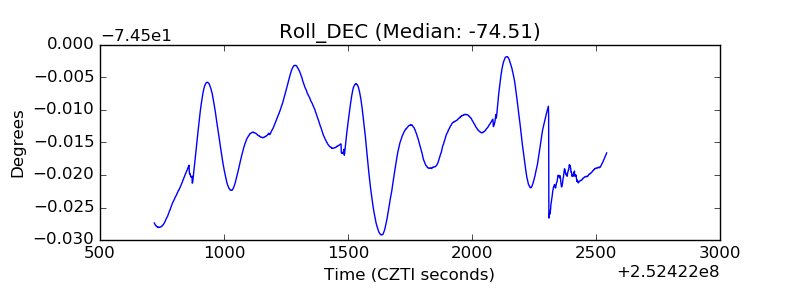 |
| _Roll_RA |  |
| Veto Counter |  |