| Param | Original file | Final file |
|---|---|---|
| Filename | modeM0/AS1C03_014T01_9000001804_12219cztM0_level2.evt | modeM0/AS1C03_014T01_9000001804_12219cztM0_level2_quad_clean.evt |
| Size (bytes) | 611,988,480 | 128,799,360 |
| Size | 583.6 MB | 122.8 MB |
| Events in quadrant A | 4,321,300 | 877,842 |
| Events in quadrant B | 5,711,291 | 837,503 |
| Events in quadrant C | 4,199,985 | 859,062 |
| Events in quadrant D | 3,825,614 | 836,652 |
| Mode M0 | |||
|---|---|---|---|
| Quadrant | BADHDUFLAG | Total packets | Discarded packets |
| A | 0 | 17547 | 3 |
| B | 0 | 21682 | 2 |
| C | 0 | 17410 | 2 |
| D | 0 | 16287 | 2 |
| Mode SS | |||
|---|---|---|---|
| Quadrant | BADHDUFLAG | Total packets | Discarded packets |
| A | 0 | 142 | 0 |
| B | 0 | 142 | 0 |
| C | 0 | 142 | 0 |
| D | 0 | 142 | 0 |
| Mode M9 | |||
|---|---|---|---|
| Quadrant | BADHDUFLAG | Total packets | Discarded packets |
| A | 0 | 7 | 0 |
| B | 0 | 7 | 0 |
| C | 0 | 7 | 0 |
| D | 0 | 8 | 0 |
| Quadrant | Total seconds | Saturated seconds | Saturation percentage |
|---|---|---|---|
| A | 7032 | 106 | 1.507395% |
| B | 7032 | 723 | 10.281570% |
| C | 7032 | 256 | 3.640501% |
| D | 7032 | 116 | 1.649602% |
Noise dominated data is calculated using 1-second bins in cleaned event files. If a bin has >2000 counts, and if more than 50% of those come from <1% of pixels, then it is considered to be noise-dominated and hence unusable.
| Quadrant | # 1 sec bins | Bins with >0 counts | Bins with >2000 counts | High rate bins dominated by noise | Noise dominated (total time) | Noise dominated (detector-on time) | Marked lightcurve |
|---|---|---|---|---|---|---|---|
| A | 7709 | 7034 | 12 | 12 | 0.16% | 0.17% | 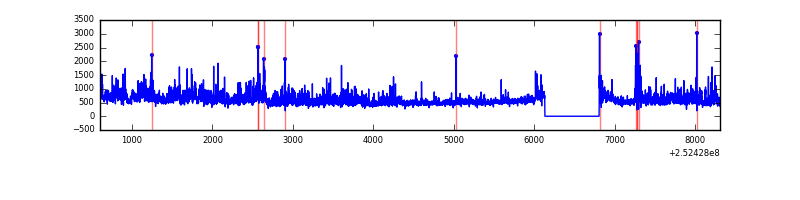 |
| B | 7709 | 7034 | 409 | 409 | 5.31% | 5.81% | 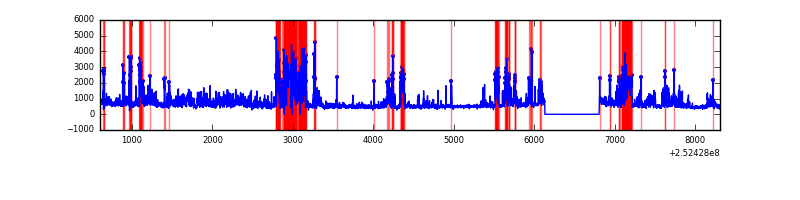 |
| C | 7709 | 7034 | 215 | 215 | 2.79% | 3.06% | 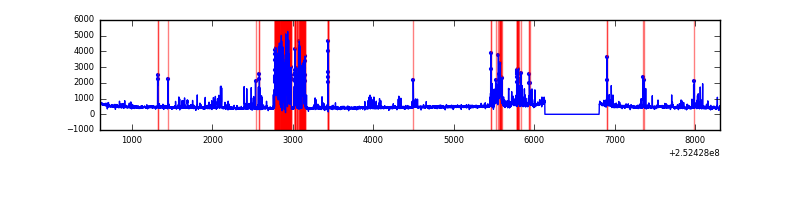 |
| D | 7709 | 7034 | 85 | 85 | 1.10% | 1.21% | 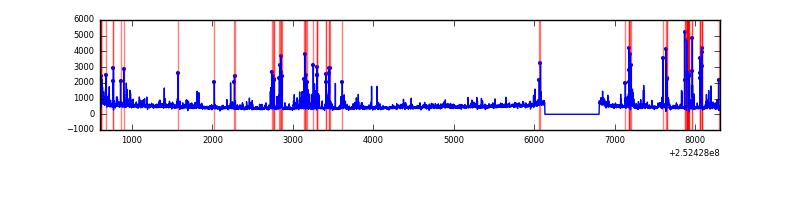 |
Top three noisy pixels from each quadrant. If the there are fewer than three noisy pixels in the level2.evt file, extra rows are filled as -1
| Pixel properties | Quadrant properties | ||||||
|---|---|---|---|---|---|---|---|
| Quadrant | DetID | PixID | Counts | Sigma | Mean | Median | Sigma |
| A | 1 | 162 | 237026 | 1420.79 | 816 | 797 | 166.3 |
| A | 8 | 15 | 232686 | 1394.69 | 816 | 797 | 166.3 |
| A | 13 | 251 | 187059 | 1120.27 | 816 | 797 | 166.3 |
| B | 4 | 239 | 1380063 | 9406.84 | 784 | 766 | 146.6 |
| B | 15 | 204 | 685512 | 4669.99 | 784 | 766 | 146.6 |
| B | 10 | 16 | 262775 | 1786.91 | 784 | 766 | 146.6 |
| C | 15 | 208 | 1117656 | 6233.06 | 777 | 780 | 179.2 |
| C | 4 | 175 | 36361 | 198.57 | 777 | 780 | 179.2 |
| C | 13 | 61 | 5731 | 27.63 | 777 | 780 | 179.2 |
| D | 10 | 199 | 206251 | 1094.55 | 781 | 756 | 187.7 |
| D | 1 | 52 | 147140 | 779.7 | 781 | 756 | 187.7 |
| D | 14 | 34 | 108124 | 571.89 | 781 | 756 | 187.7 |
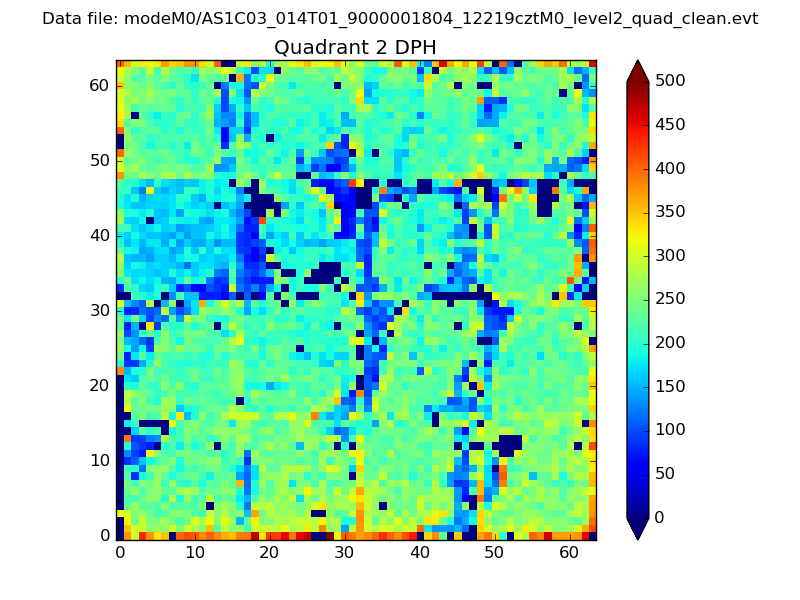
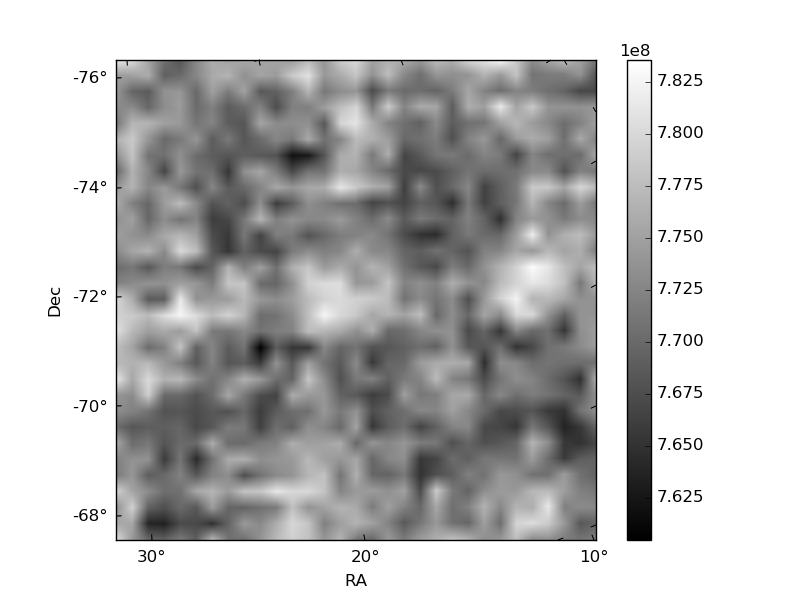
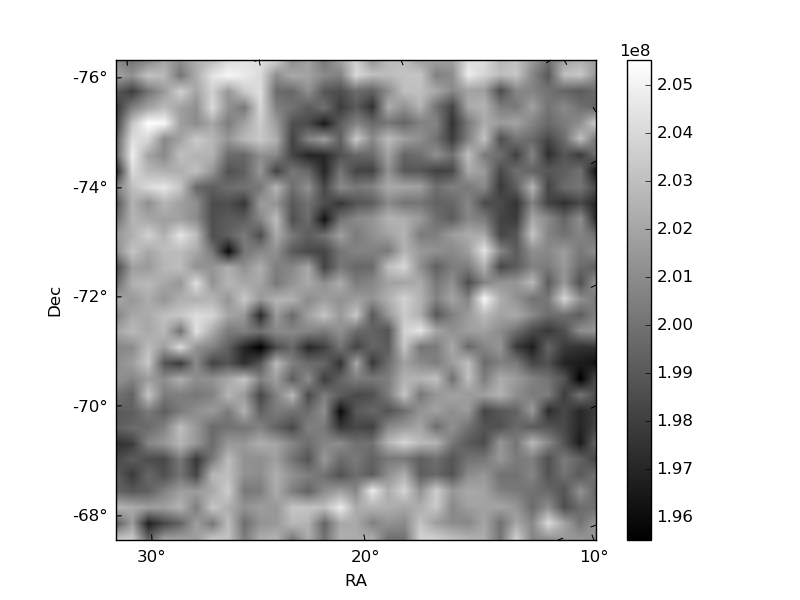
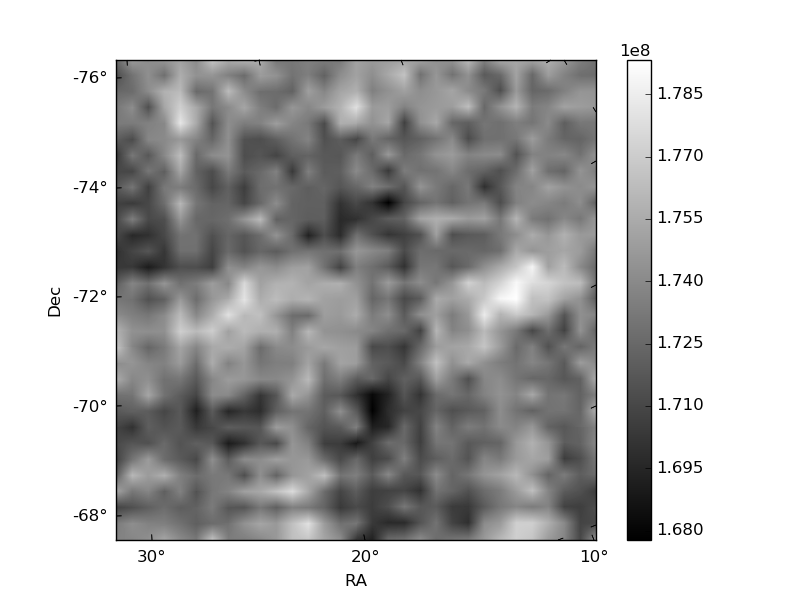
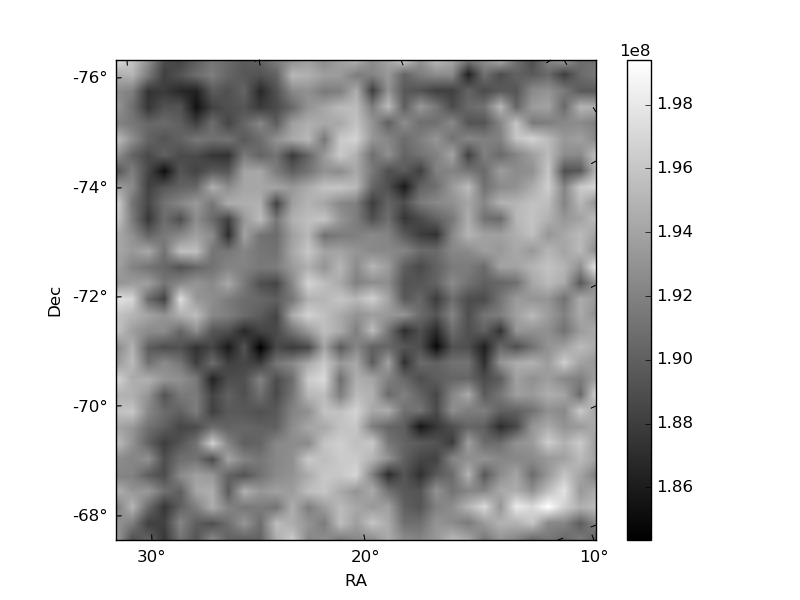
Histogram calculated using DETX and DETY for each event in the final _common_clean file
| Quadrant A | 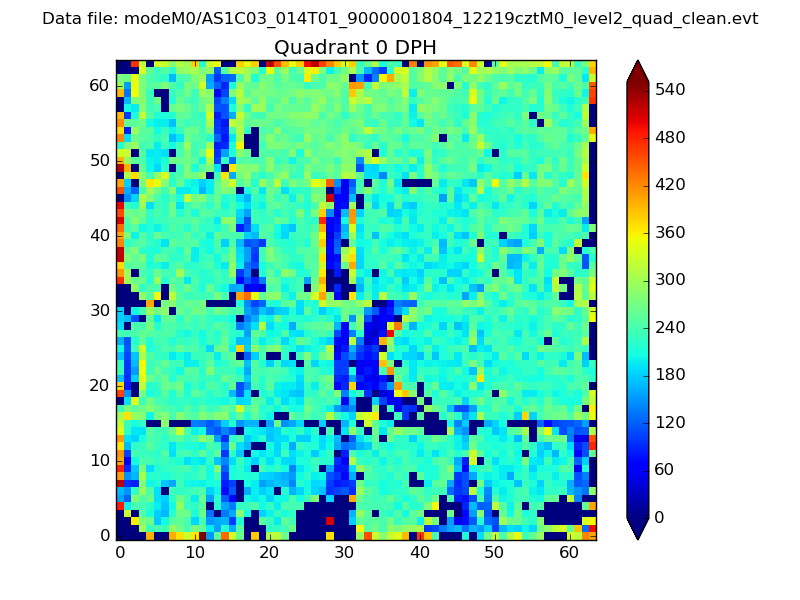 |
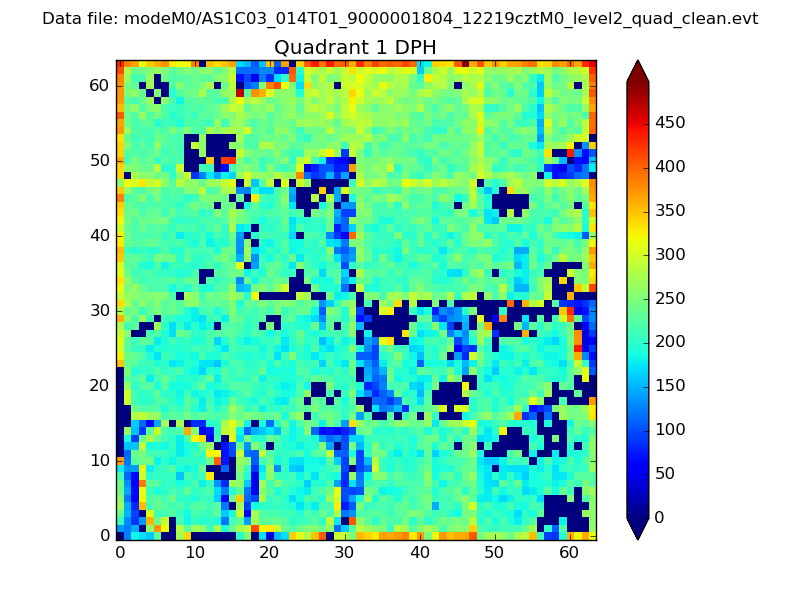 |
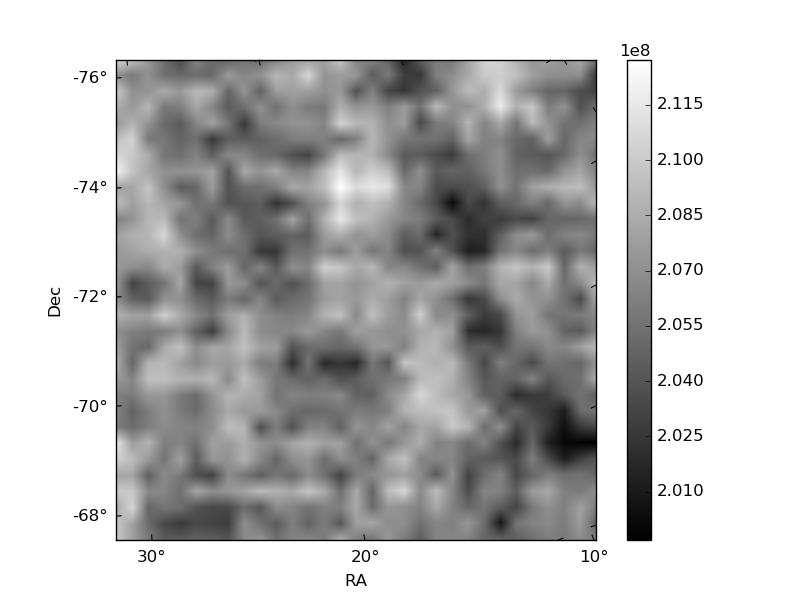
Quadrant B |
|---|---|---|---|
| Quadrant D | 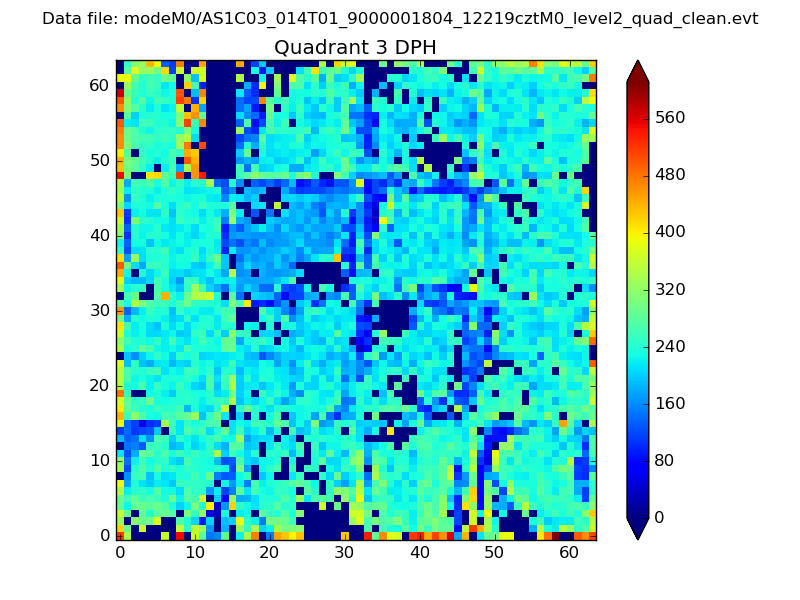 |
 |
Quadrant C |
| Plot type | Count rate plots | Images |
|---|---|---|
| Comparison with Poisson distribution Blue bars denote a histogram of data divided into 1 sec bins. Red curve is a Poisson curve with rate = median count rate of data. |
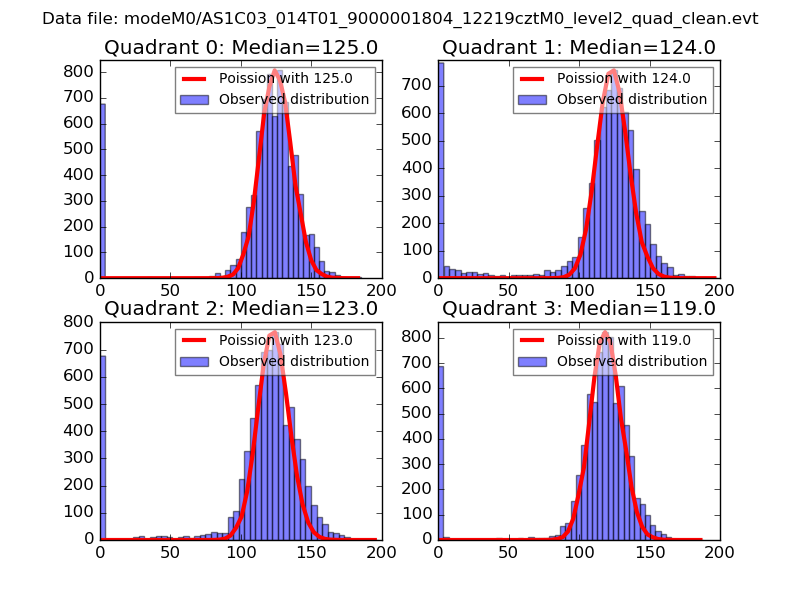 |
 |
| Quadrant-wise count rates Data is divided into 100 sec bins |
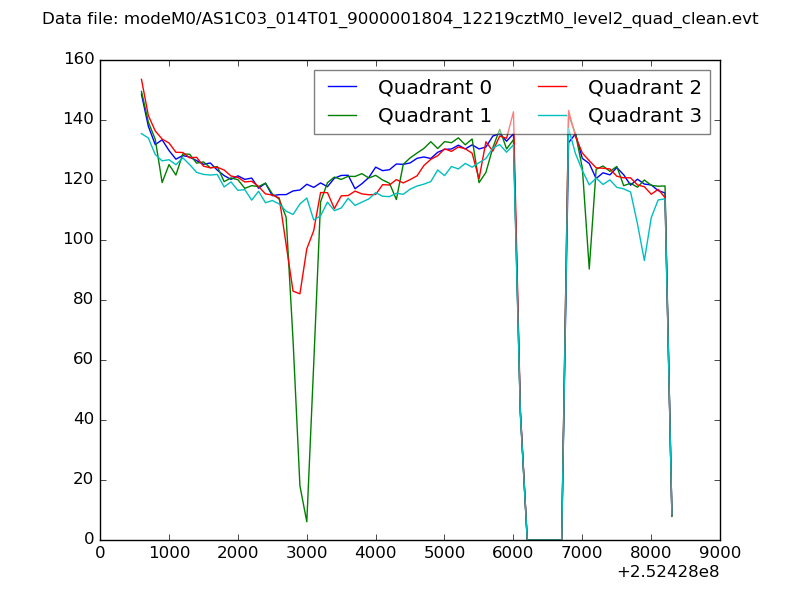 |
|
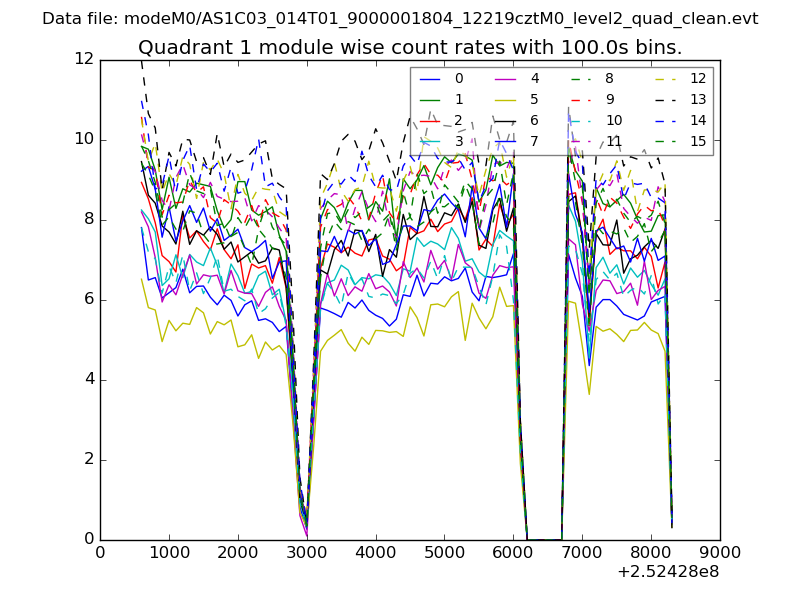
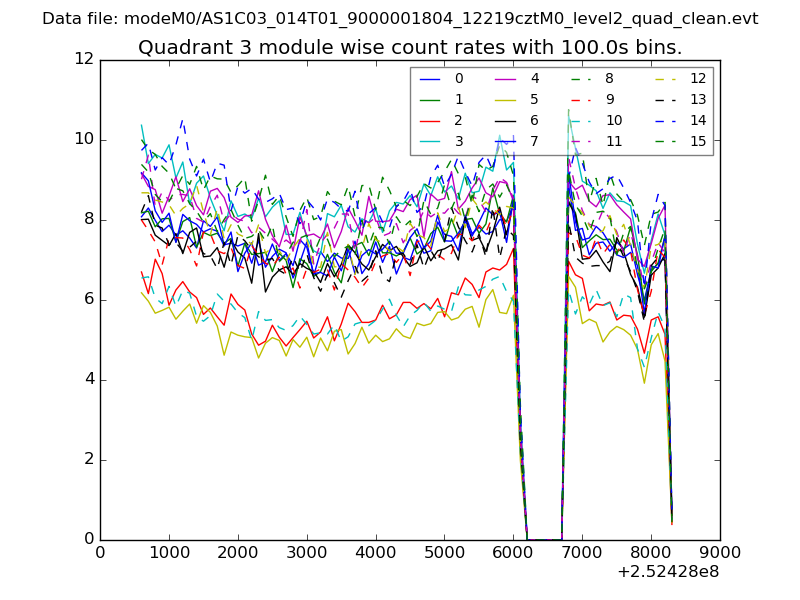
| Module-wise count rates for Quadrant A Data is divided into 100 sec bins |
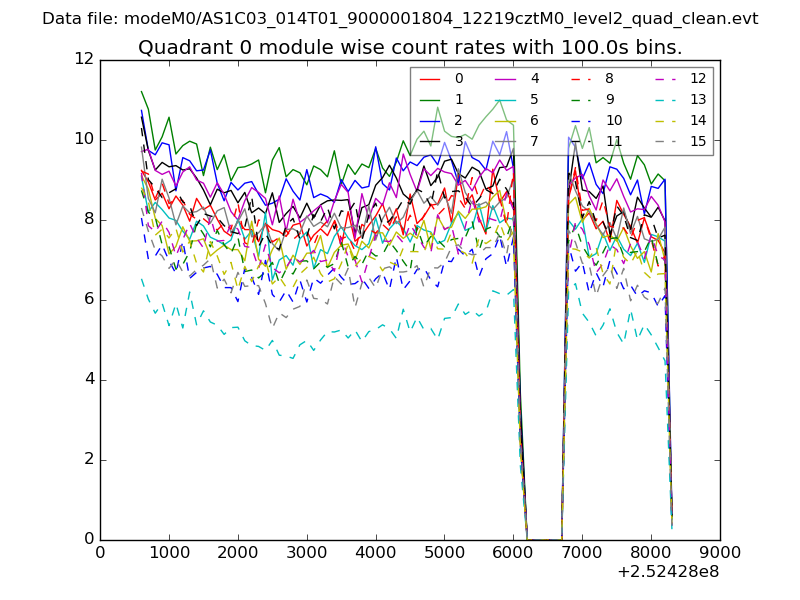 |
 |
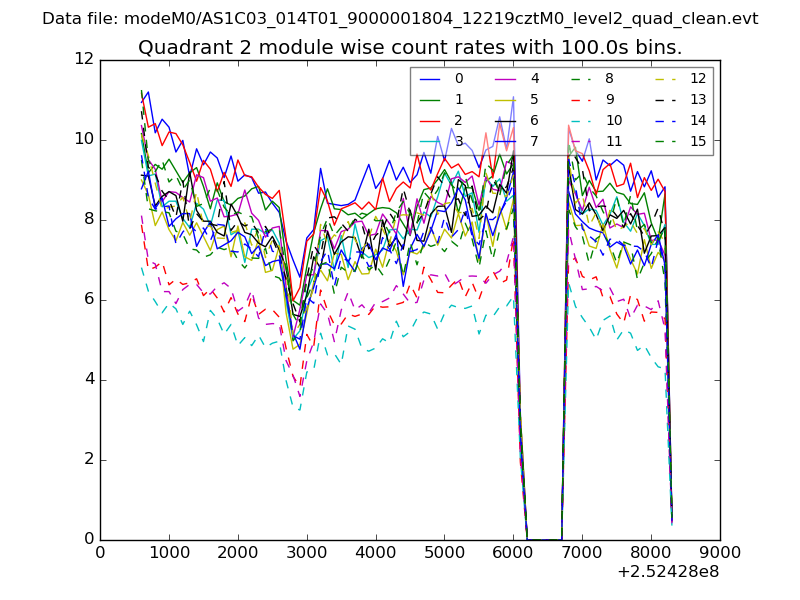
| Module-wise count rates for Quadrant B Data is divided into 100 sec bins |
 |
 |
| Module-wise count rates for Quadrant C Data is divided into 100 sec bins |
 |
 |
| Module-wise count rates for Quadrant D Data is divided into 100 sec bins |
 |
 |
| Parameter | Plot |
|---|---|
| CZT HV Monitor | 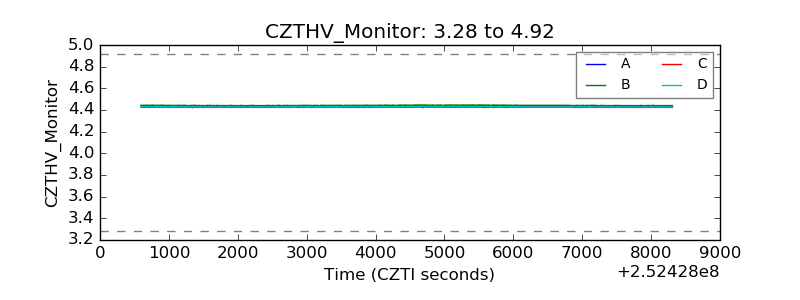 |
| D_VDD | 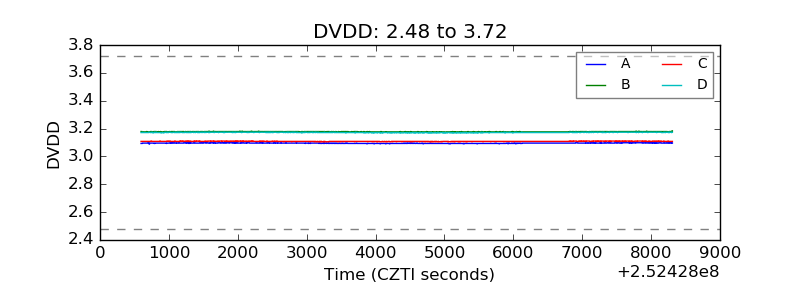 |
| Temperature 1 | 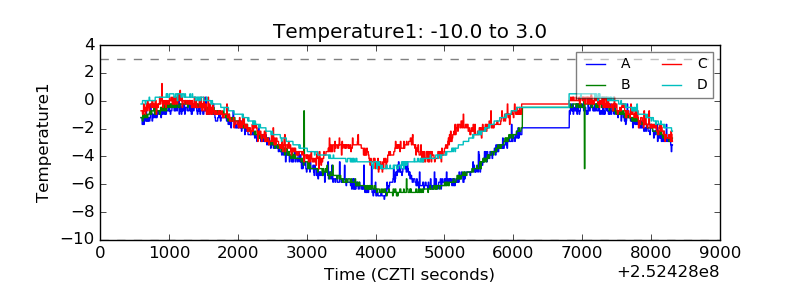 |
| Veto HV Monitor | 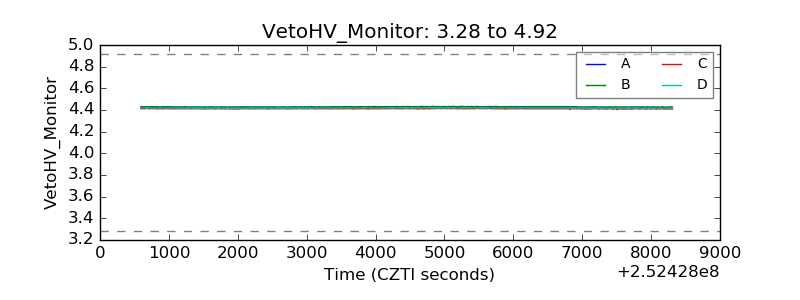 |
| Veto LLD | 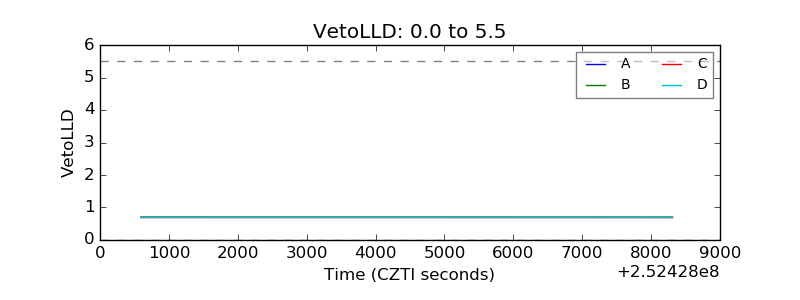 |
| Alpha Counter | 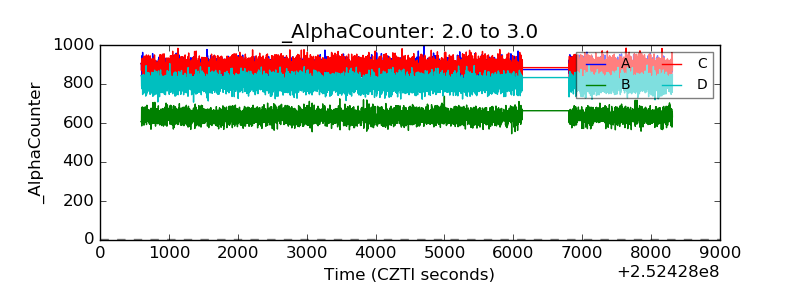 |
| _CPM_Rate | 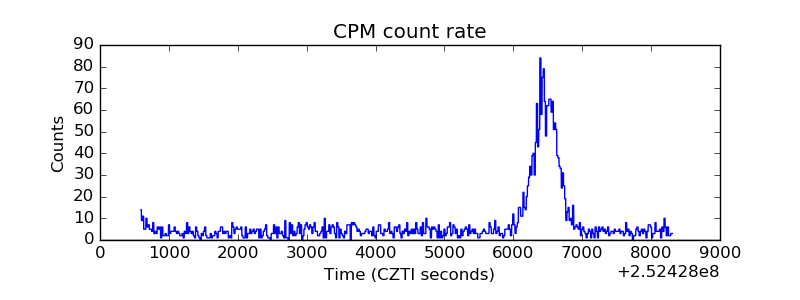 |
| CZT Counter | 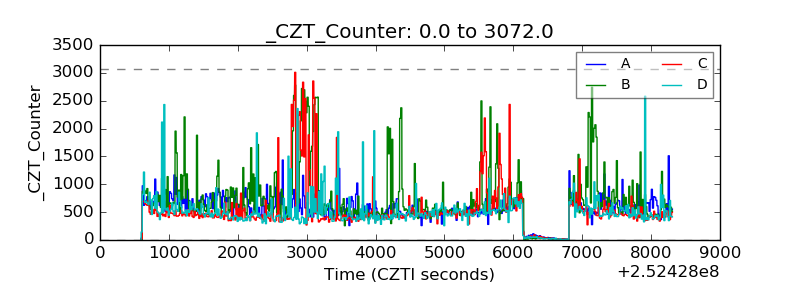 |
| +2.5 Volts monitor |  |
| +5 Volts monitor |  |
| _ROLL_ROT | 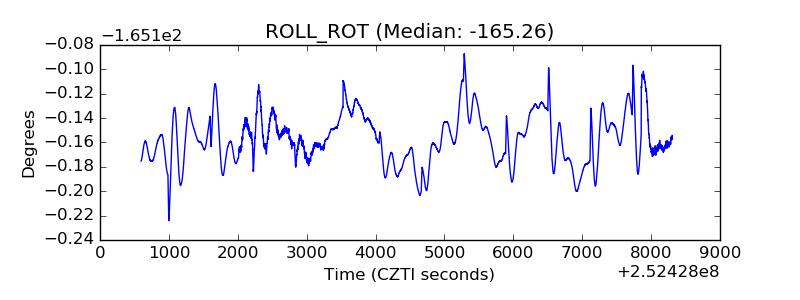 |
| _Roll_DEC | 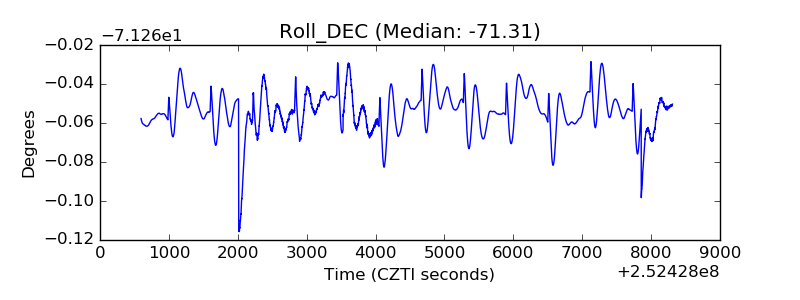 |
| _Roll_RA | 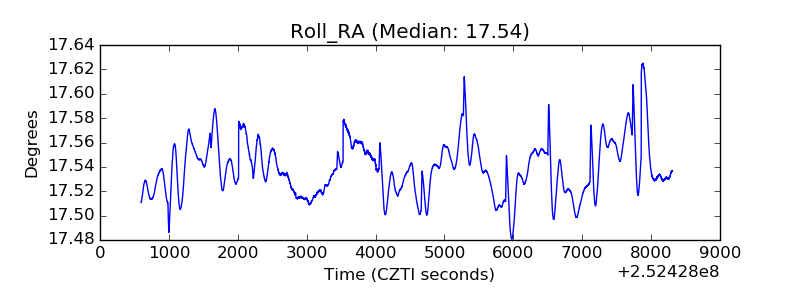 |
| Veto Counter | 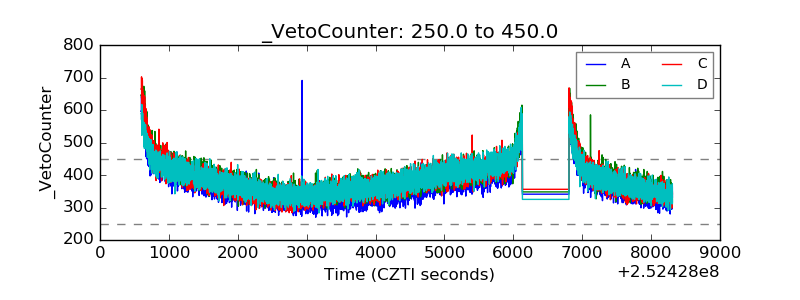 |