| Param | Original file | Final file |
|---|---|---|
| Filename | modeM0/AS1C03_014T01_9000001804_12221cztM0_level2.evt | modeM0/AS1C03_014T01_9000001804_12221cztM0_level2_quad_clean.evt |
| Size (bytes) | 583,666,560 | 124,407,360 |
| Size | 556.6 MB | 118.6 MB |
| Events in quadrant A | 4,180,444 | 848,294 |
| Events in quadrant B | 6,002,768 | 766,345 |
| Events in quadrant C | 3,298,518 | 842,510 |
| Events in quadrant D | 3,711,782 | 814,456 |
| Mode M0 | |||
|---|---|---|---|
| Quadrant | BADHDUFLAG | Total packets | Discarded packets |
| A | 0 | 17246 | 2 |
| B | 0 | 22552 | 1 |
| C | 0 | 15038 | 1 |
| D | 0 | 16139 | 1 |
| Mode SS | |||
|---|---|---|---|
| Quadrant | BADHDUFLAG | Total packets | Discarded packets |
| A | 0 | 146 | 0 |
| B | 0 | 146 | 0 |
| C | 0 | 146 | 0 |
| D | 0 | 146 | 0 |
| Mode M9 | |||
|---|---|---|---|
| Quadrant | BADHDUFLAG | Total packets | Discarded packets |
| A | 0 | 2 | 0 |
| B | 0 | 2 | 0 |
| C | 0 | 2 | 0 |
| D | 0 | 2 | 0 |
| Quadrant | Total seconds | Saturated seconds | Saturation percentage |
|---|---|---|---|
| A | 7114 | 207 | 2.909755% |
| B | 7114 | 1146 | 16.109081% |
| C | 7114 | 60 | 0.843407% |
| D | 7114 | 79 | 1.110486% |
Noise dominated data is calculated using 1-second bins in cleaned event files. If a bin has >2000 counts, and if more than 50% of those come from <1% of pixels, then it is considered to be noise-dominated and hence unusable.
| Quadrant | # 1 sec bins | Bins with >0 counts | Bins with >2000 counts | High rate bins dominated by noise | Noise dominated (total time) | Noise dominated (detector-on time) | Marked lightcurve |
|---|---|---|---|---|---|---|---|
| A | 7304 | 7115 | 20 | 20 | 0.27% | 0.28% | 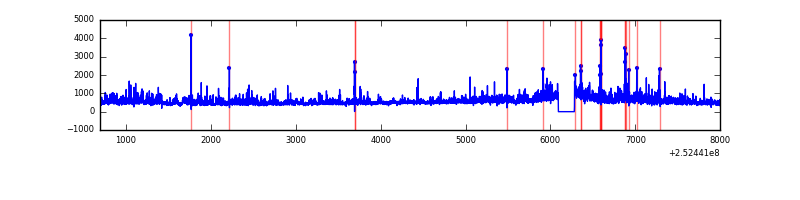 |
| B | 7304 | 7115 | 614 | 614 | 8.41% | 8.63% | 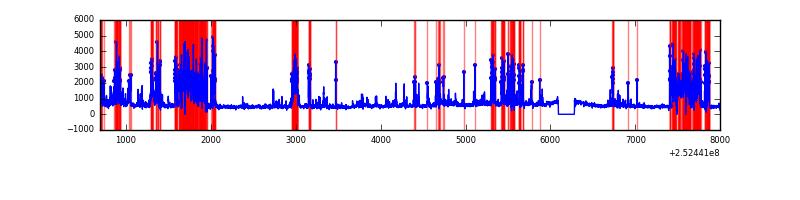 |
| C | 7305 | 7116 | 20 | 20 | 0.27% | 0.28% |  |
| D | 7304 | 7115 | 49 | 49 | 0.67% | 0.69% | 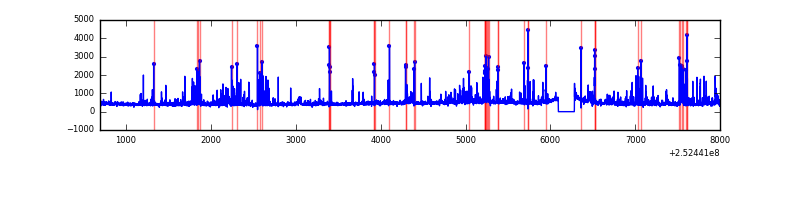 |
Top three noisy pixels from each quadrant. If the there are fewer than three noisy pixels in the level2.evt file, extra rows are filled as -1
| Pixel properties | Quadrant properties | ||||||
|---|---|---|---|---|---|---|---|
| Quadrant | DetID | PixID | Counts | Sigma | Mean | Median | Sigma |
| A | 1 | 162 | 267385 | 1632.04 | 803 | 787 | 163.4 |
| A | 13 | 251 | 230848 | 1408.37 | 803 | 787 | 163.4 |
| A | 1 | 178 | 150332 | 915.48 | 803 | 787 | 163.4 |
| B | 4 | 239 | 2124943 | 15372.87 | 734 | 716 | 138.2 |
| B | 4 | 206 | 297349 | 2146.71 | 734 | 716 | 138.2 |
| B | 3 | 64 | 284725 | 2055.35 | 734 | 716 | 138.2 |
| C | 15 | 208 | 221134 | 1232.01 | 777 | 781 | 178.9 |
| C | 4 | 175 | 18010 | 96.33 | 777 | 781 | 178.9 |
| C | 0 | 207 | 6680 | 32.98 | 777 | 781 | 178.9 |
| D | 1 | 52 | 200338 | 1061.51 | 775 | 750 | 188.0 |
| D | 10 | 199 | 95503 | 503.94 | 775 | 750 | 188.0 |
| D | 13 | 249 | 88825 | 468.43 | 775 | 750 | 188.0 |
Histogram calculated using DETX and DETY for each event in the final _common_clean file
| Quadrant A | 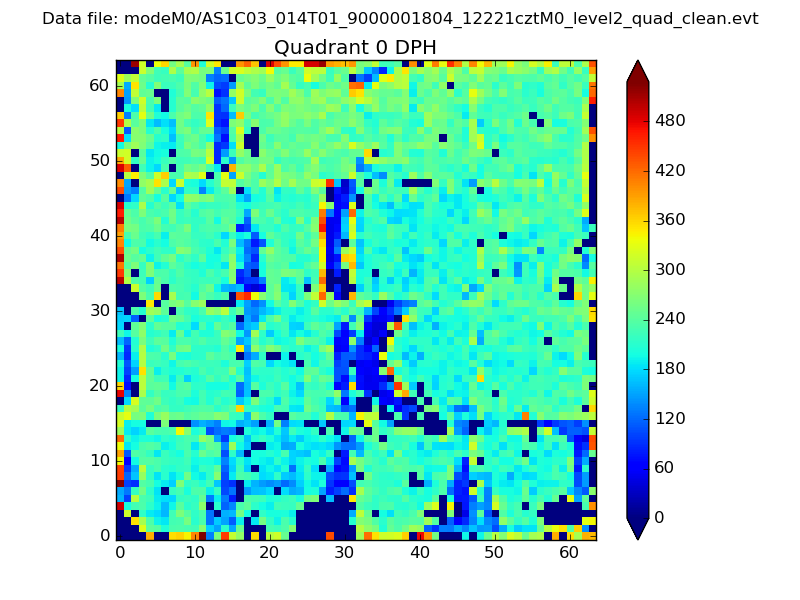 |
 |
Quadrant B |
|---|---|---|---|
| Quadrant D | 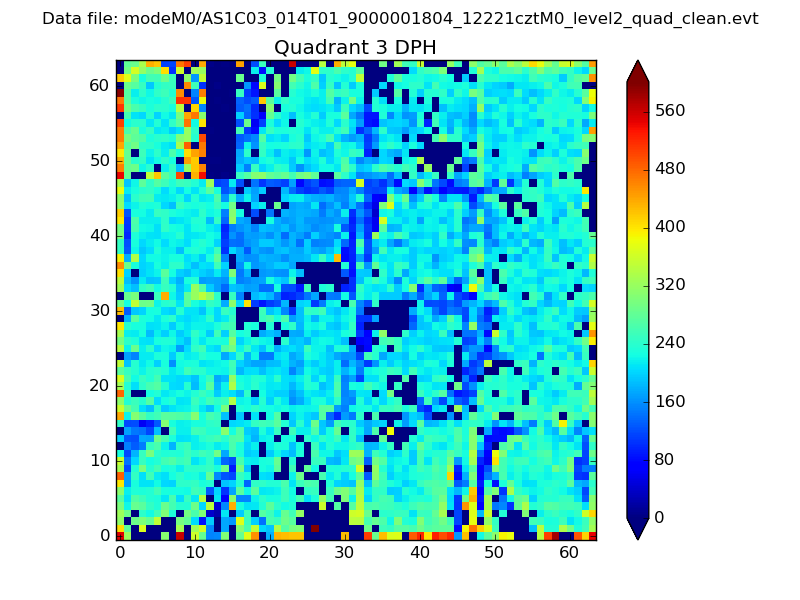 |
 |
Quadrant C |
| Plot type | Count rate plots | Images |
|---|---|---|
| Comparison with Poisson distribution Blue bars denote a histogram of data divided into 1 sec bins. Red curve is a Poisson curve with rate = median count rate of data. |
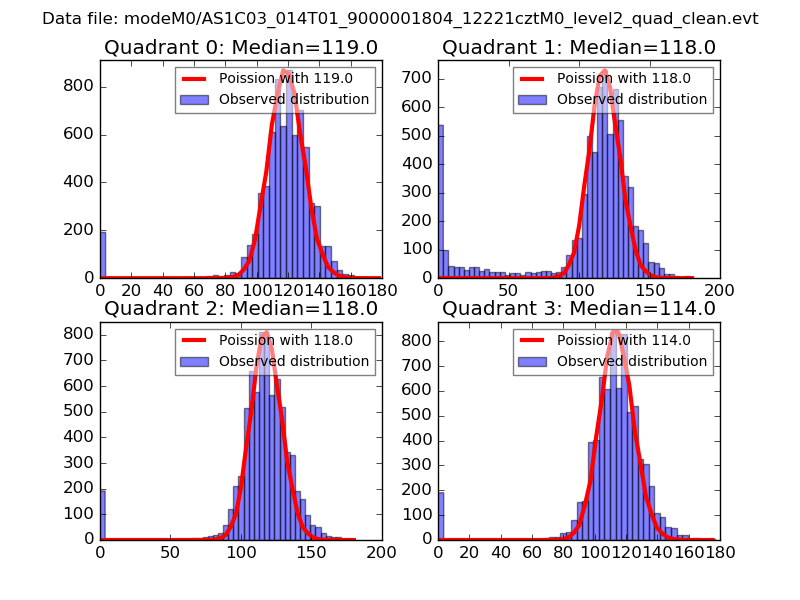 |
 |
| Quadrant-wise count rates Data is divided into 100 sec bins |
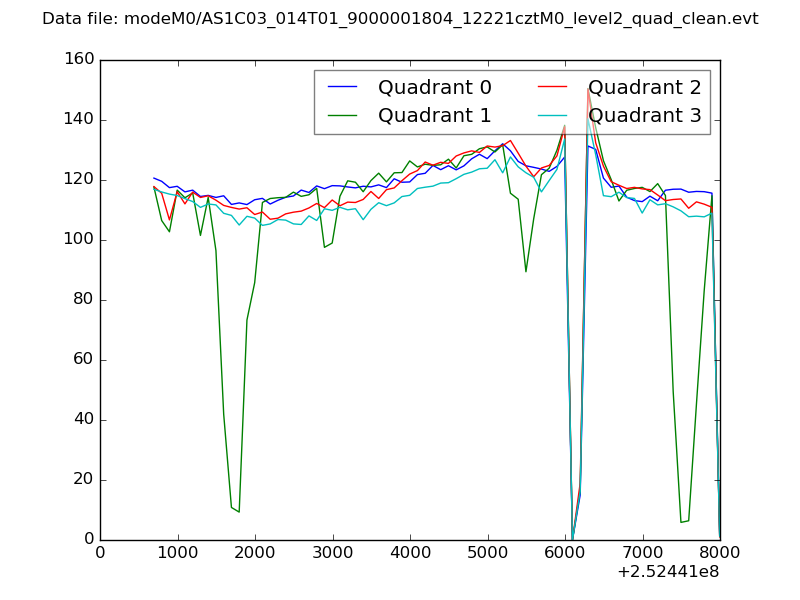 |
|
| Module-wise count rates for Quadrant A Data is divided into 100 sec bins |
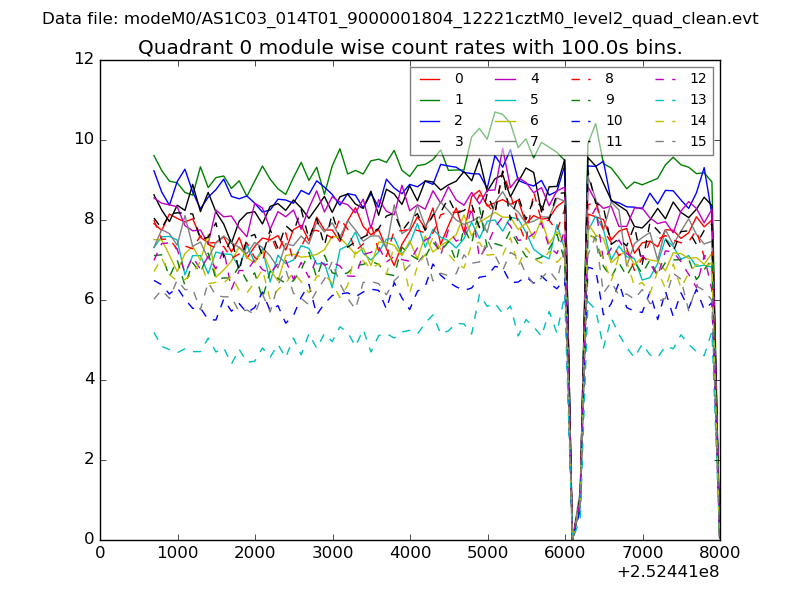 |
 |
| Module-wise count rates for Quadrant B Data is divided into 100 sec bins |
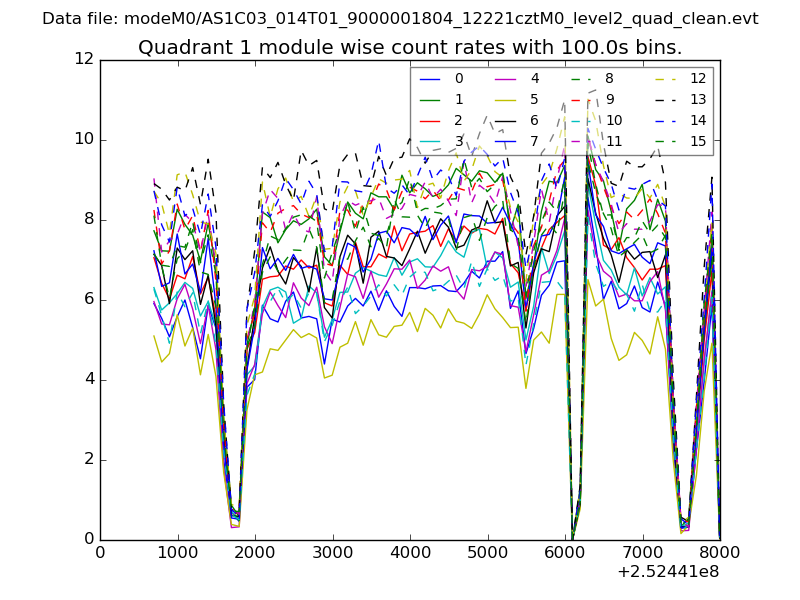 |
 |
| Module-wise count rates for Quadrant C Data is divided into 100 sec bins |
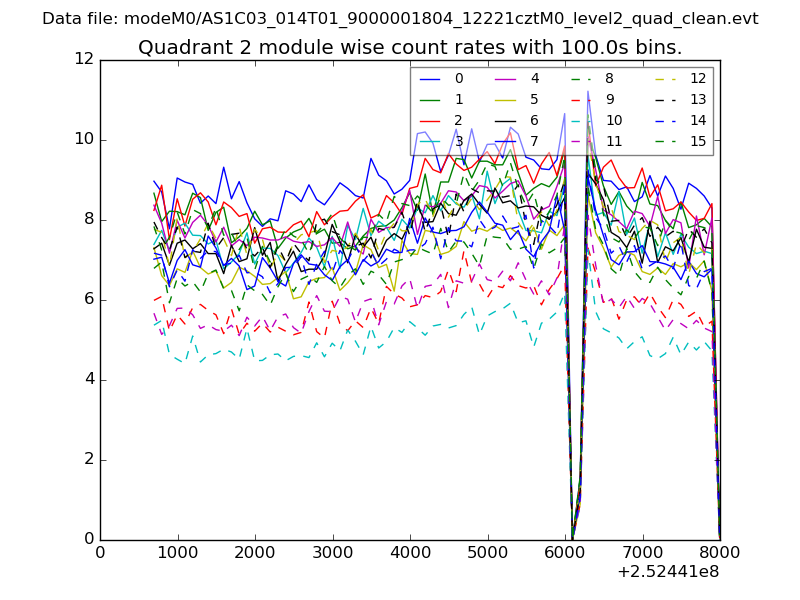 |
 |
| Module-wise count rates for Quadrant D Data is divided into 100 sec bins |
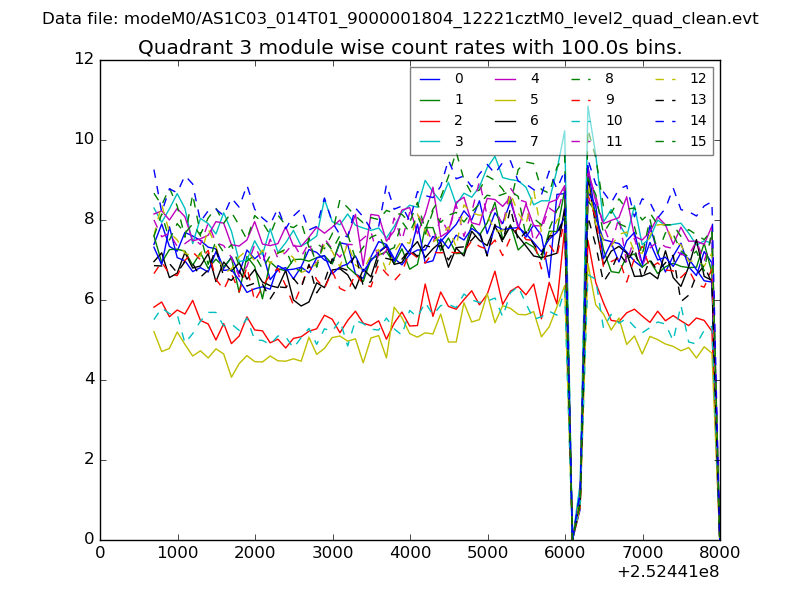 |
 |
| Parameter | Plot |
|---|---|
| CZT HV Monitor | 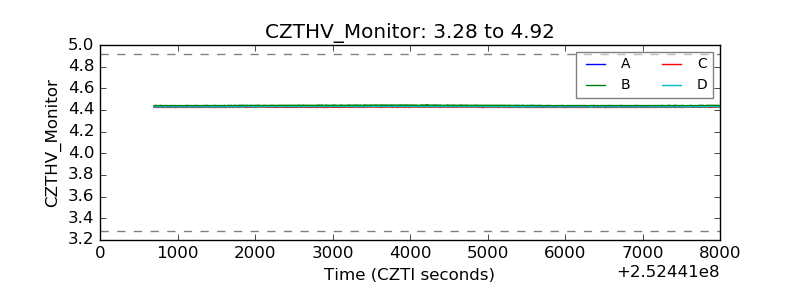 |
| D_VDD | 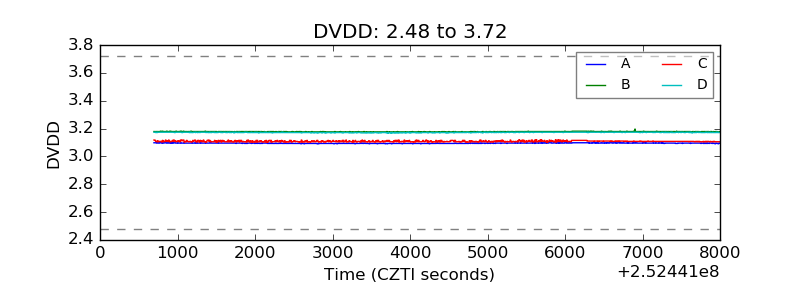 |
| Temperature 1 | 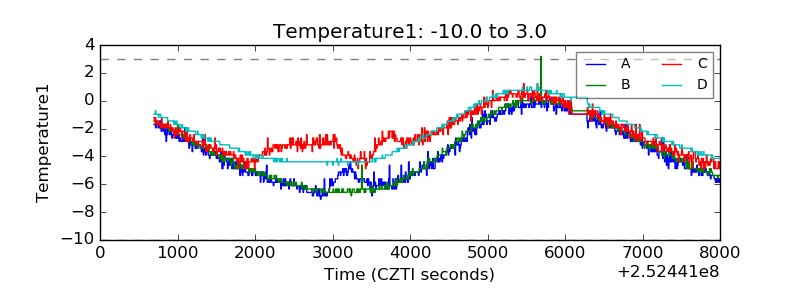 |
| Veto HV Monitor | 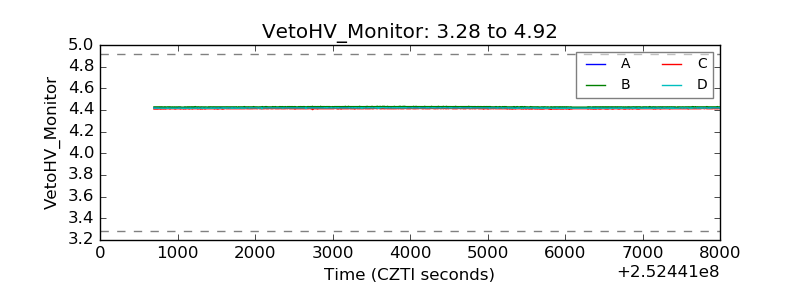 |
| Veto LLD | 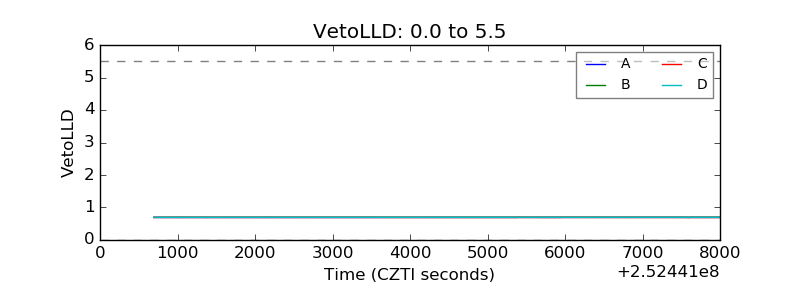 |
| Alpha Counter | 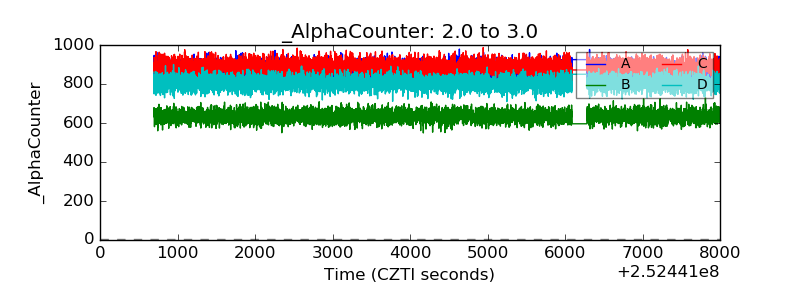 |
| _CPM_Rate | 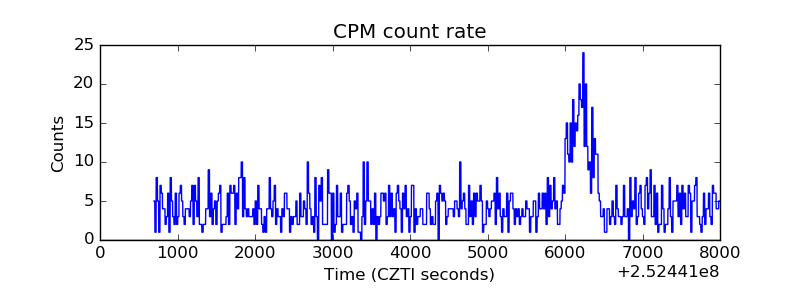 |
| CZT Counter |  |
| +2.5 Volts monitor |  |
| +5 Volts monitor |  |
| _ROLL_ROT | 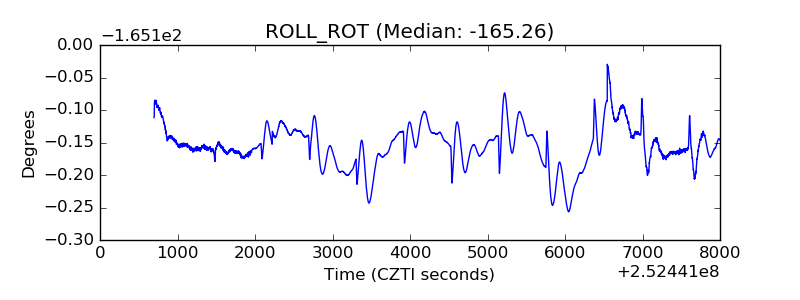 |
| _Roll_DEC | 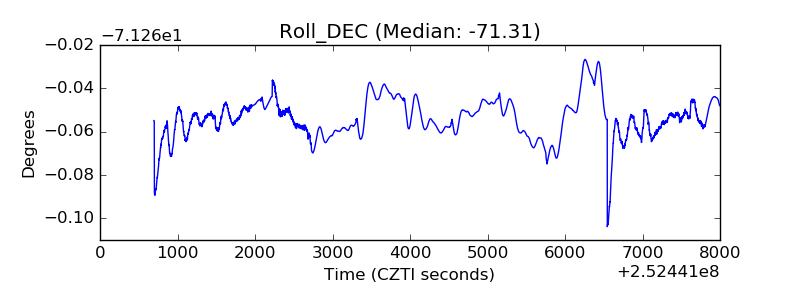 |
| _Roll_RA | 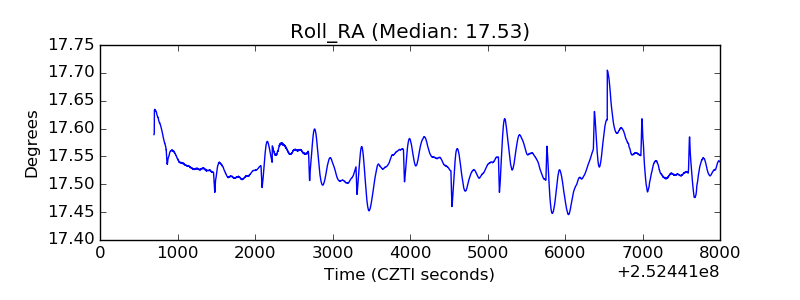 |
| Veto Counter | 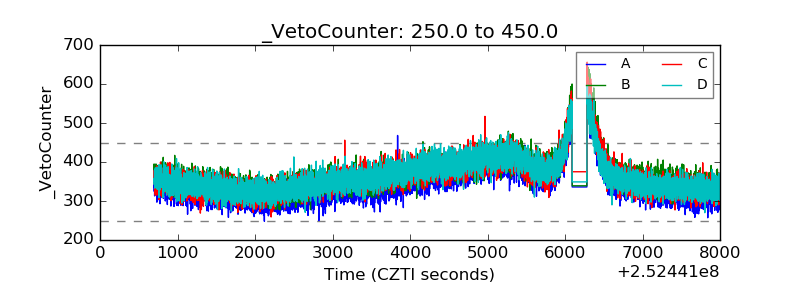 |