| Param | Original file | Final file |
|---|---|---|
| Filename | modeM0/AS1C03_014T01_9000001804_12222cztM0_level2.evt | modeM0/AS1C03_014T01_9000001804_12222cztM0_level2_quad_clean.evt |
| Size (bytes) | 235,313,280 | 52,367,040 |
| Size | 224.4 MB | 49.9 MB |
| Events in quadrant A | 1,793,831 | 355,874 |
| Events in quadrant B | 2,198,524 | 322,124 |
| Events in quadrant C | 1,279,082 | 351,062 |
| Events in quadrant D | 1,644,743 | 338,219 |
| Mode M0 | |||
|---|---|---|---|
| Quadrant | BADHDUFLAG | Total packets | Discarded packets |
| A | 0 | 7438 | 2 |
| B | 0 | 8537 | 1 |
| C | 0 | 6275 | 1 |
| D | 0 | 7141 | 1 |
| Mode SS | |||
|---|---|---|---|
| Quadrant | BADHDUFLAG | Total packets | Discarded packets |
| A | 0 | 62 | 0 |
| B | 0 | 62 | 0 |
| C | 0 | 62 | 0 |
| D | 0 | 62 | 0 |
| Quadrant | Total seconds | Saturated seconds | Saturation percentage |
|---|---|---|---|
| A | 3060 | 114 | 3.725490% |
| B | 3060 | 436 | 14.248366% |
| C | 3060 | 18 | 0.588235% |
| D | 3060 | 35 | 1.143791% |
Noise dominated data is calculated using 1-second bins in cleaned event files. If a bin has >2000 counts, and if more than 50% of those come from <1% of pixels, then it is considered to be noise-dominated and hence unusable.
| Quadrant | # 1 sec bins | Bins with >0 counts | Bins with >2000 counts | High rate bins dominated by noise | Noise dominated (total time) | Noise dominated (detector-on time) | Marked lightcurve |
|---|---|---|---|---|---|---|---|
| A | 3061 | 3061 | 14 | 14 | 0.46% | 0.46% | 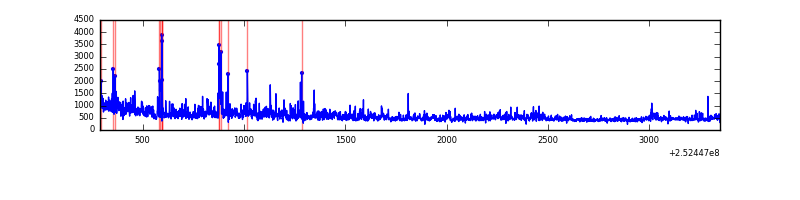 |
| B | 3061 | 3061 | 203 | 203 | 6.63% | 6.63% | 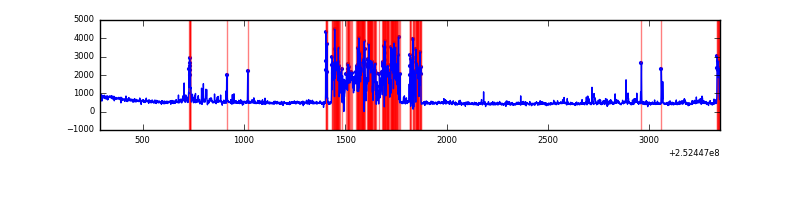 |
| C | 3061 | 3061 | 2 | 2 | 0.07% | 0.07% | 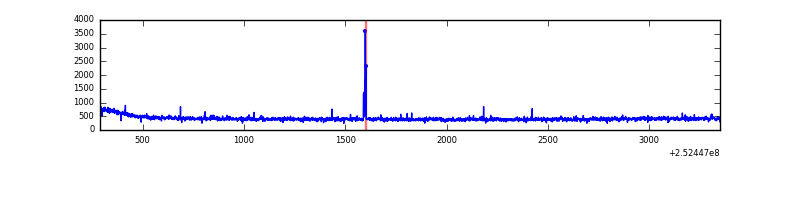 |
| D | 3061 | 3061 | 23 | 23 | 0.75% | 0.75% | 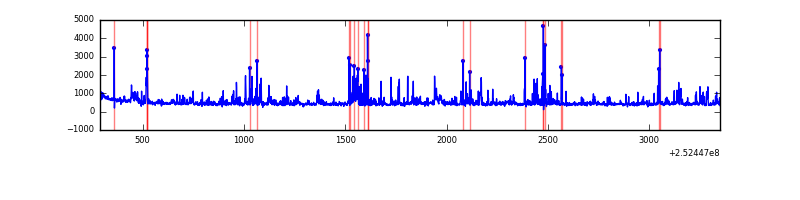 |
Top three noisy pixels from each quadrant. If the there are fewer than three noisy pixels in the level2.evt file, extra rows are filled as -1
| Pixel properties | Quadrant properties | ||||||
|---|---|---|---|---|---|---|---|
| Quadrant | DetID | PixID | Counts | Sigma | Mean | Median | Sigma |
| A | 13 | 251 | 128749 | 1850.43 | 329 | 322 | 69.4 |
| A | 1 | 162 | 118758 | 1706.48 | 329 | 322 | 69.4 |
| A | 1 | 178 | 66727 | 956.79 | 329 | 322 | 69.4 |
| B | 4 | 239 | 797080 | 13610.19 | 304 | 297 | 58.5 |
| B | 4 | 206 | 107021 | 1823.0 | 304 | 297 | 58.5 |
| B | 0 | 228 | 22210 | 374.31 | 304 | 297 | 58.5 |
| C | 15 | 208 | 19231 | 251.81 | 320 | 321 | 75.1 |
| C | 4 | 175 | 4920 | 61.24 | 320 | 321 | 75.1 |
| C | 13 | 61 | 2387 | 27.51 | 320 | 321 | 75.1 |
| D | 1 | 52 | 131862 | 1695.88 | 315 | 305 | 77.6 |
| D | 13 | 249 | 54618 | 700.14 | 315 | 305 | 77.6 |
| D | 10 | 199 | 53006 | 679.36 | 315 | 305 | 77.6 |
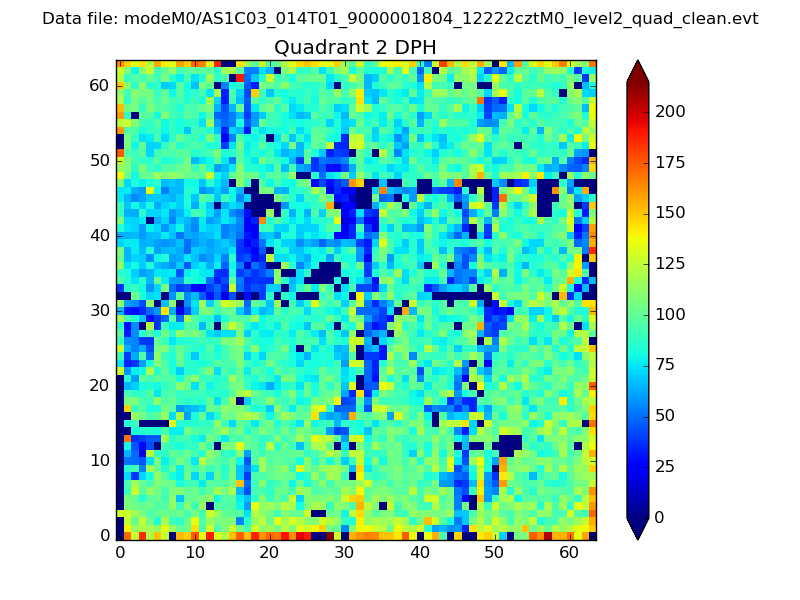
Histogram calculated using DETX and DETY for each event in the final _common_clean file
| Quadrant A |  |
 |
Quadrant B |
|---|---|---|---|
| Quadrant D | 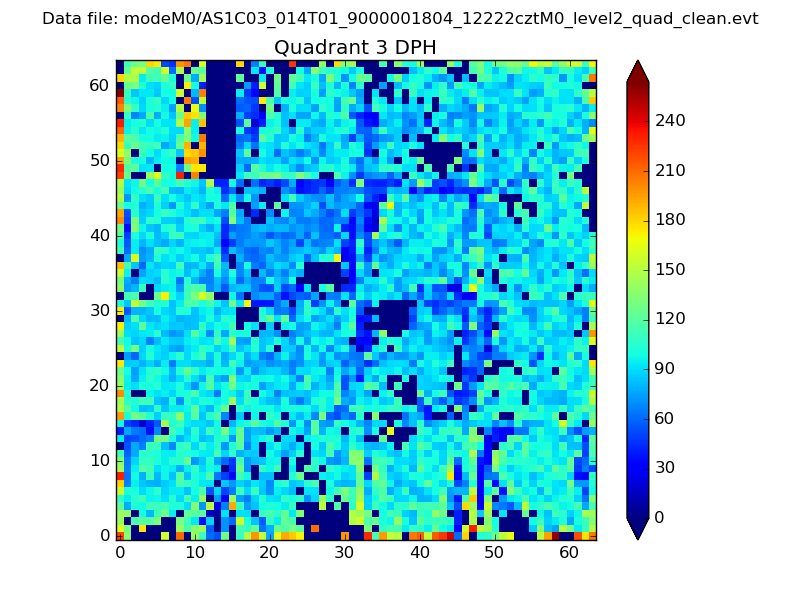 |
 |
Quadrant C |
| Plot type | Count rate plots | Images |
|---|---|---|
| Comparison with Poisson distribution Blue bars denote a histogram of data divided into 1 sec bins. Red curve is a Poisson curve with rate = median count rate of data. |
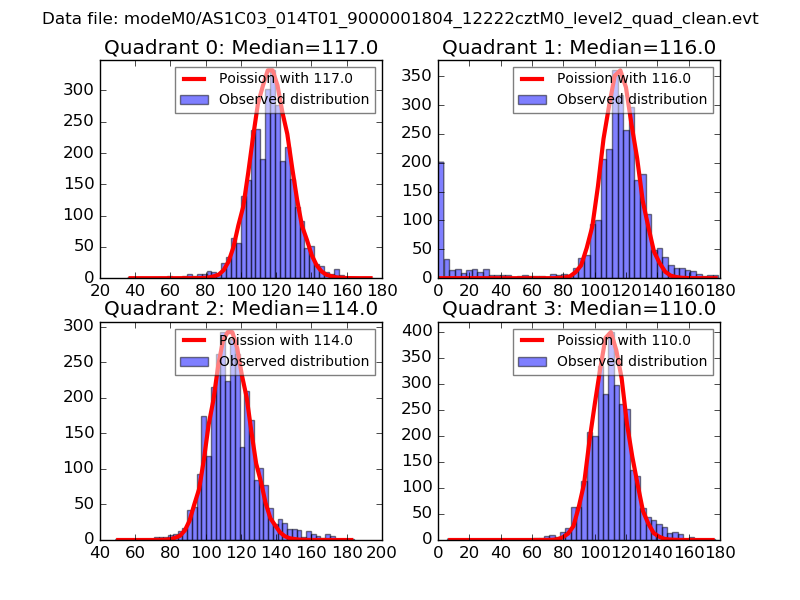 |
 |
| Quadrant-wise count rates Data is divided into 100 sec bins |
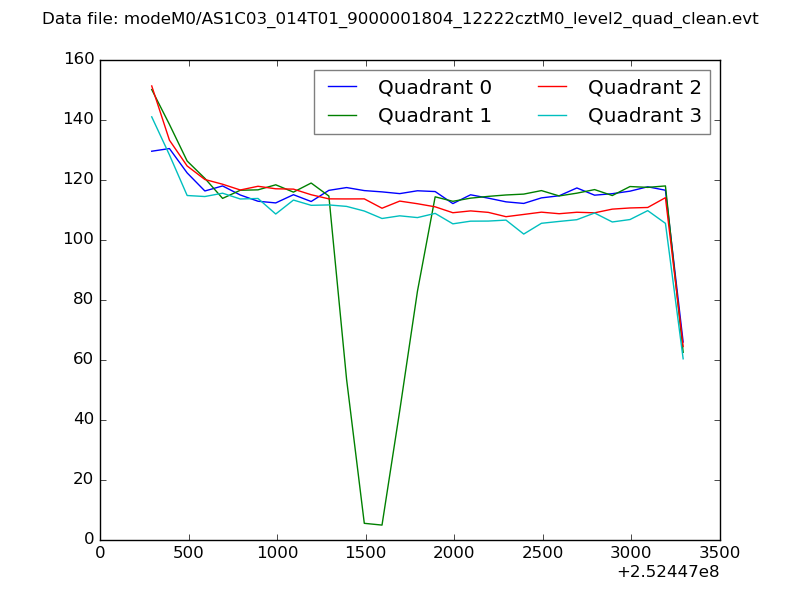 |
|
| Module-wise count rates for Quadrant A Data is divided into 100 sec bins |
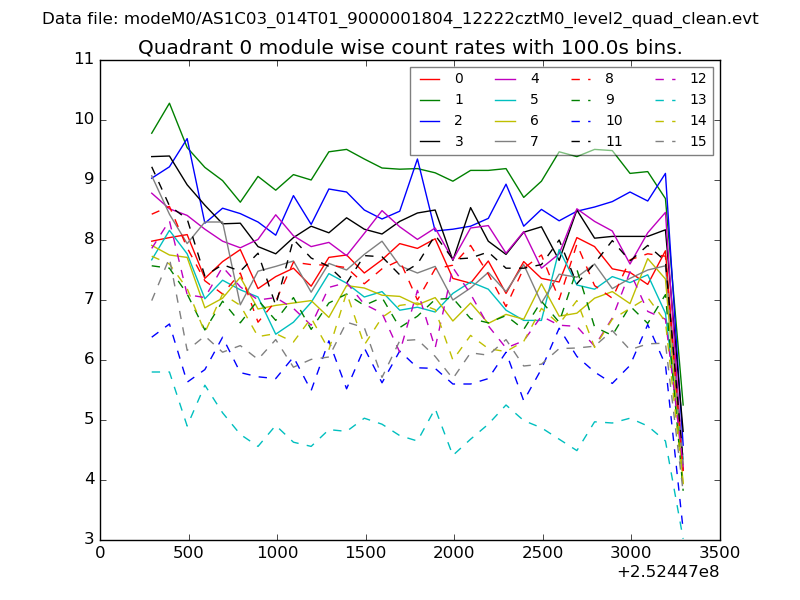 |
 |
| Module-wise count rates for Quadrant B Data is divided into 100 sec bins |
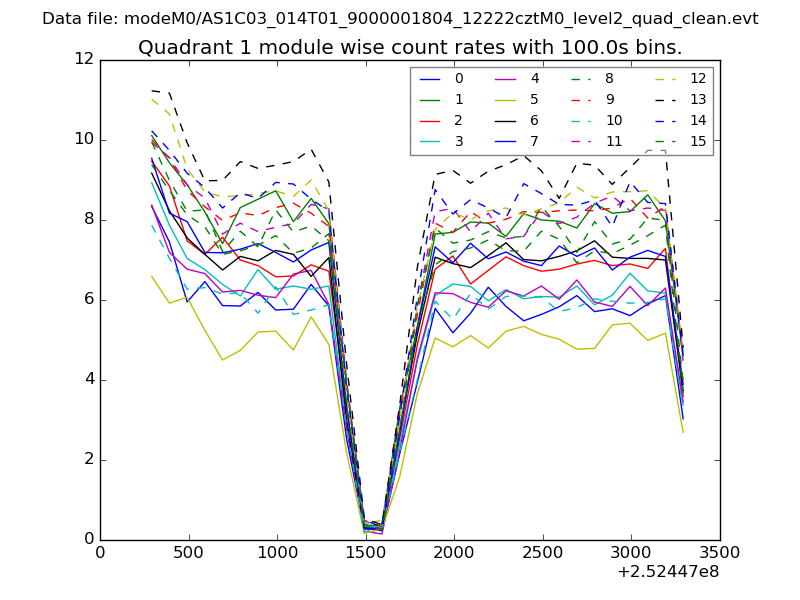 |
 |
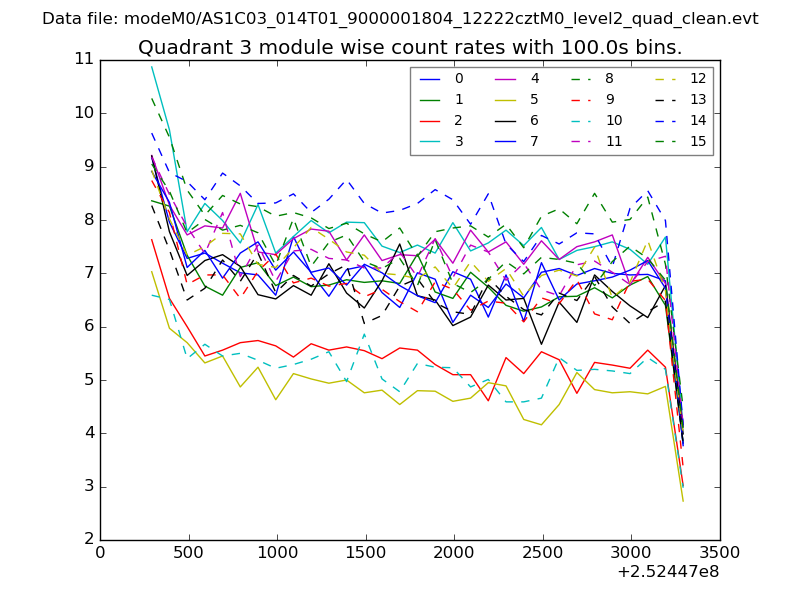
| Module-wise count rates for Quadrant C Data is divided into 100 sec bins |
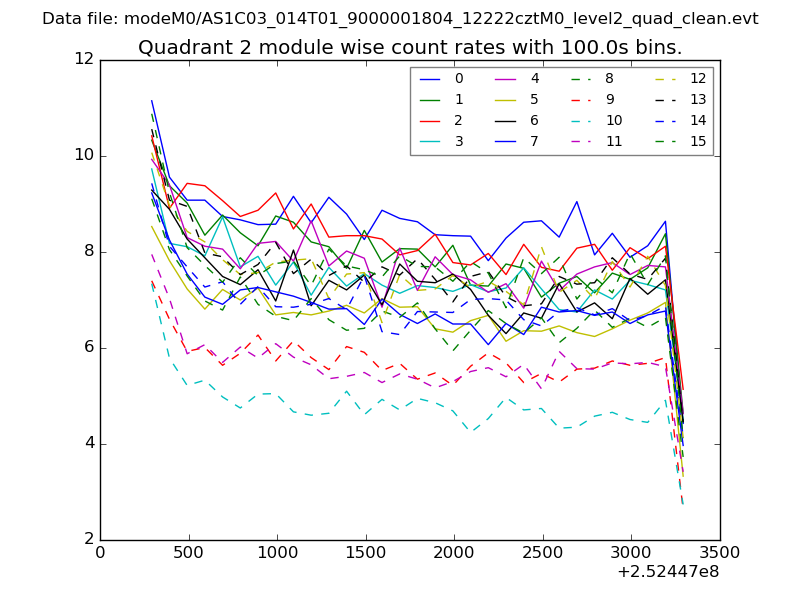 |
 |
| Module-wise count rates for Quadrant D Data is divided into 100 sec bins |
 |
 |
| Parameter | Plot |
|---|---|
| CZT HV Monitor | 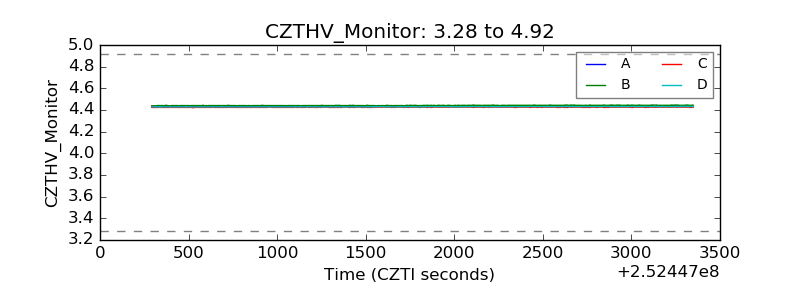 |
| D_VDD | 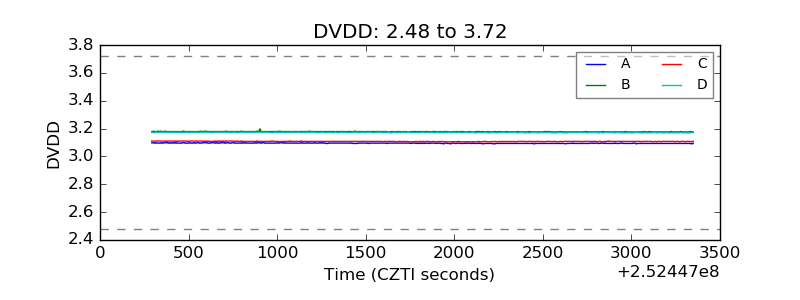 |
| Temperature 1 | 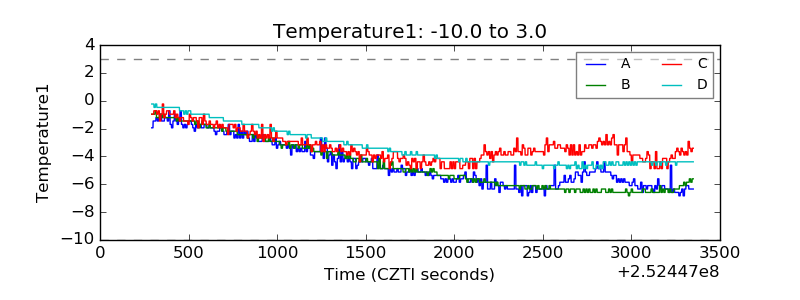 |
| Veto HV Monitor | 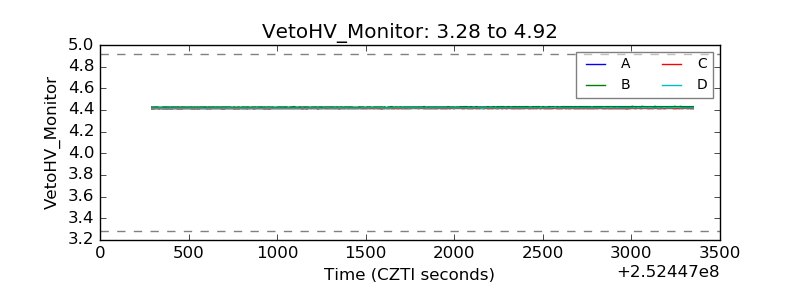 |
| Veto LLD | 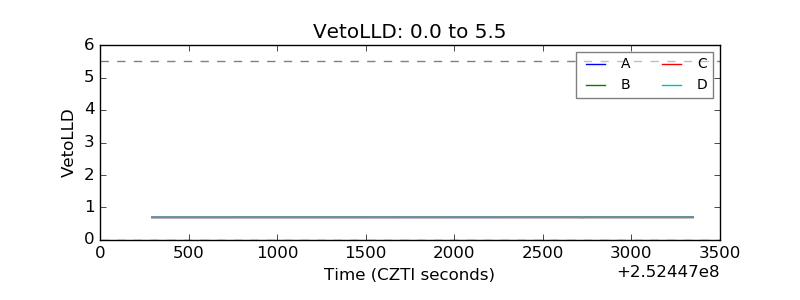 |
| Alpha Counter | 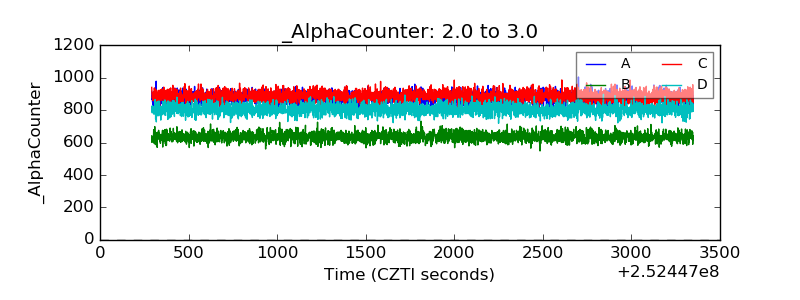 |
| _CPM_Rate | 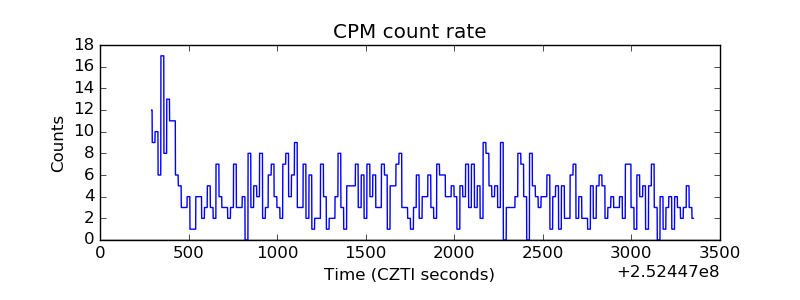 |
| CZT Counter | 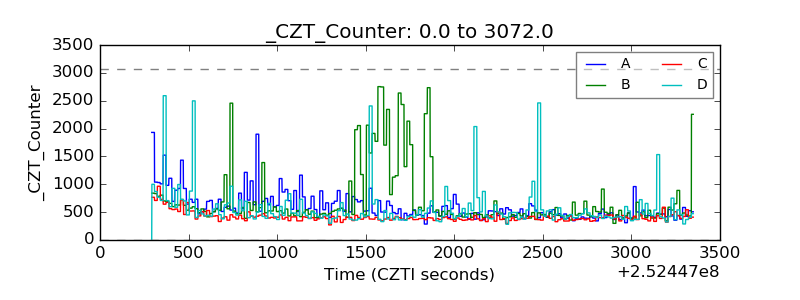 |
| +2.5 Volts monitor |  |
| +5 Volts monitor | 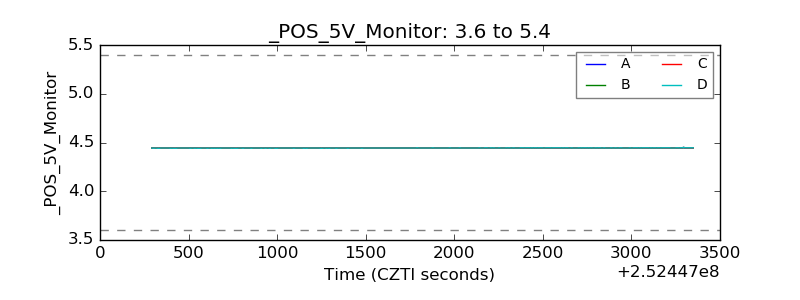 |
| _ROLL_ROT | 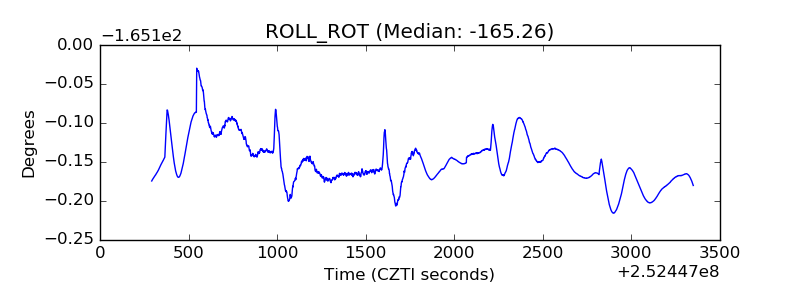 |
| _Roll_DEC | 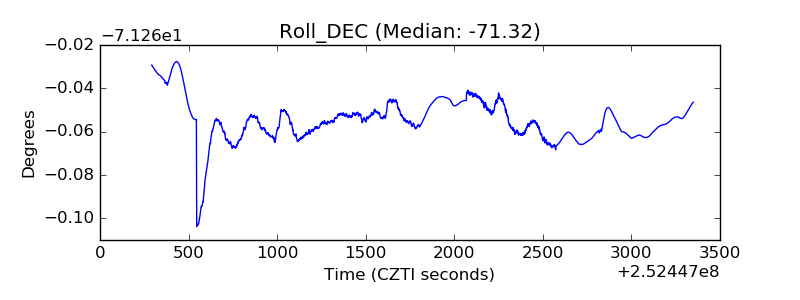 |
| _Roll_RA | 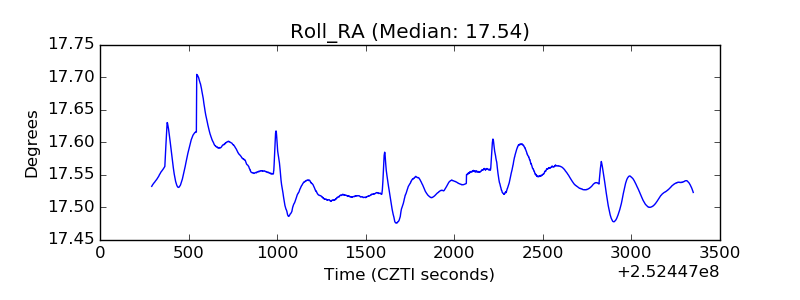 |
| Veto Counter |  |