| Param | Original file | Final file |
|---|---|---|
| Filename | modeM0/AS1C03_014T01_9000001804_12224cztM0_level2.evt | modeM0/AS1C03_014T01_9000001804_12224cztM0_level2_quad_clean.evt |
| Size (bytes) | 1,465,698,240 | 279,702,720 |
| Size | 1.4 GB | 266.7 MB |
| Events in quadrant A | 12,642,313 | 1,865,836 |
| Events in quadrant B | 14,702,293 | 1,772,909 |
| Events in quadrant C | 7,140,178 | 1,904,005 |
| Events in quadrant D | 8,827,856 | 1,827,008 |
| Mode M0 | |||
|---|---|---|---|
| Quadrant | BADHDUFLAG | Total packets | Discarded packets |
| A | 0 | 48189 | 4 |
| B | 0 | 54564 | 3 |
| C | 0 | 32521 | 3 |
| D | 0 | 37422 | 3 |
| Mode SS | |||
|---|---|---|---|
| Quadrant | BADHDUFLAG | Total packets | Discarded packets |
| A | 0 | 326 | 0 |
| B | 0 | 326 | 0 |
| C | 0 | 326 | 0 |
| D | 0 | 326 | 0 |
| Mode M9 | |||
|---|---|---|---|
| Quadrant | BADHDUFLAG | Total packets | Discarded packets |
| A | 0 | 17 | 0 |
| B | 0 | 17 | 0 |
| C | 0 | 17 | 0 |
| D | 0 | 17 | 0 |
| Quadrant | Total seconds | Saturated seconds | Saturation percentage |
|---|---|---|---|
| A | 15956 | 1171 | 7.338932% |
| B | 15956 | 2649 | 16.601905% |
| C | 15956 | 78 | 0.488844% |
| D | 15956 | 387 | 2.425420% |
Noise dominated data is calculated using 1-second bins in cleaned event files. If a bin has >2000 counts, and if more than 50% of those come from <1% of pixels, then it is considered to be noise-dominated and hence unusable.
| Quadrant | # 1 sec bins | Bins with >0 counts | Bins with >2000 counts | High rate bins dominated by noise | Noise dominated (total time) | Noise dominated (detector-on time) | Marked lightcurve |
|---|---|---|---|---|---|---|---|
| A | 17692 | 15960 | 754 | 754 | 4.26% | 4.72% | 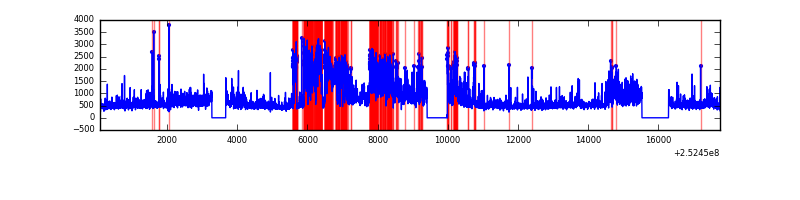 |
| B | 17692 | 15958 | 1541 | 1541 | 8.71% | 9.66% | 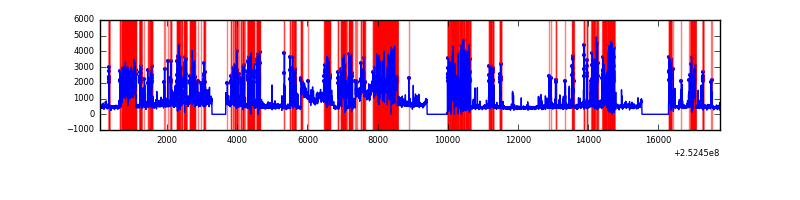 |
| C | 17692 | 15960 | 12 | 12 | 0.07% | 0.08% | 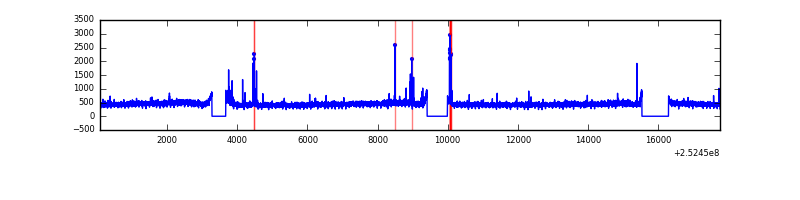 |
| D | 17692 | 15959 | 204 | 204 | 1.15% | 1.28% | 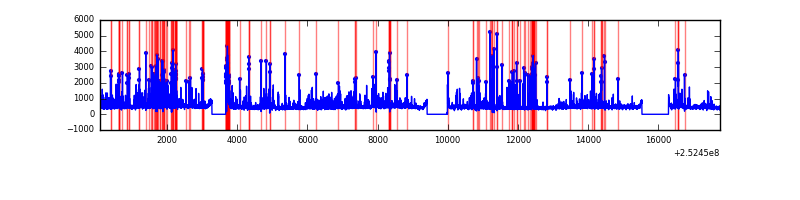 |
Top three noisy pixels from each quadrant. If the there are fewer than three noisy pixels in the level2.evt file, extra rows are filled as -1
| Pixel properties | Quadrant properties | ||||||
|---|---|---|---|---|---|---|---|
| Quadrant | DetID | PixID | Counts | Sigma | Mean | Median | Sigma |
| A | 15 | 249 | 2234107 | 6055.59 | 1814 | 1774 | 368.6 |
| A | 8 | 15 | 2004180 | 5431.88 | 1814 | 1774 | 368.6 |
| A | 13 | 251 | 386003 | 1042.29 | 1814 | 1774 | 368.6 |
| B | 4 | 239 | 3982096 | 12366.08 | 1716 | 1672 | 321.9 |
| B | 4 | 206 | 2196038 | 6817.29 | 1716 | 1672 | 321.9 |
| B | 3 | 64 | 1174780 | 3644.52 | 1716 | 1672 | 321.9 |
| C | 15 | 208 | 98818 | 235.6 | 1786 | 1796 | 411.8 |
| C | 4 | 175 | 28961 | 65.97 | 1786 | 1796 | 411.8 |
| C | 5 | 112 | 13665 | 28.82 | 1786 | 1796 | 411.8 |
| D | 1 | 52 | 965847 | 2259.77 | 1772 | 1715 | 426.6 |
| D | 10 | 50 | 252689 | 588.24 | 1772 | 1715 | 426.6 |
| D | 14 | 34 | 205934 | 478.66 | 1772 | 1715 | 426.6 |
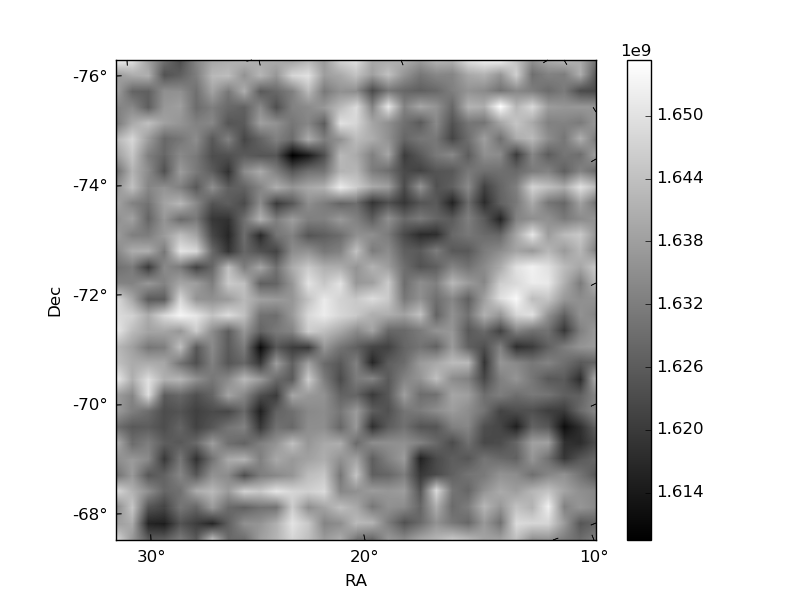
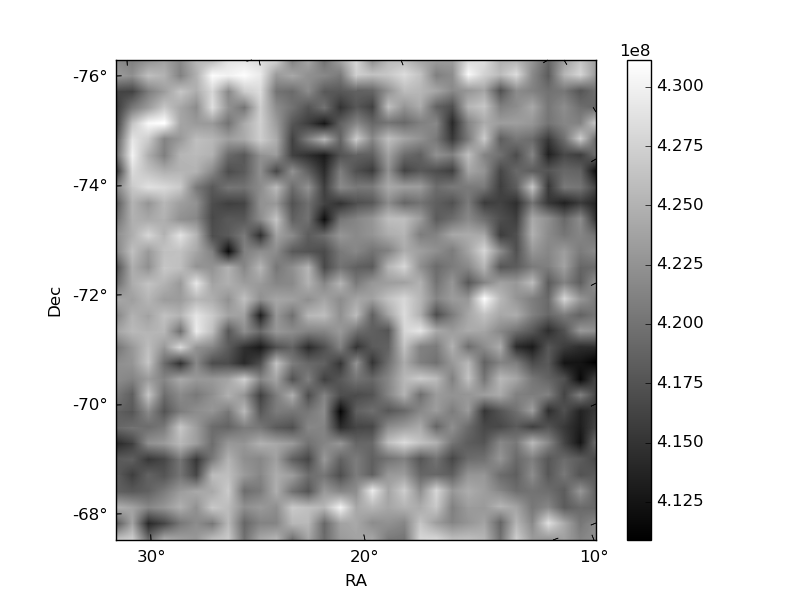
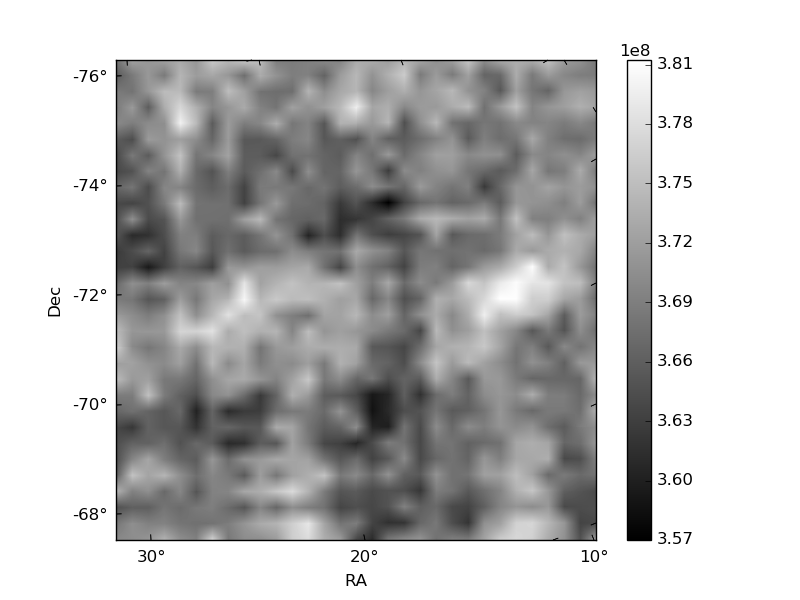
Histogram calculated using DETX and DETY for each event in the final _common_clean file
| Quadrant A | 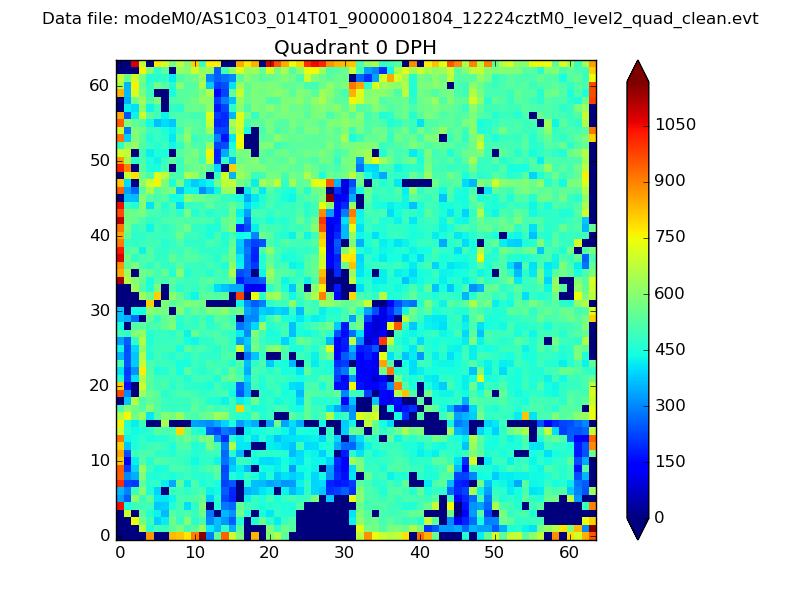 |
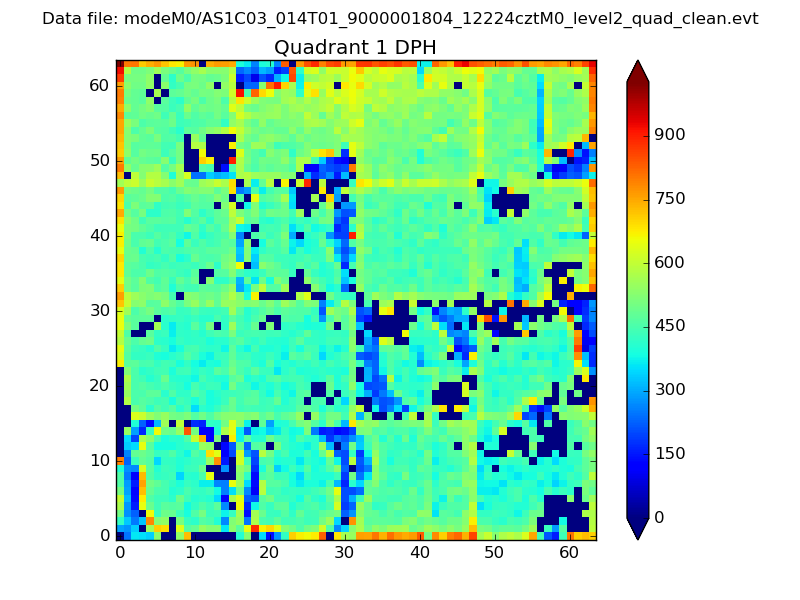 |
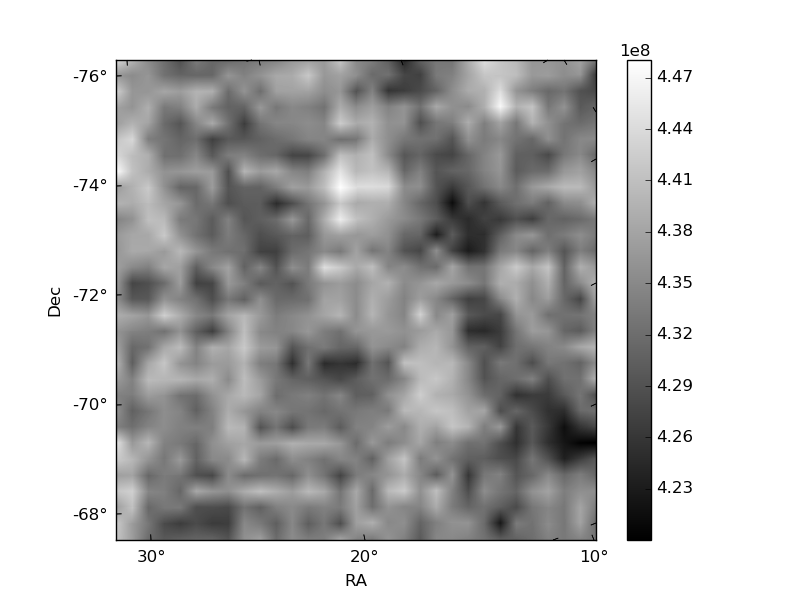
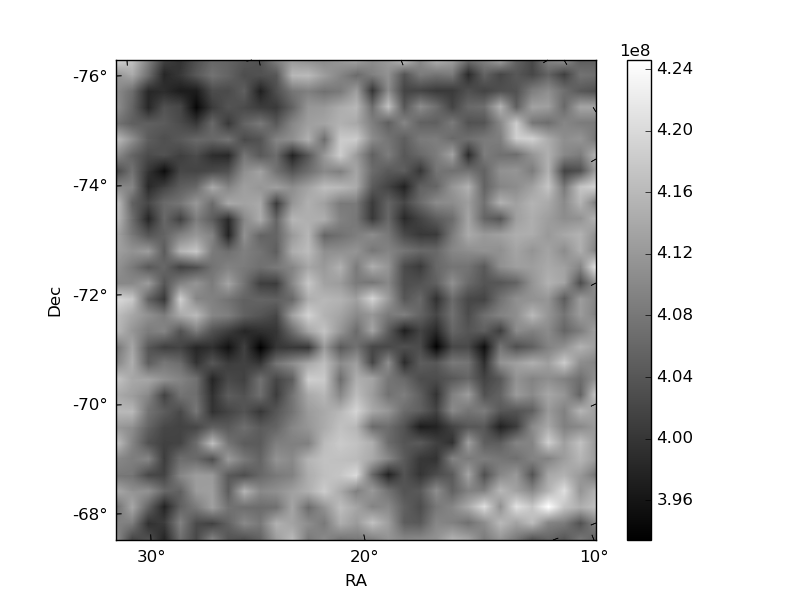
Quadrant B |
|---|---|---|---|
| Quadrant D | 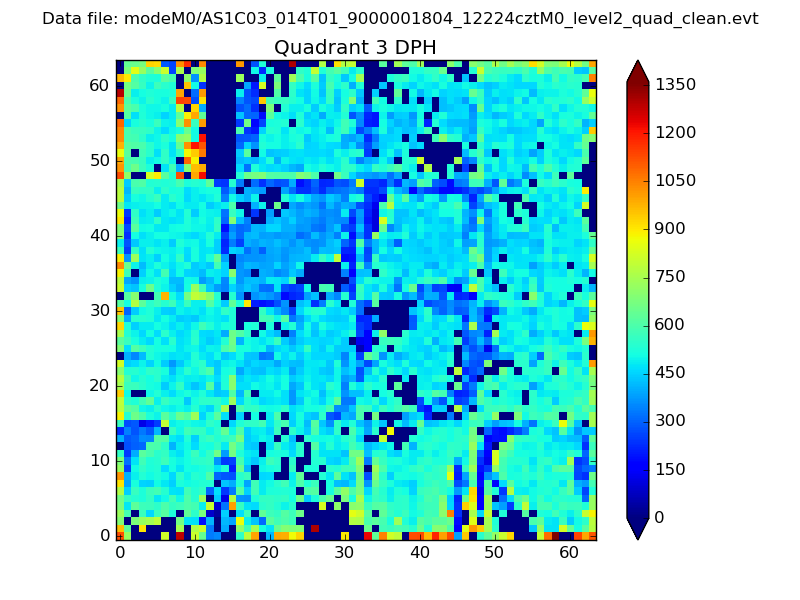 |
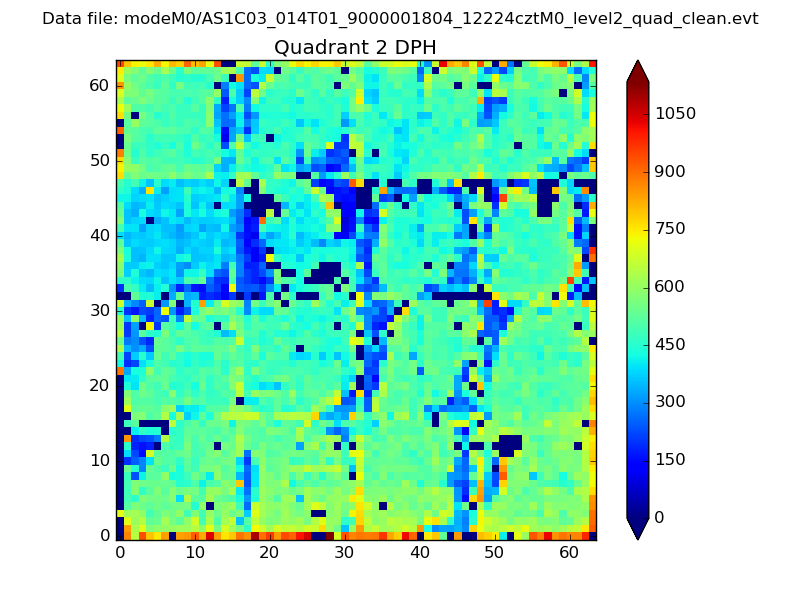 |
Quadrant C |
| Plot type | Count rate plots | Images |
|---|---|---|
| Comparison with Poisson distribution Blue bars denote a histogram of data divided into 1 sec bins. Red curve is a Poisson curve with rate = median count rate of data. |
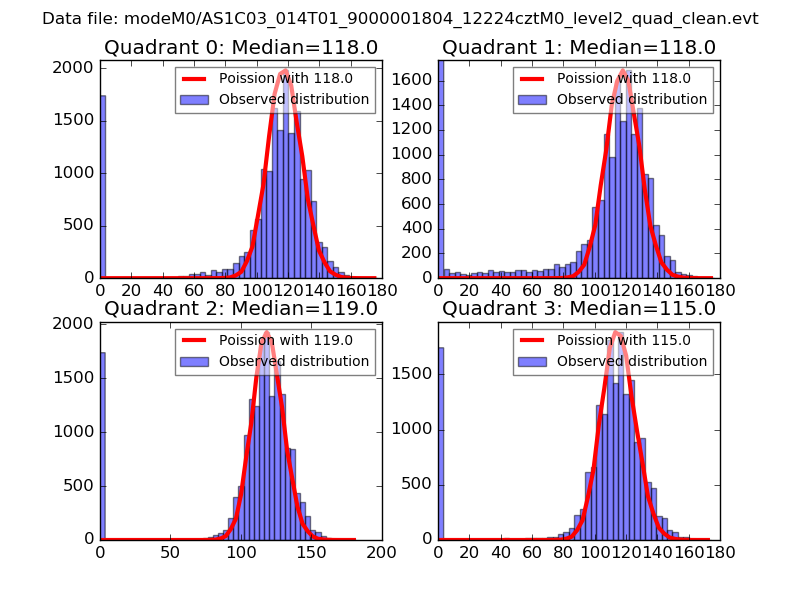 |
 |
| Quadrant-wise count rates Data is divided into 100 sec bins |
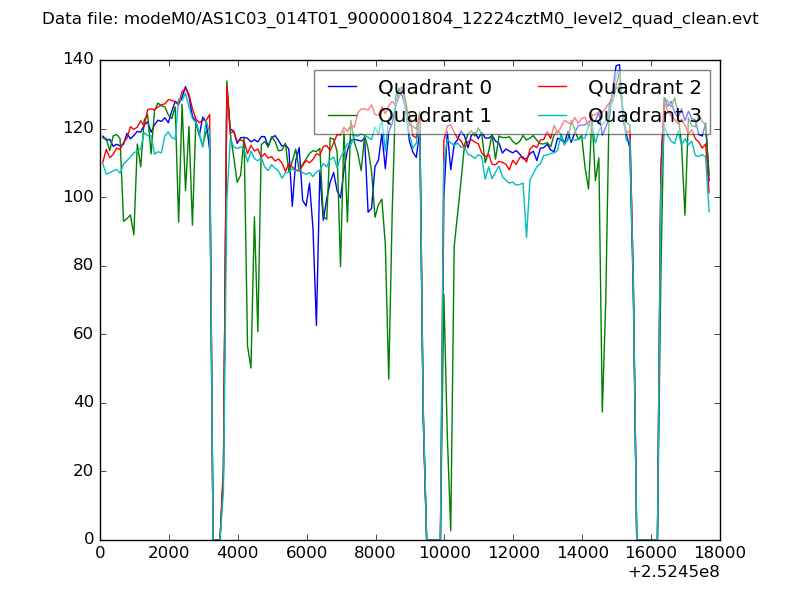 |
|
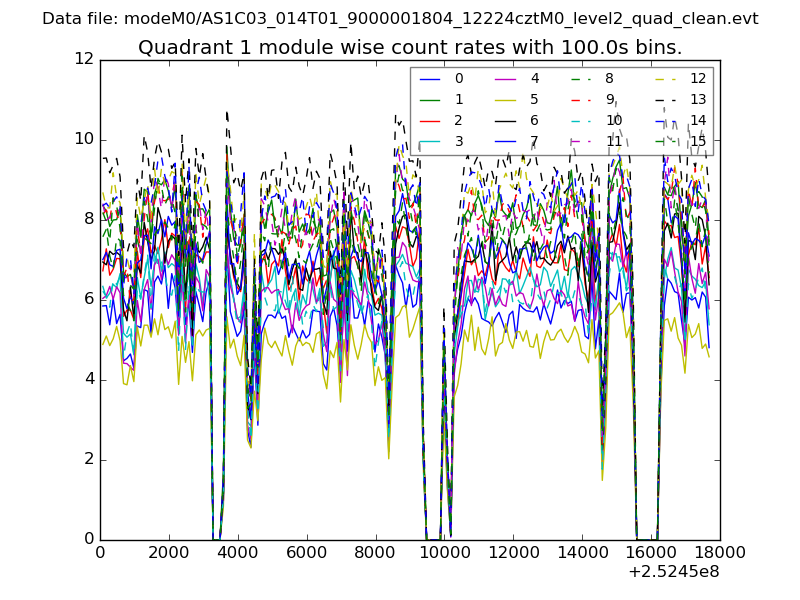
| Module-wise count rates for Quadrant A Data is divided into 100 sec bins |
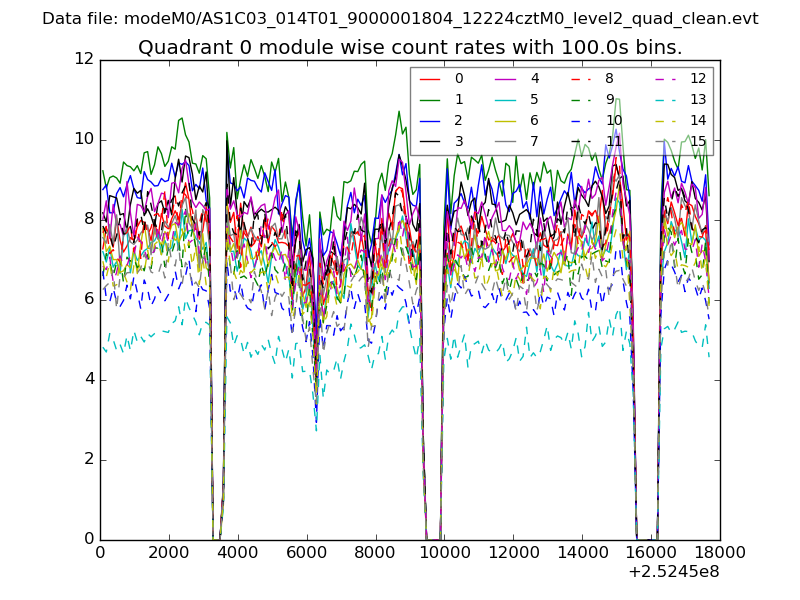 |
 |
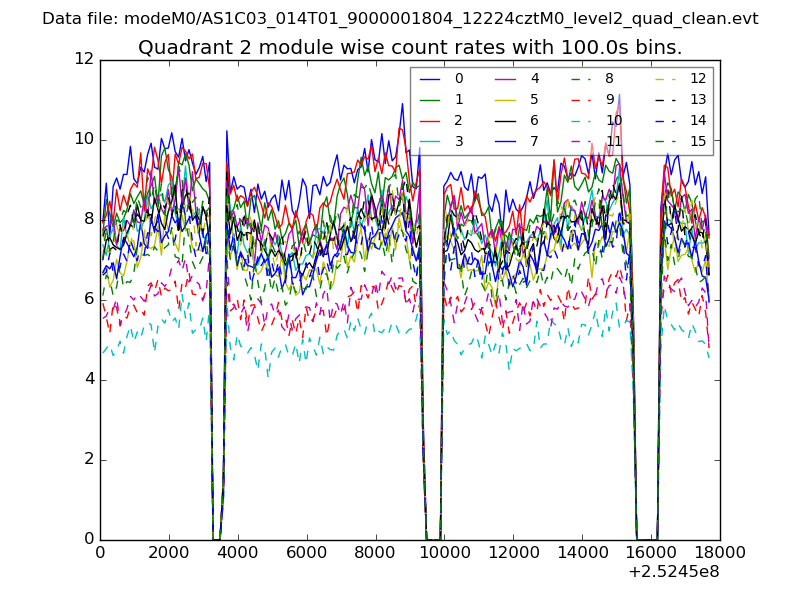
| Module-wise count rates for Quadrant B Data is divided into 100 sec bins |
 |
 |
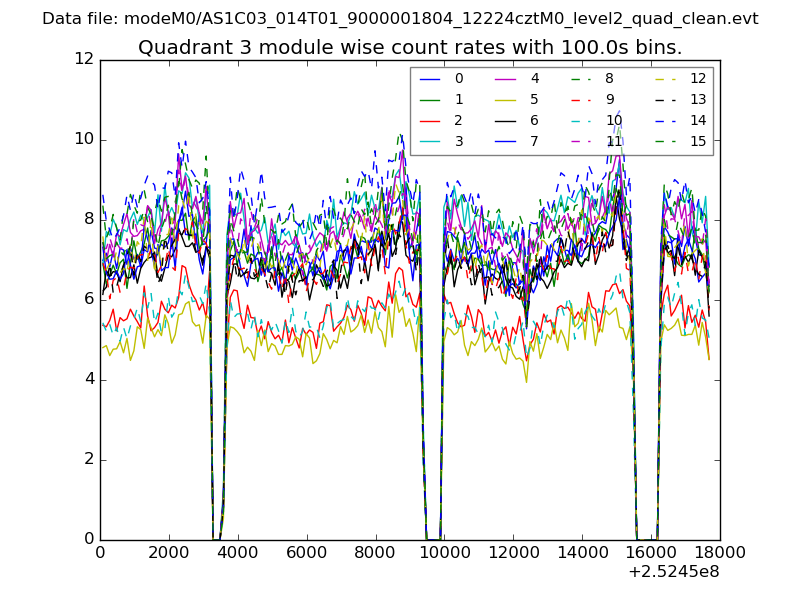
| Module-wise count rates for Quadrant C Data is divided into 100 sec bins |
 |
 |
| Module-wise count rates for Quadrant D Data is divided into 100 sec bins |
 |
 |
| Parameter | Plot |
|---|---|
| CZT HV Monitor | 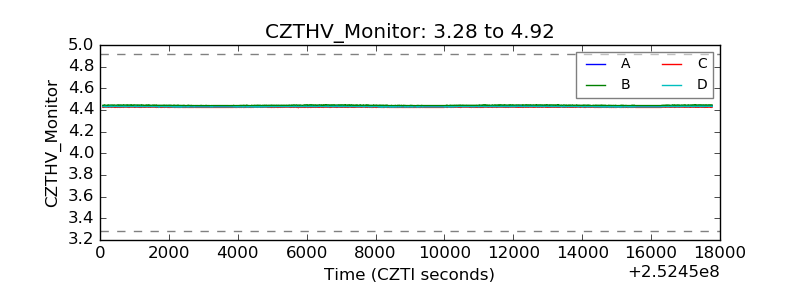 |
| D_VDD | 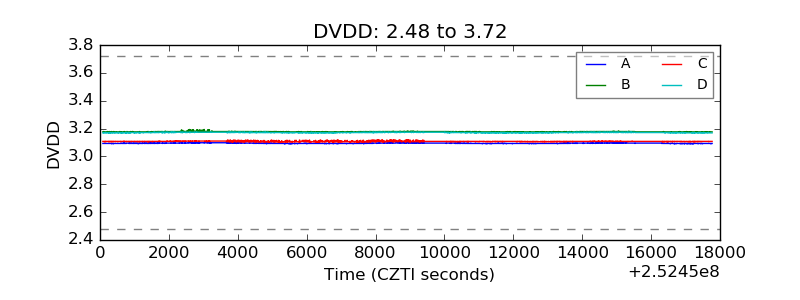 |
| Temperature 1 | 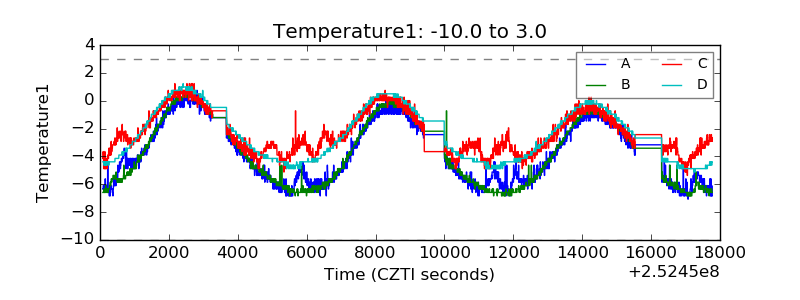 |
| Veto HV Monitor | 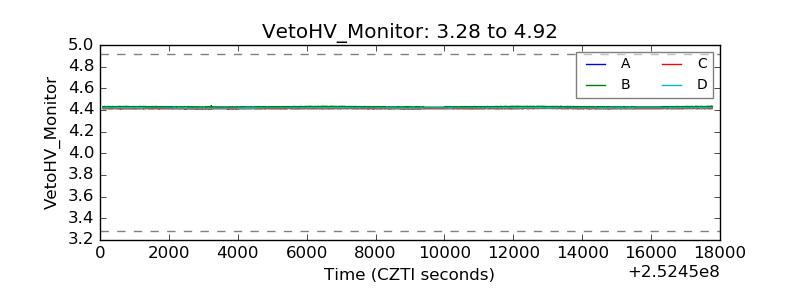 |
| Veto LLD | 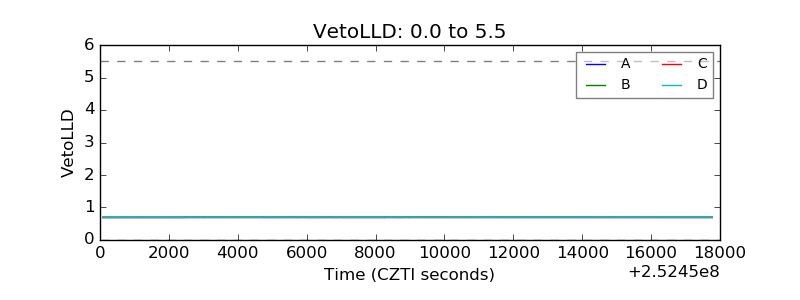 |
| Alpha Counter | 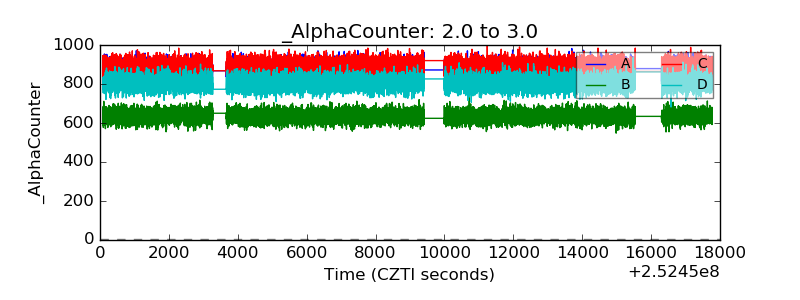 |
| _CPM_Rate | 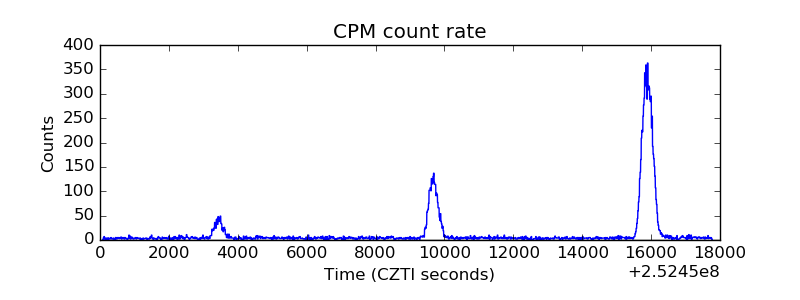 |
| CZT Counter | 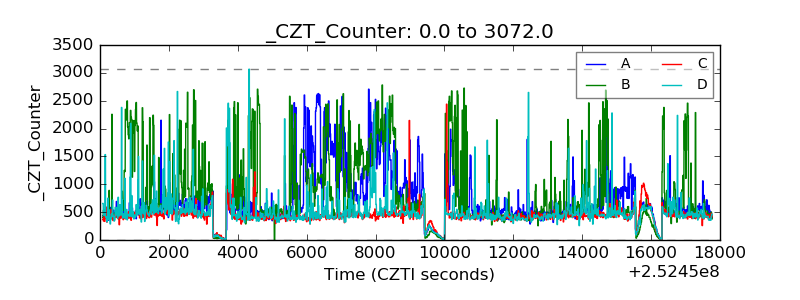 |
| +2.5 Volts monitor | 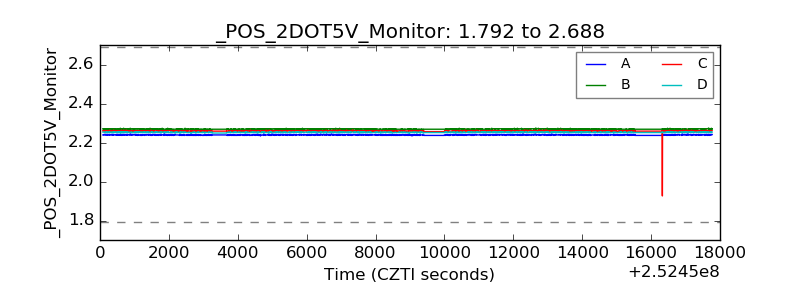 |
| +5 Volts monitor |  |
| _ROLL_ROT | 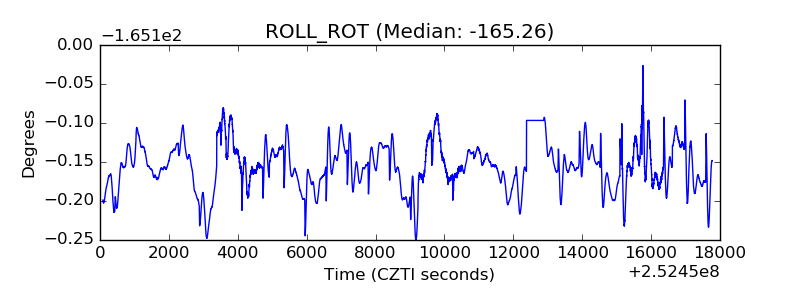 |
| _Roll_DEC | 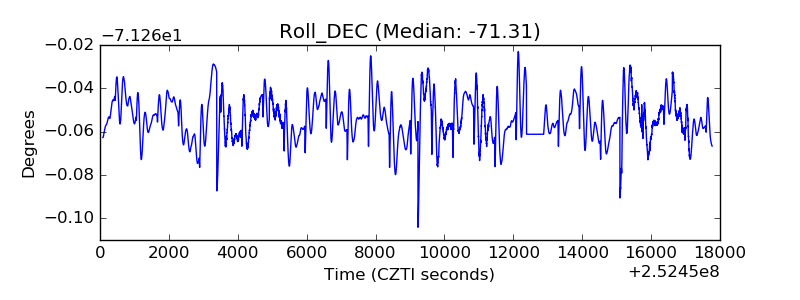 |
| _Roll_RA | 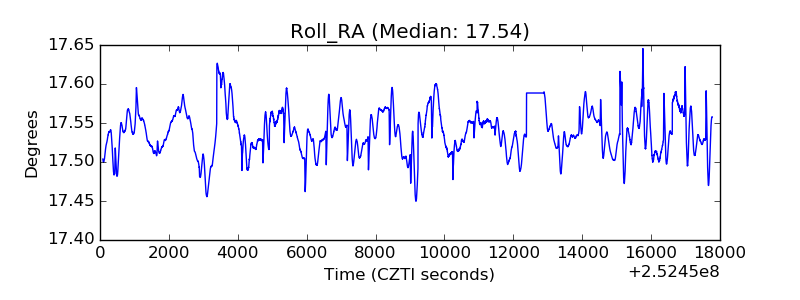 |
| Veto Counter | 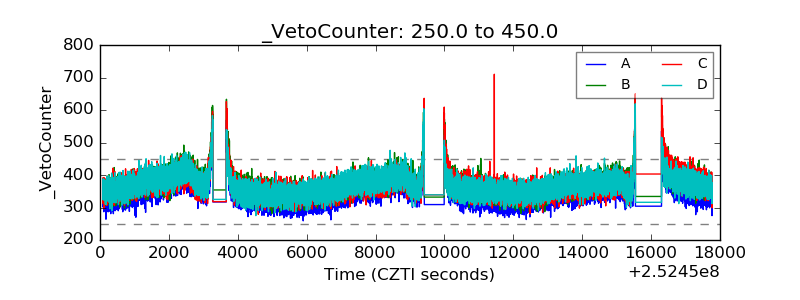 |