| Param | Original file | Final file |
|---|---|---|
| Filename | modeM0/AS1C03_014T01_9000001804_12225cztM0_level2.evt | modeM0/AS1C03_014T01_9000001804_12225cztM0_level2_quad_clean.evt |
| Size (bytes) | 358,191,360 | 85,847,040 |
| Size | 341.6 MB | 81.9 MB |
| Events in quadrant A | 2,646,855 | 575,266 |
| Events in quadrant B | 3,449,439 | 553,967 |
| Events in quadrant C | 2,064,596 | 576,534 |
| Events in quadrant D | 2,357,667 | 554,571 |
| Mode M0 | |||
|---|---|---|---|
| Quadrant | BADHDUFLAG | Total packets | Discarded packets |
| A | 0 | 11003 | 0 |
| B | 0 | 13578 | 0 |
| C | 0 | 9681 | 0 |
| D | 0 | 10499 | 0 |
| Mode SS | |||
|---|---|---|---|
| Quadrant | BADHDUFLAG | Total packets | Discarded packets |
| A | 0 | 96 | 0 |
| B | 0 | 96 | 0 |
| C | 0 | 96 | 0 |
| D | 0 | 96 | 0 |
| Quadrant | Total seconds | Saturated seconds | Saturation percentage |
|---|---|---|---|
| A | 4836 | 25 | 0.516956% |
| B | 4836 | 440 | 9.098428% |
| C | 4836 | 3 | 0.062035% |
| D | 4836 | 4 | 0.082713% |
Noise dominated data is calculated using 1-second bins in cleaned event files. If a bin has >2000 counts, and if more than 50% of those come from <1% of pixels, then it is considered to be noise-dominated and hence unusable.
| Quadrant | # 1 sec bins | Bins with >0 counts | Bins with >2000 counts | High rate bins dominated by noise | Noise dominated (total time) | Noise dominated (detector-on time) | Marked lightcurve |
|---|---|---|---|---|---|---|---|
| A | 4837 | 4837 | 6 | 6 | 0.12% | 0.12% | 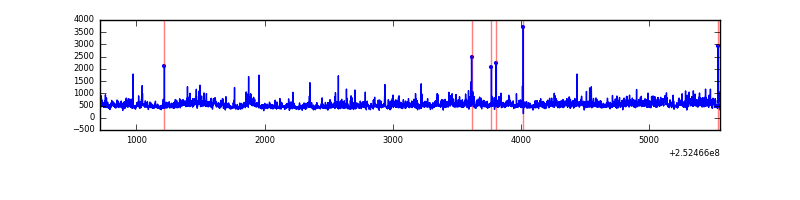 |
| B | 4837 | 4837 | 276 | 276 | 5.71% | 5.71% | 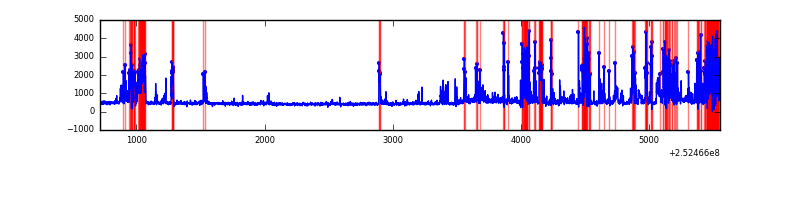 |
| C | 4837 | 4837 | 0 | 0 | 0.00% | 0.00% | 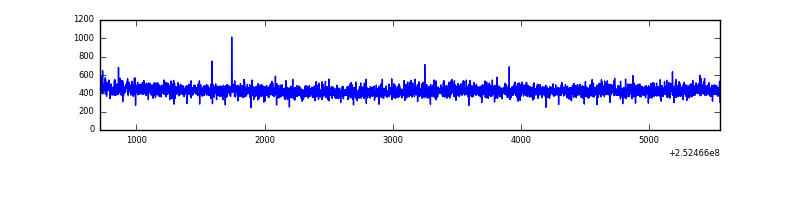 |
| D | 4837 | 4837 | 4 | 4 | 0.08% | 0.08% | 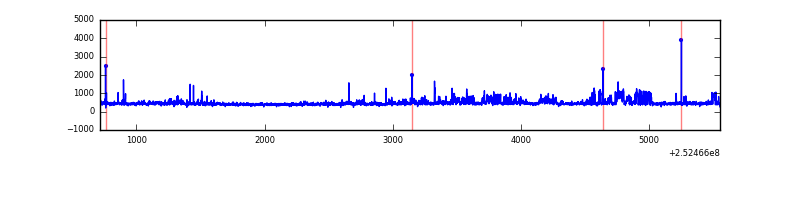 |
Top three noisy pixels from each quadrant. If the there are fewer than three noisy pixels in the level2.evt file, extra rows are filled as -1
| Pixel properties | Quadrant properties | ||||||
|---|---|---|---|---|---|---|---|
| Quadrant | DetID | PixID | Counts | Sigma | Mean | Median | Sigma |
| A | 1 | 162 | 139208 | 1257.92 | 541 | 530 | 110.2 |
| A | 8 | 15 | 83060 | 748.61 | 541 | 530 | 110.2 |
| A | 1 | 178 | 76832 | 692.12 | 541 | 530 | 110.2 |
| B | 4 | 239 | 1000595 | 10101.73 | 520 | 506 | 99.0 |
| B | 3 | 64 | 192419 | 1938.48 | 520 | 506 | 99.0 |
| B | 11 | 51 | 158881 | 1599.72 | 520 | 506 | 99.0 |
| C | 4 | 175 | 7687 | 58.23 | 526 | 527 | 123.0 |
| C | 13 | 61 | 3966 | 27.97 | 526 | 527 | 123.0 |
| C | 8 | 222 | 3420 | 23.53 | 526 | 527 | 123.0 |
| D | 1 | 52 | 234129 | 1860.75 | 524 | 509 | 125.6 |
| D | 13 | 104 | 31460 | 246.52 | 524 | 509 | 125.6 |
| D | 2 | 234 | 23506 | 183.17 | 524 | 509 | 125.6 |
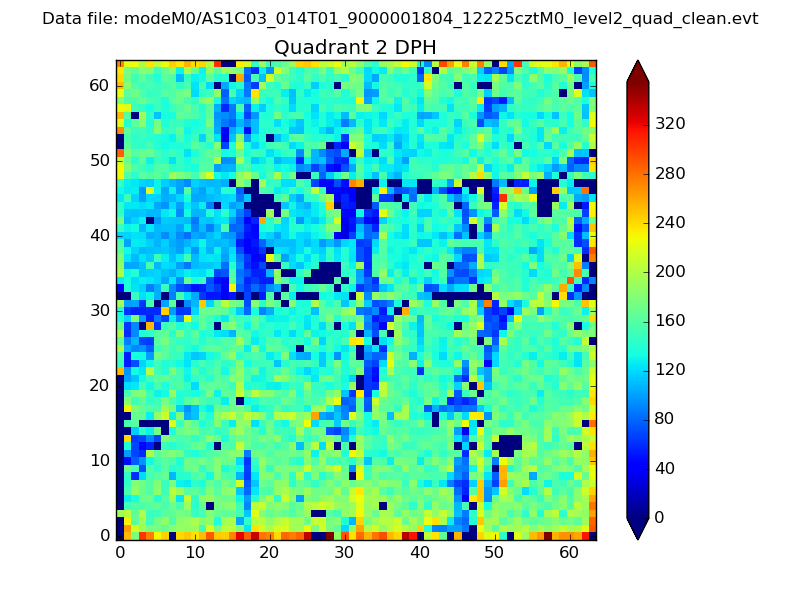
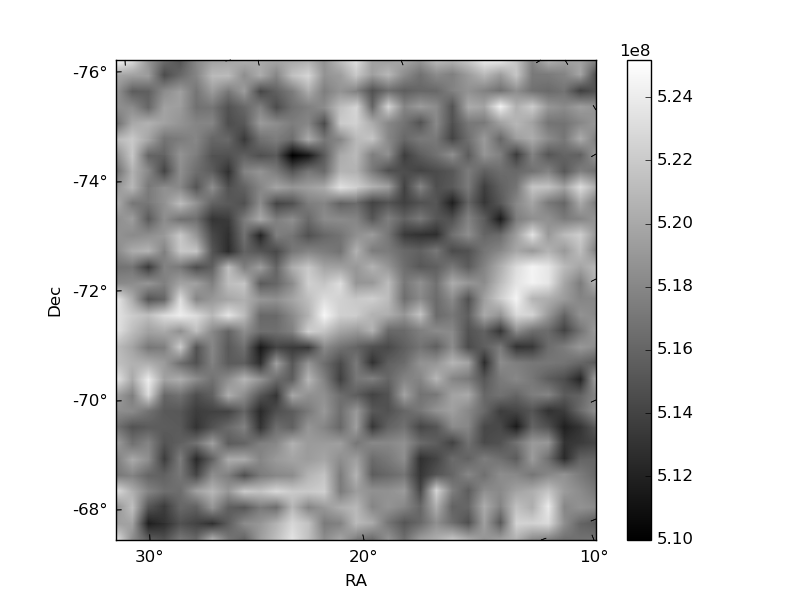
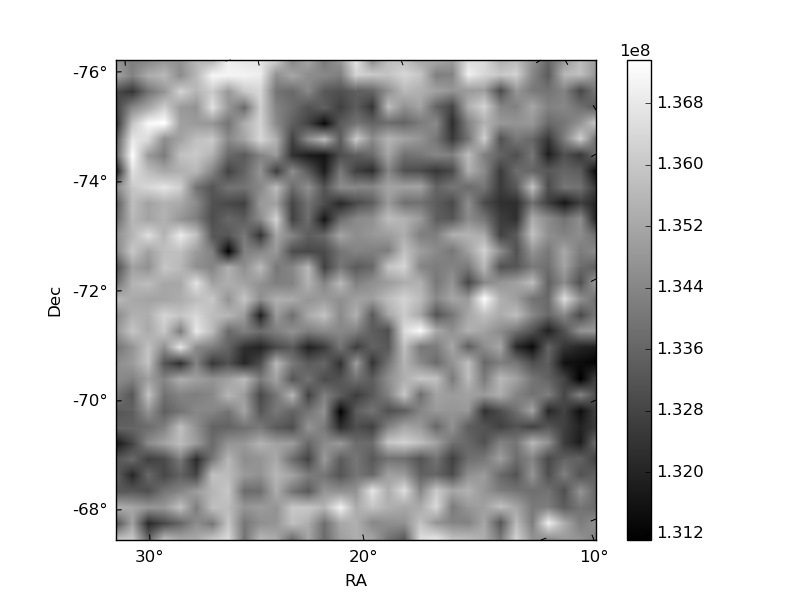
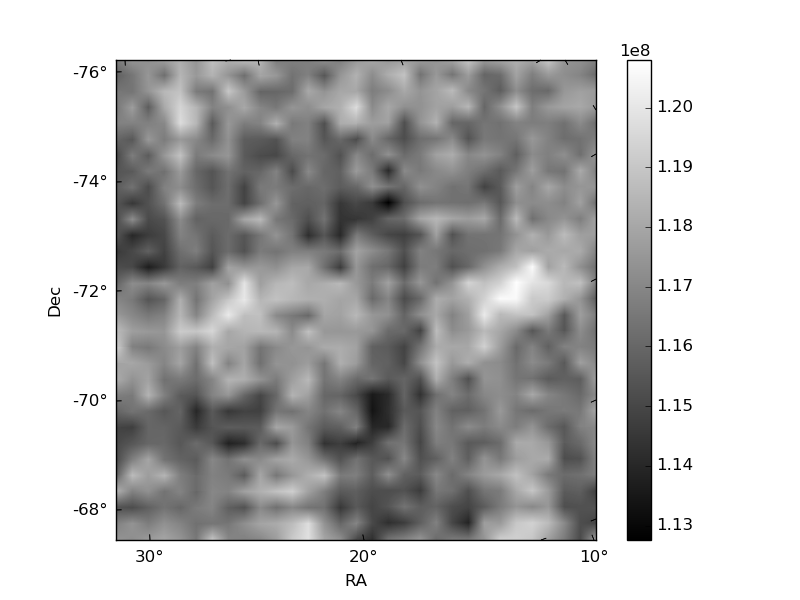
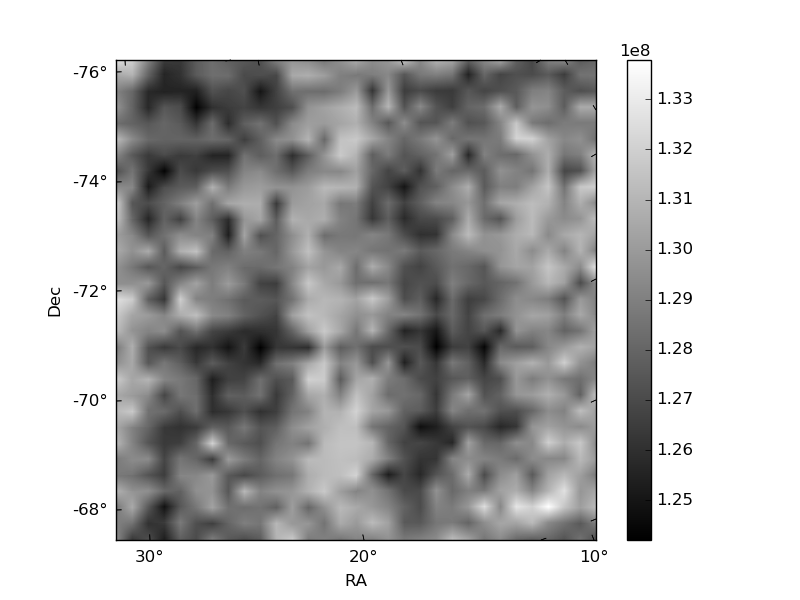
Histogram calculated using DETX and DETY for each event in the final _common_clean file
| Quadrant A | 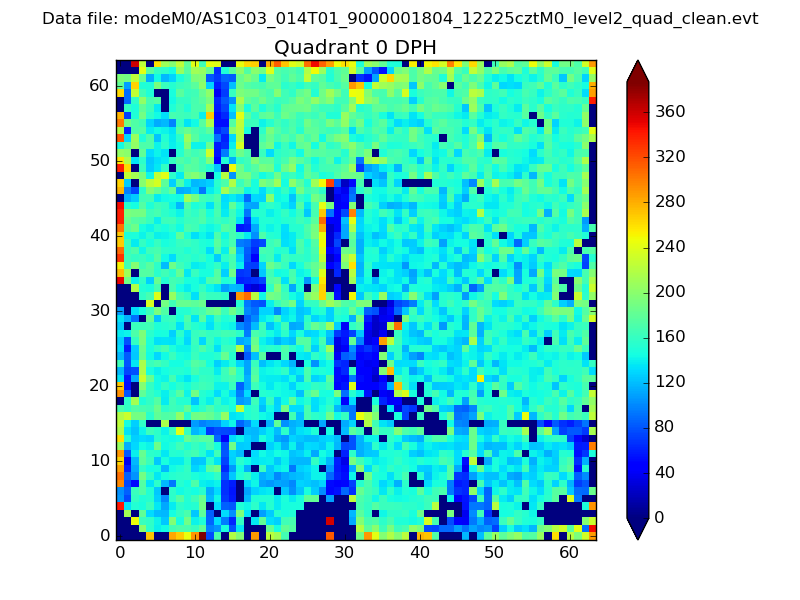 |
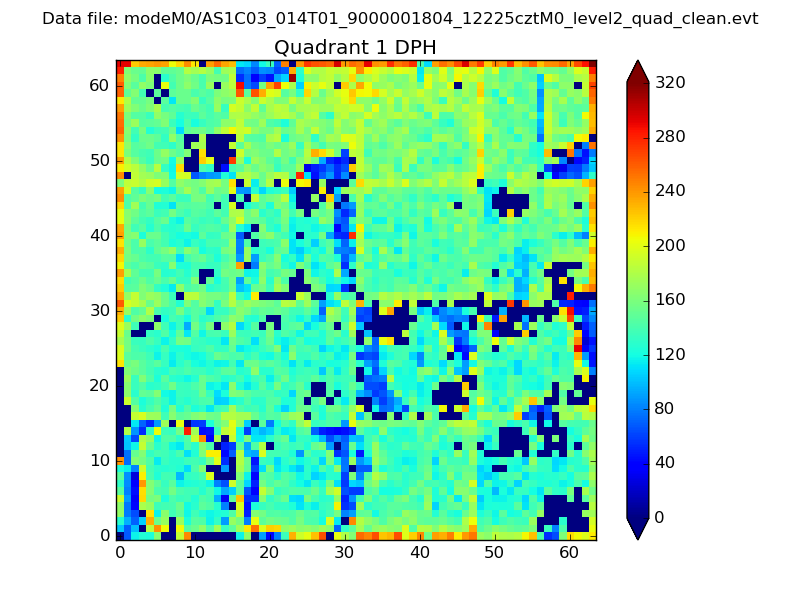 |
Quadrant B |
|---|---|---|---|
| Quadrant D | 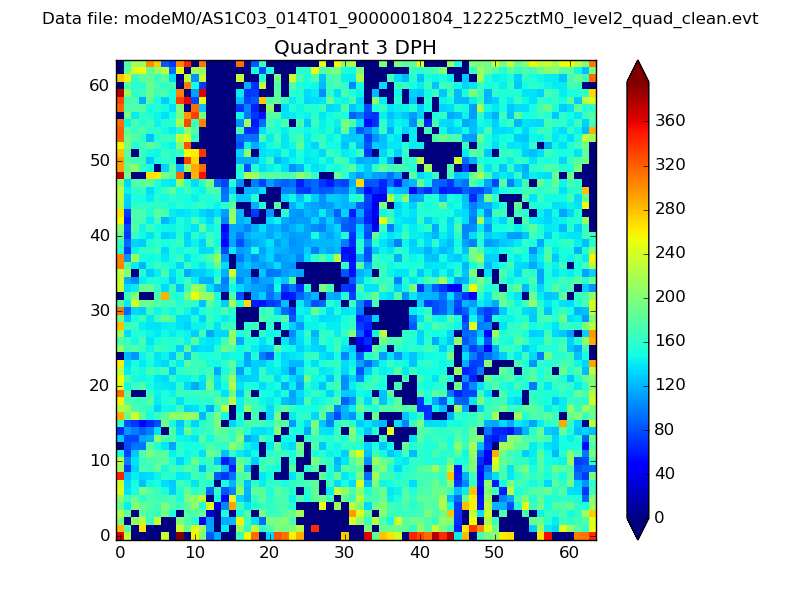 |
 |
Quadrant C |
| Plot type | Count rate plots | Images |
|---|---|---|
| Comparison with Poisson distribution Blue bars denote a histogram of data divided into 1 sec bins. Red curve is a Poisson curve with rate = median count rate of data. |
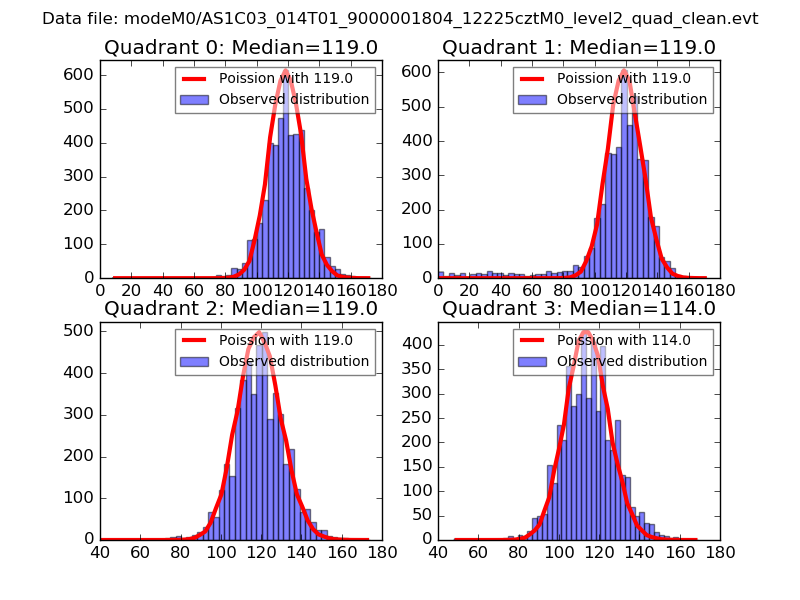 |
 |
| Quadrant-wise count rates Data is divided into 100 sec bins |
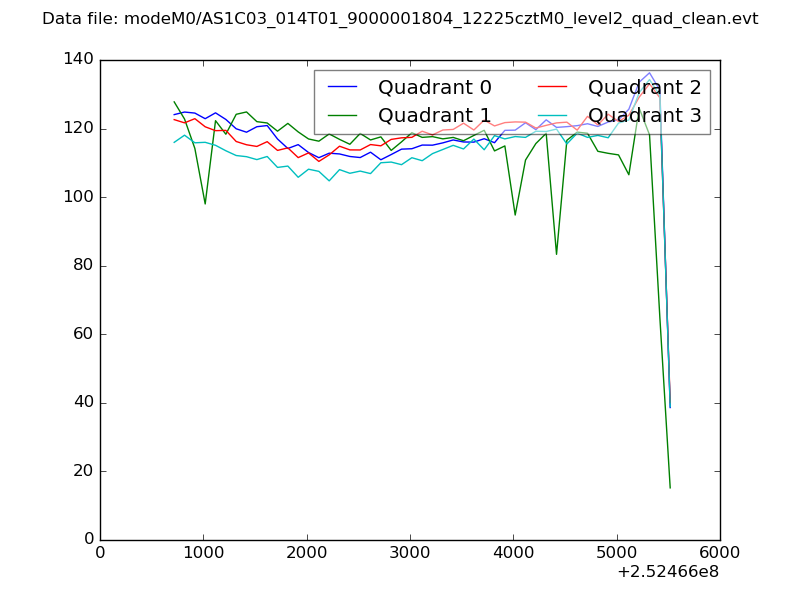 |
|
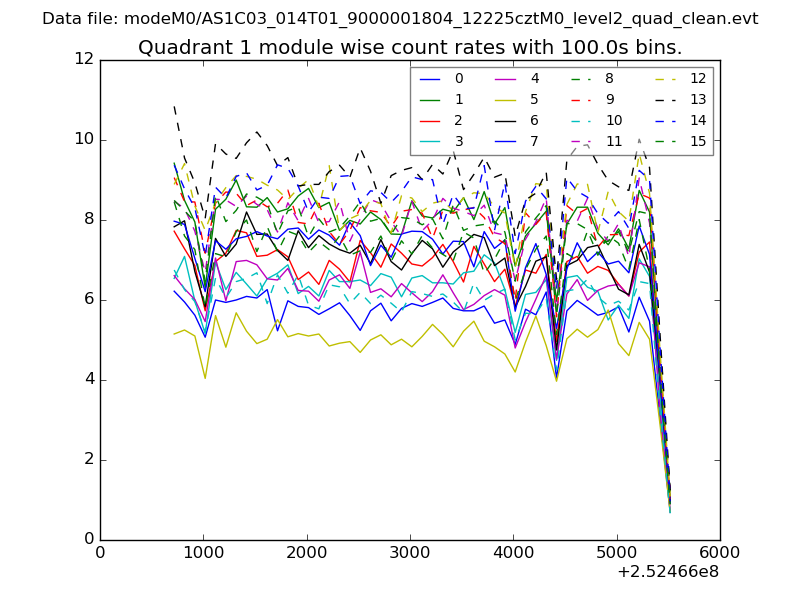
| Module-wise count rates for Quadrant A Data is divided into 100 sec bins |
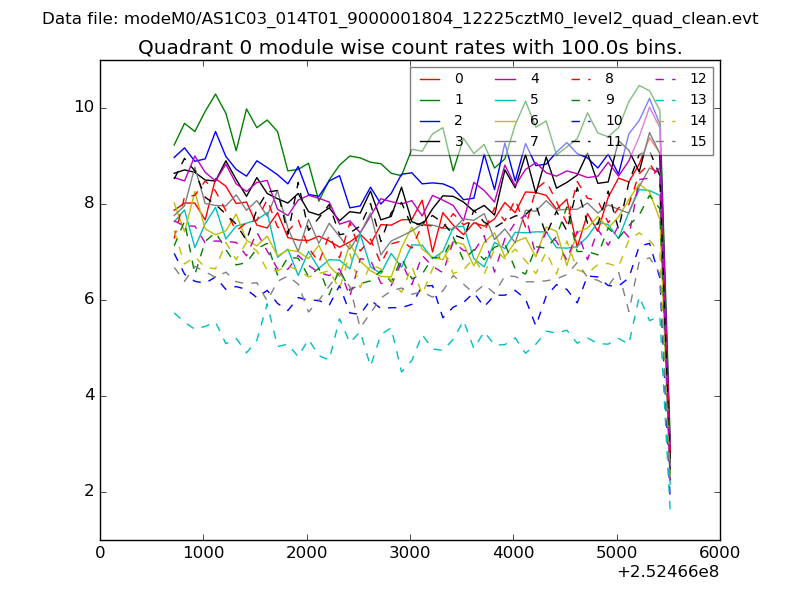 |
 |
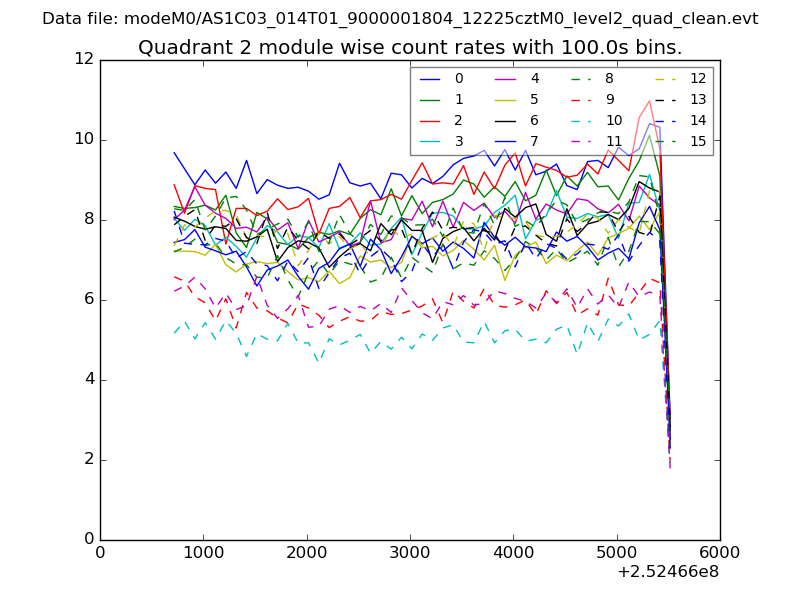
| Module-wise count rates for Quadrant B Data is divided into 100 sec bins |
 |
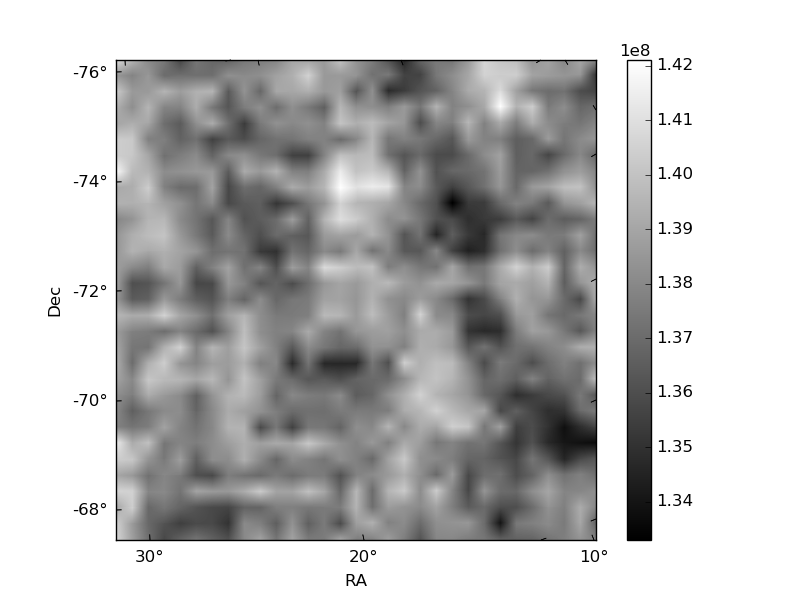 |
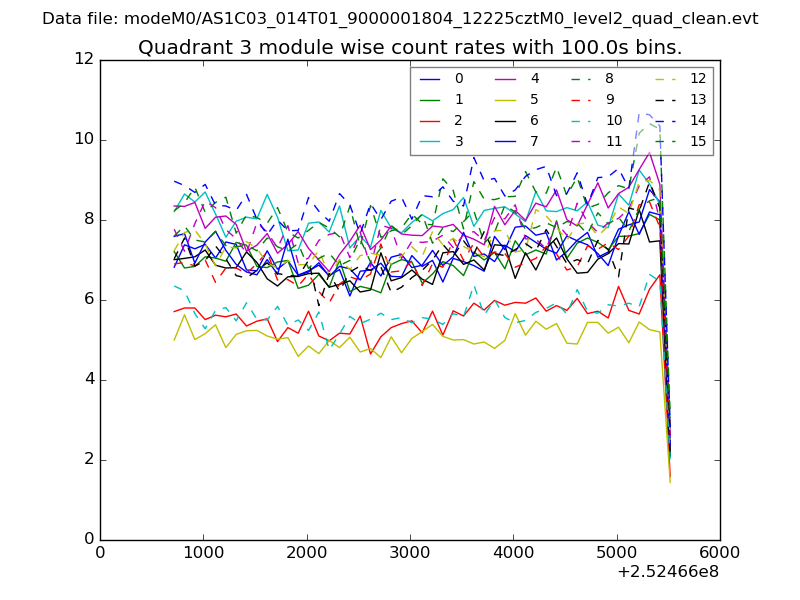
| Module-wise count rates for Quadrant C Data is divided into 100 sec bins |
 |
 |
| Module-wise count rates for Quadrant D Data is divided into 100 sec bins |
 |
 |
| Parameter | Plot |
|---|---|
| CZT HV Monitor | 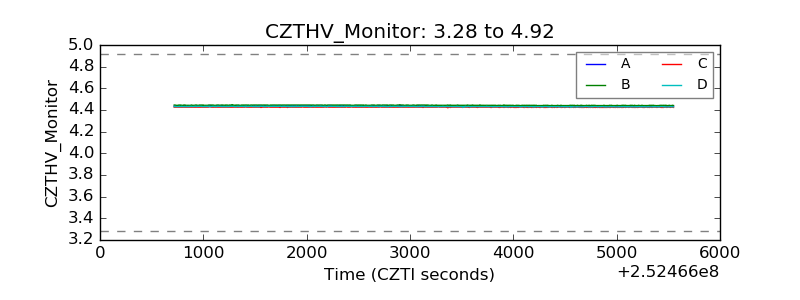 |
| D_VDD | 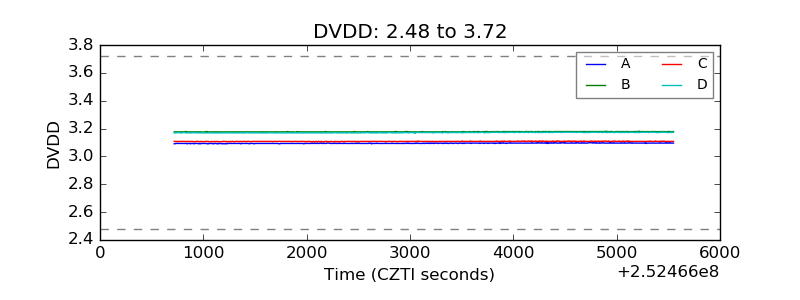 |
| Temperature 1 | 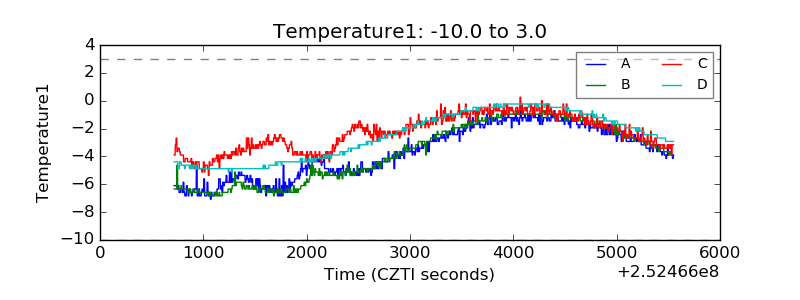 |
| Veto HV Monitor | 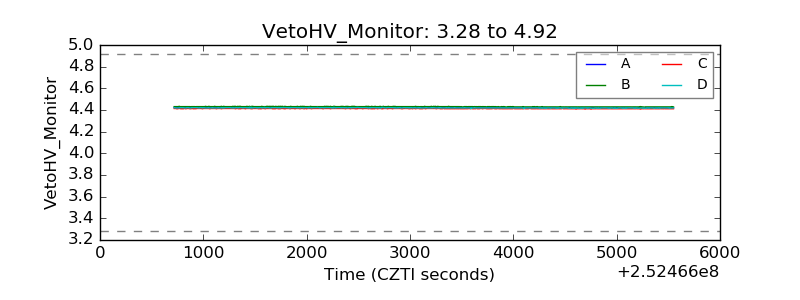 |
| Veto LLD | 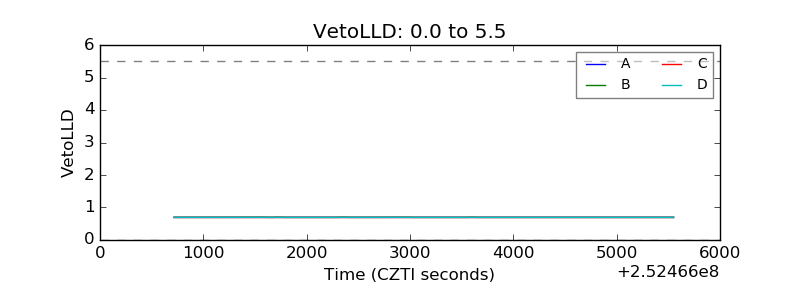 |
| Alpha Counter | 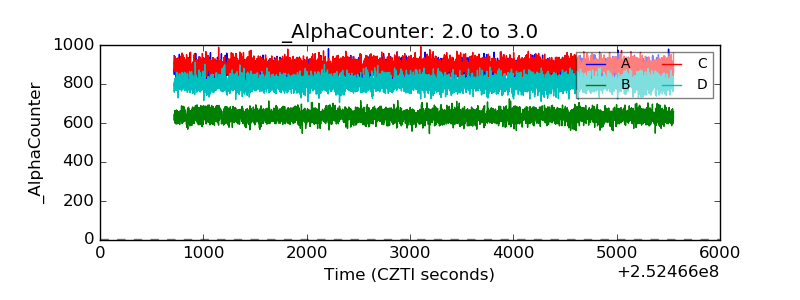 |
| _CPM_Rate | 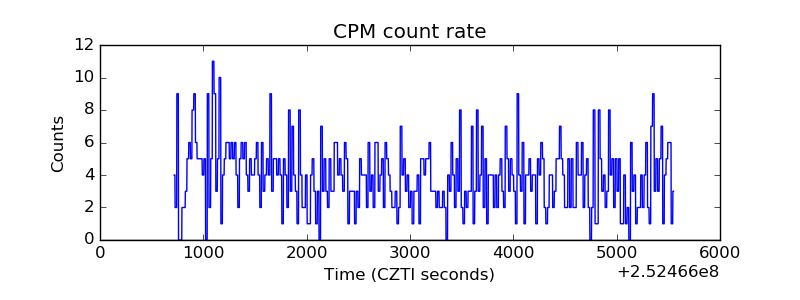 |
| CZT Counter | 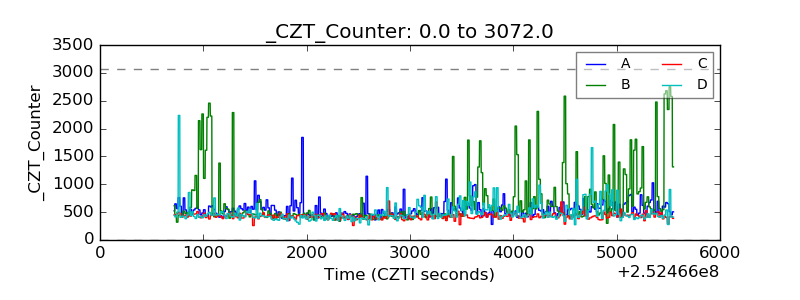 |
| +2.5 Volts monitor | 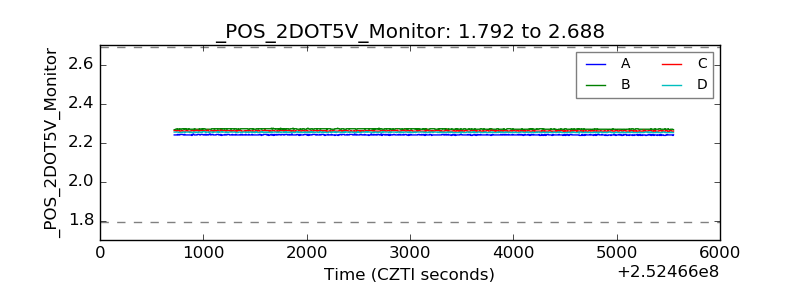 |
| +5 Volts monitor | 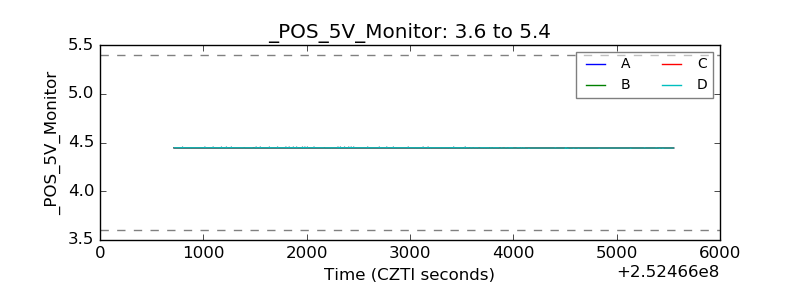 |
| _ROLL_ROT | 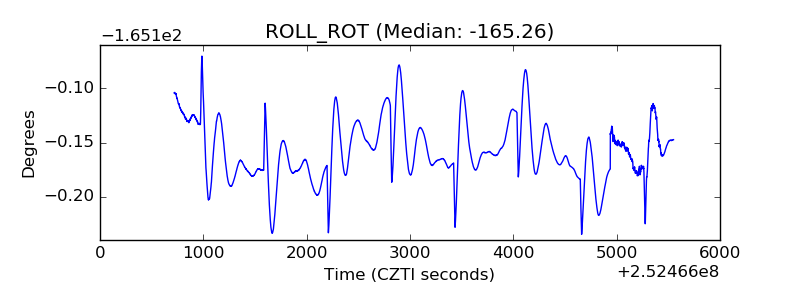 |
| _Roll_DEC | 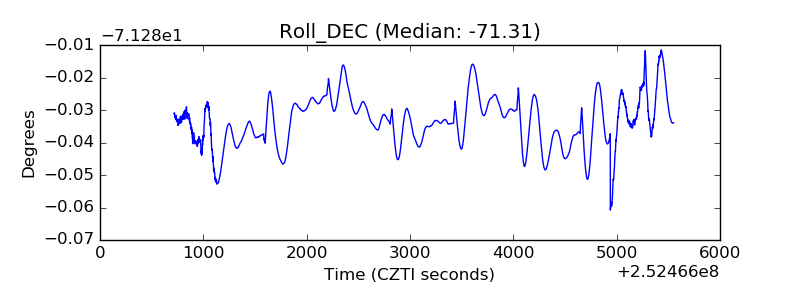 |
| _Roll_RA | 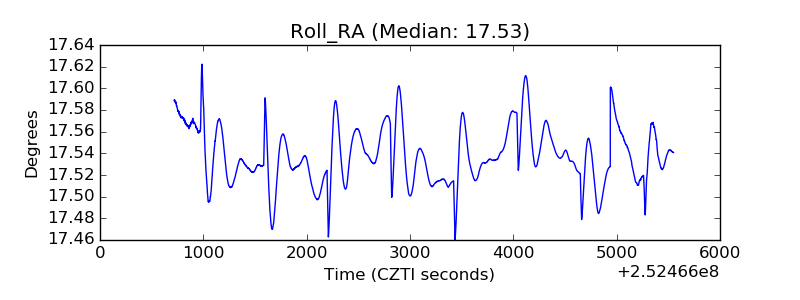 |
| Veto Counter | 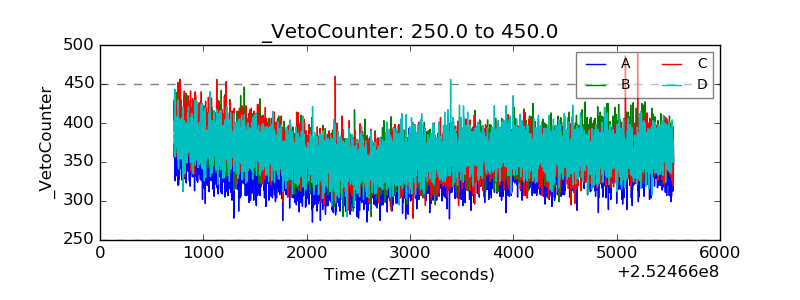 |