| Param | Original file | Final file |
|---|---|---|
| Filename | modeM0/AS1C03_014T02_9000001806_12225cztM0_level2.evt | modeM0/AS1C03_014T02_9000001806_12225cztM0_level2_quad_clean.evt |
| Size (bytes) | 111,216,960 | 28,598,400 |
| Size | 106.1 MB | 27.3 MB |
| Events in quadrant A | 800,384 | 192,520 |
| Events in quadrant B | 872,878 | 195,489 |
| Events in quadrant C | 720,493 | 189,303 |
| Events in quadrant D | 873,015 | 180,532 |
| Mode M9 | |||
|---|---|---|---|
| Quadrant | BADHDUFLAG | Total packets | Discarded packets |
| A | 0 | 7 | 0 |
| B | 0 | 7 | 0 |
| C | 0 | 7 | 0 |
| D | 0 | 7 | 0 |
| Mode M0 | |||
|---|---|---|---|
| Quadrant | BADHDUFLAG | Total packets | Discarded packets |
| A | 0 | 3279 | 2 |
| B | 0 | 3524 | 1 |
| C | 0 | 2989 | 1 |
| D | 0 | 3545 | 1 |
| Mode SS | |||
|---|---|---|---|
| Quadrant | BADHDUFLAG | Total packets | Discarded packets |
| A | 0 | 30 | 0 |
| B | 0 | 30 | 0 |
| C | 0 | 30 | 0 |
| D | 0 | 30 | 0 |
| Quadrant | Total seconds | Saturated seconds | Saturation percentage |
|---|---|---|---|
| A | 1447 | 20 | 1.382170% |
| B | 1447 | 33 | 2.280581% |
| C | 1447 | 13 | 0.898411% |
| D | 1447 | 47 | 3.248100% |
Noise dominated data is calculated using 1-second bins in cleaned event files. If a bin has >2000 counts, and if more than 50% of those come from <1% of pixels, then it is considered to be noise-dominated and hence unusable.
| Quadrant | # 1 sec bins | Bins with >0 counts | Bins with >2000 counts | High rate bins dominated by noise | Noise dominated (total time) | Noise dominated (detector-on time) | Marked lightcurve |
|---|---|---|---|---|---|---|---|
| A | 1448 | 1448 | 0 | 0 | 0.00% | 0.00% | 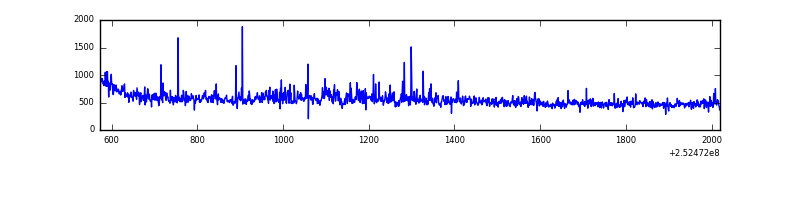 |
| B | 1448 | 1448 | 8 | 8 | 0.55% | 0.55% | 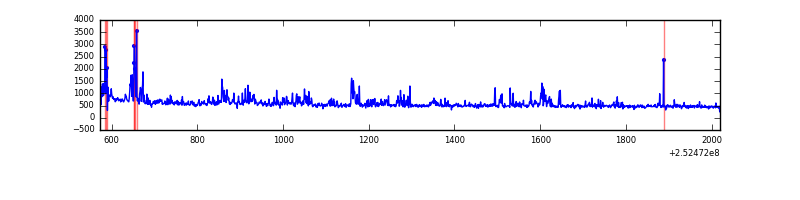 |
| C | 1448 | 1448 | 0 | 0 | 0.00% | 0.00% | 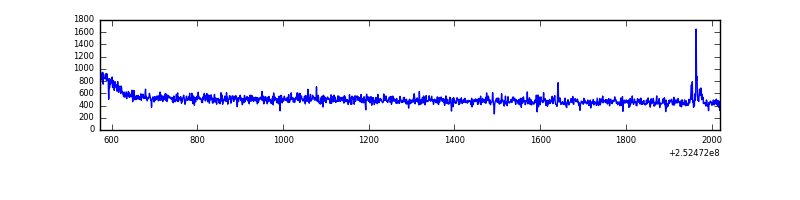 |
| D | 1448 | 1448 | 36 | 36 | 2.49% | 2.49% | 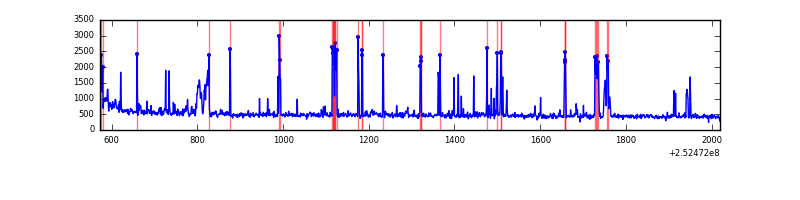 |
Top three noisy pixels from each quadrant. If the there are fewer than three noisy pixels in the level2.evt file, extra rows are filled as -1
| Pixel properties | Quadrant properties | ||||||
|---|---|---|---|---|---|---|---|
| Quadrant | DetID | PixID | Counts | Sigma | Mean | Median | Sigma |
| A | 13 | 251 | 36192 | 948.94 | 178 | 174 | 38.0 |
| A | 1 | 162 | 27529 | 720.7 | 178 | 174 | 38.0 |
| A | 1 | 178 | 14654 | 381.49 | 178 | 174 | 38.0 |
| B | 4 | 239 | 137671 | 3832.57 | 181 | 177 | 35.9 |
| B | 3 | 64 | 15337 | 422.58 | 181 | 177 | 35.9 |
| B | 0 | 214 | 6935 | 188.38 | 181 | 177 | 35.9 |
| C | 5 | 112 | 4686 | 104.35 | 181 | 181 | 43.2 |
| C | 8 | 128 | 3216 | 70.3 | 181 | 181 | 43.2 |
| C | 8 | 112 | 1597 | 32.8 | 181 | 181 | 43.2 |
| D | 1 | 52 | 156081 | 3568.2 | 174 | 168 | 43.7 |
| D | 13 | 104 | 19721 | 447.49 | 174 | 168 | 43.7 |
| D | 13 | 122 | 9204 | 206.8 | 174 | 168 | 43.7 |
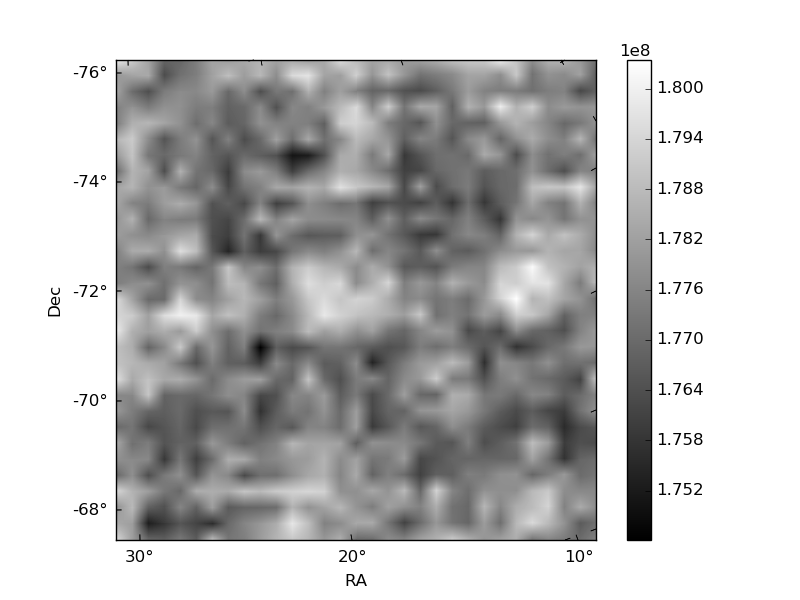
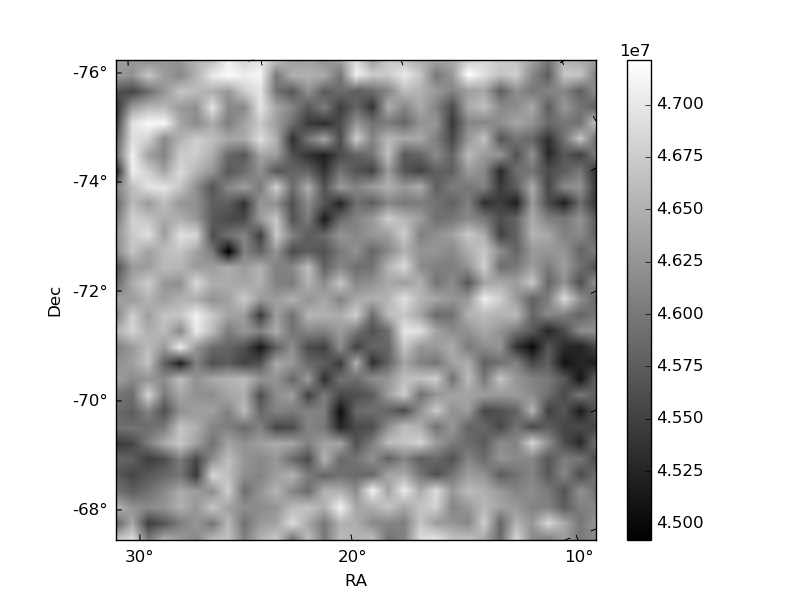
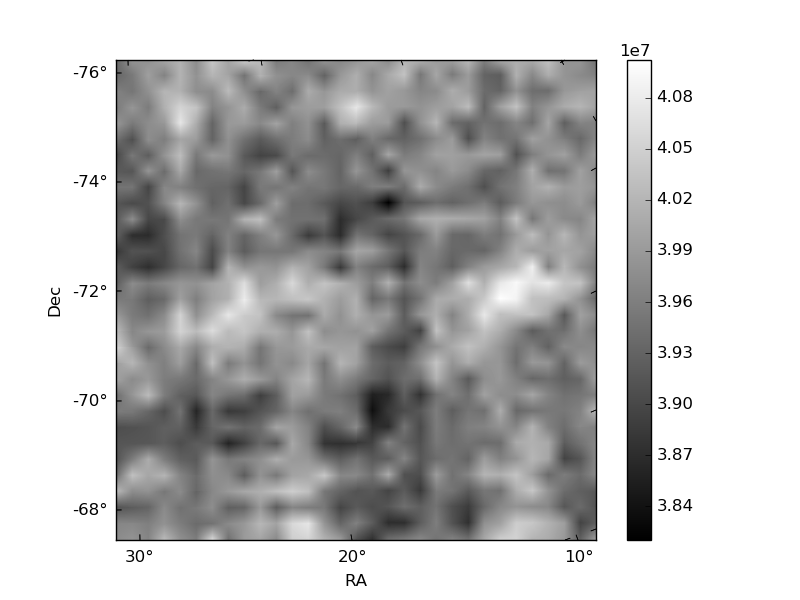
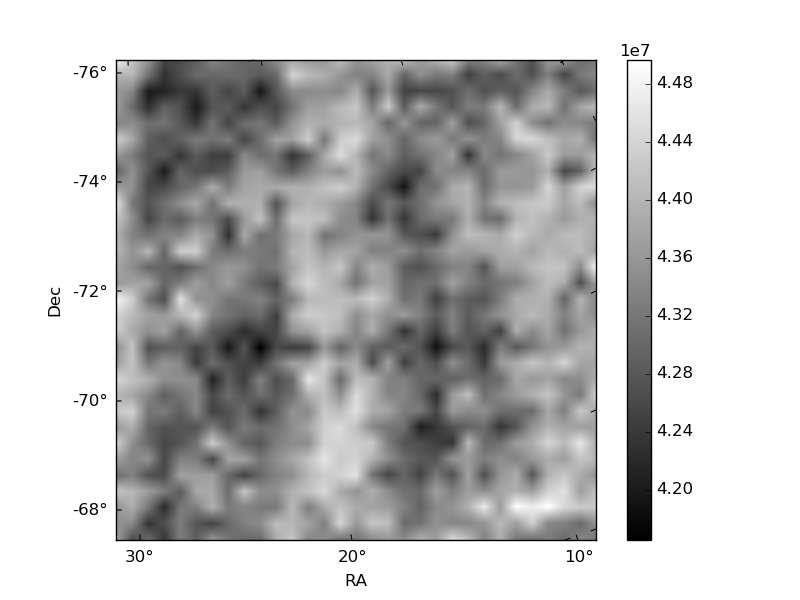
Histogram calculated using DETX and DETY for each event in the final _common_clean file
| Quadrant A | 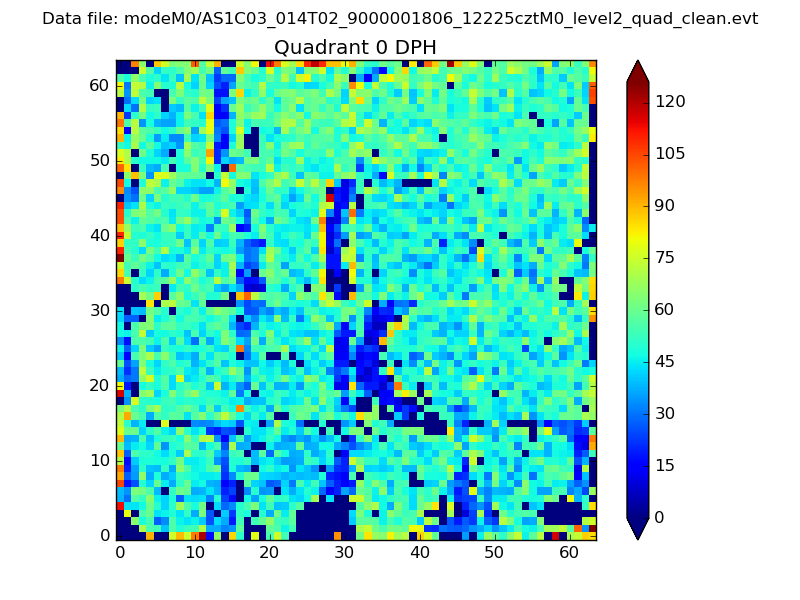 |
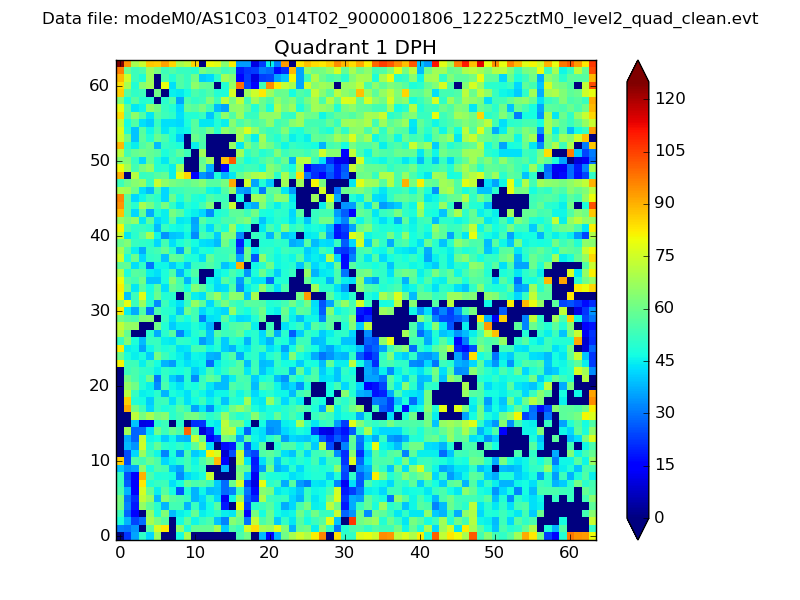 |
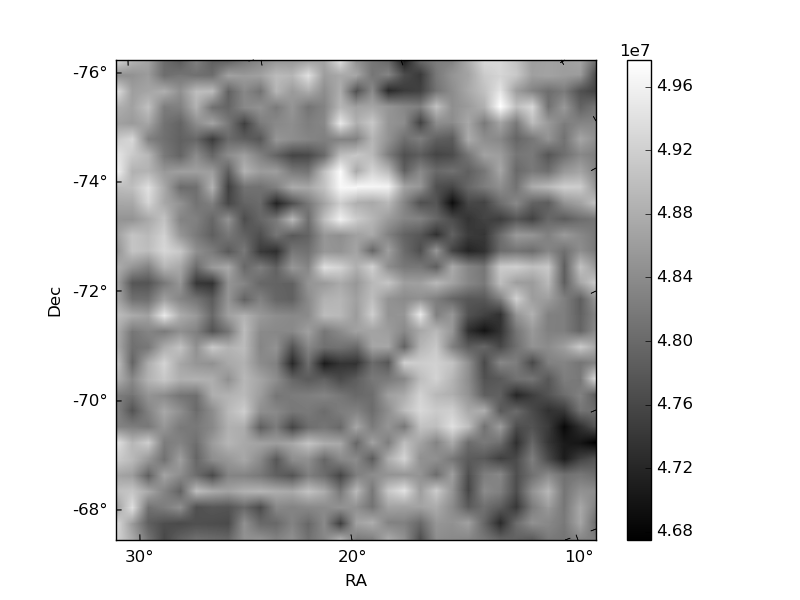
Quadrant B |
|---|---|---|---|
| Quadrant D | 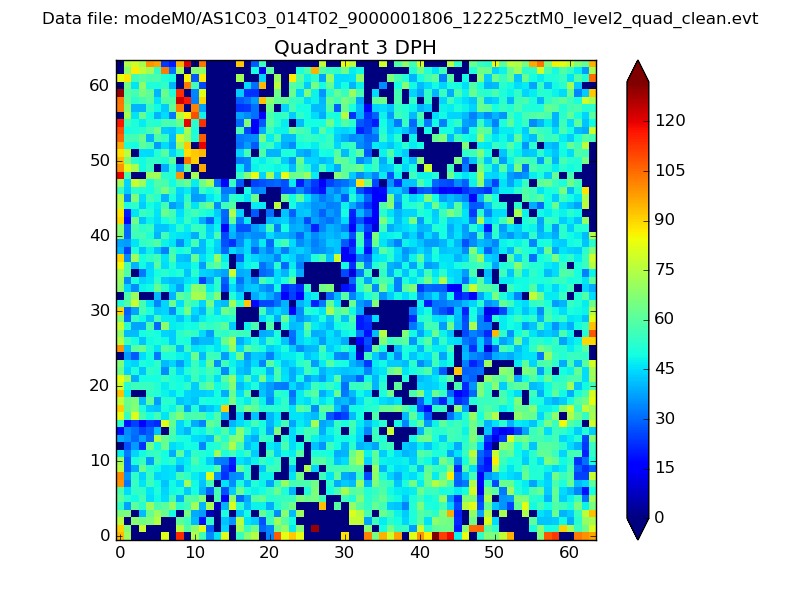 |
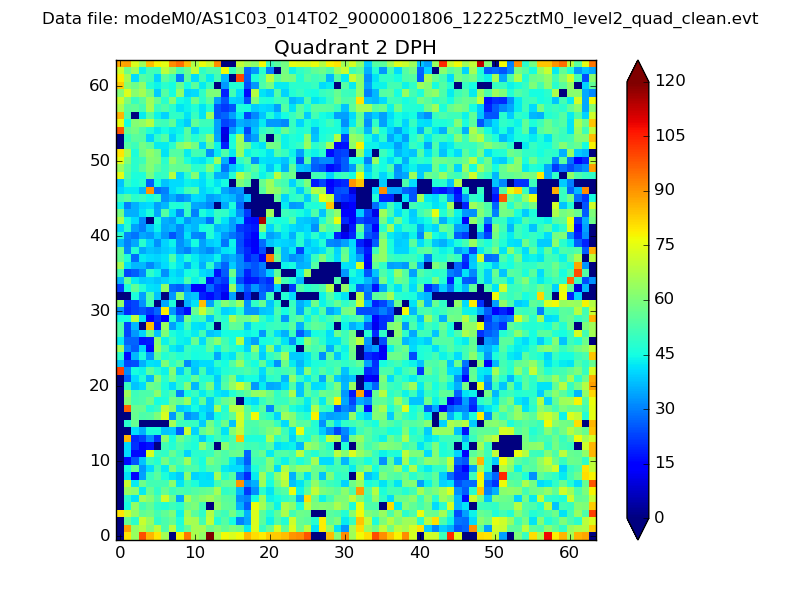 |
Quadrant C |
| Plot type | Count rate plots | Images |
|---|---|---|
| Comparison with Poisson distribution Blue bars denote a histogram of data divided into 1 sec bins. Red curve is a Poisson curve with rate = median count rate of data. |
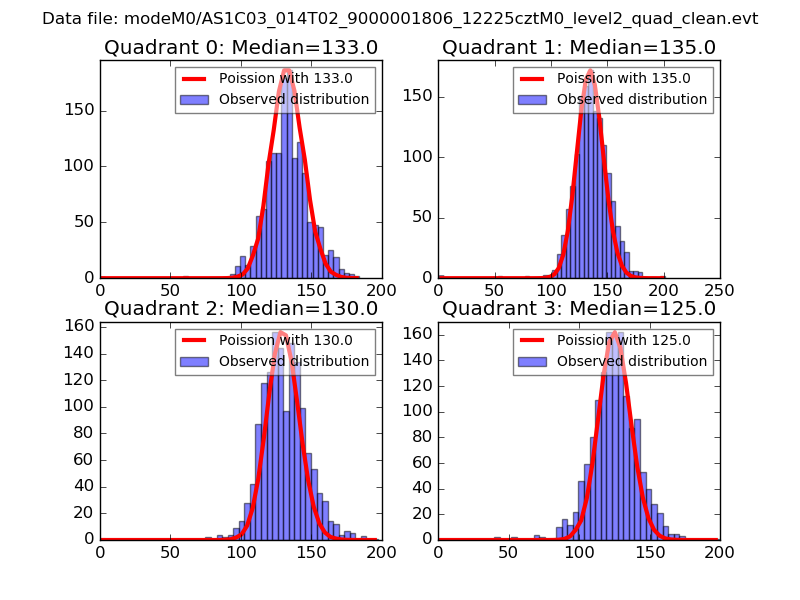 |
 |
| Quadrant-wise count rates Data is divided into 100 sec bins |
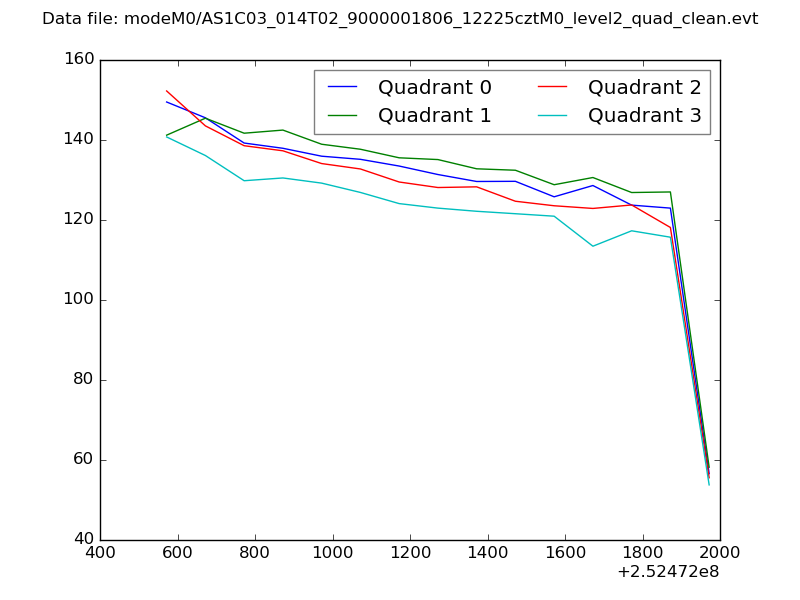 |
|
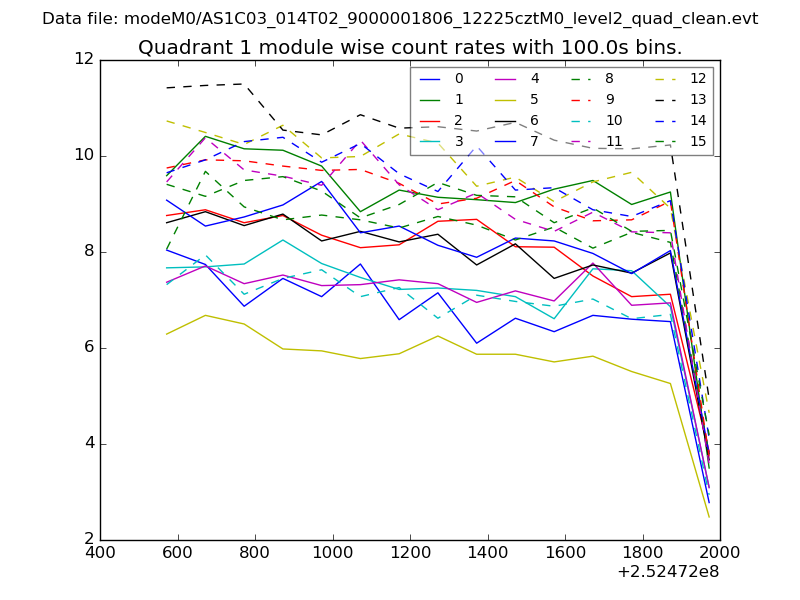
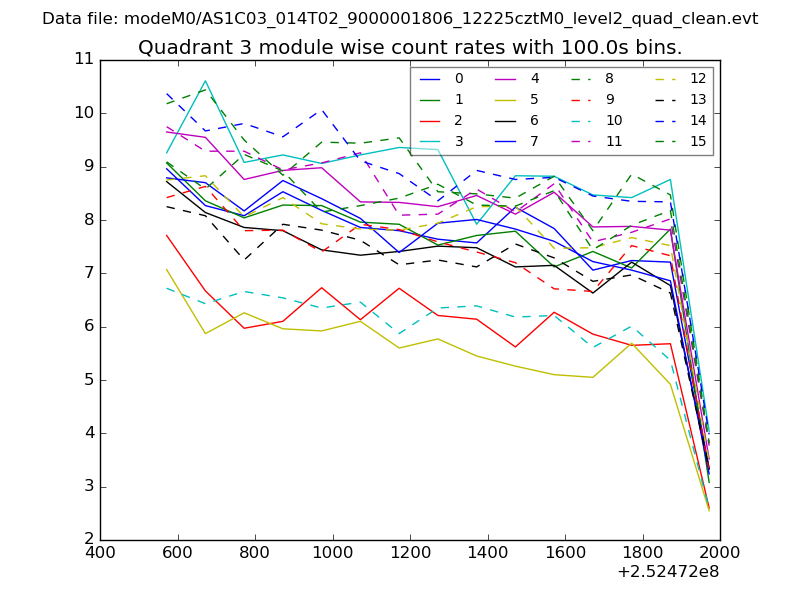
| Module-wise count rates for Quadrant A Data is divided into 100 sec bins |
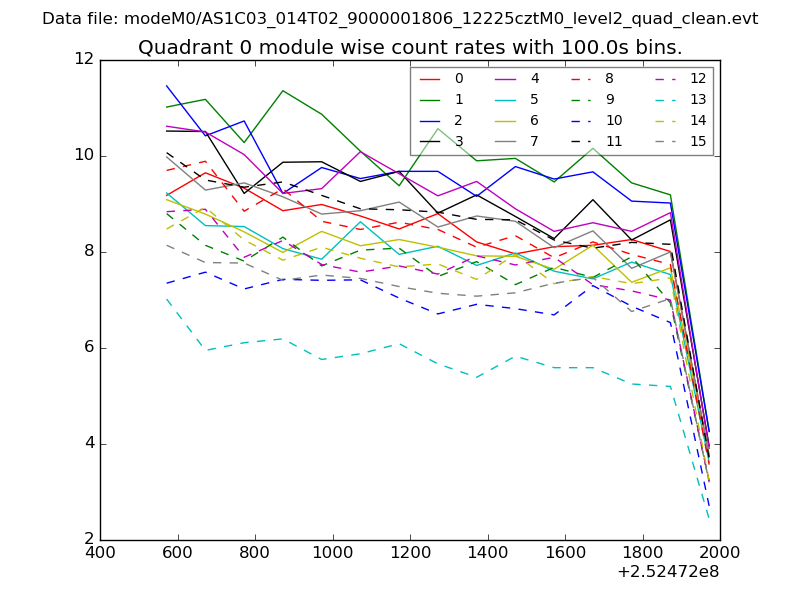 |
 |
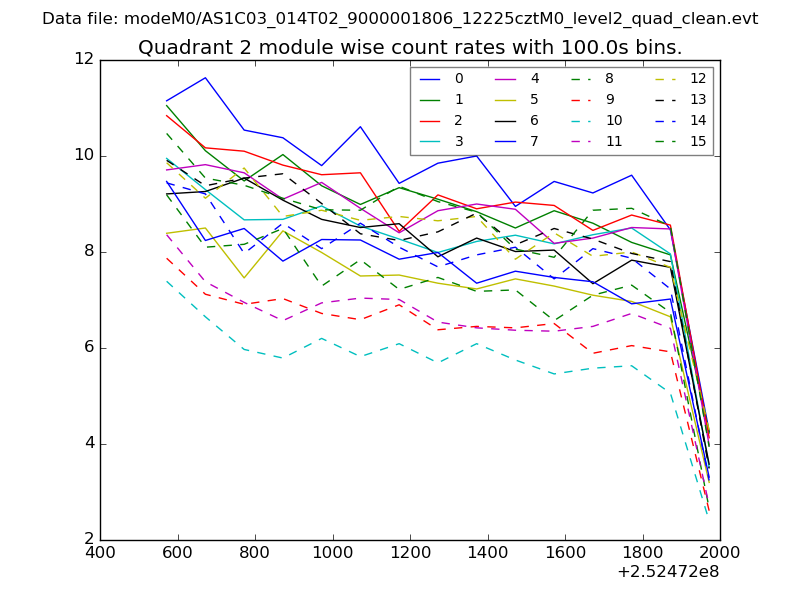
| Module-wise count rates for Quadrant B Data is divided into 100 sec bins |
 |
 |
| Module-wise count rates for Quadrant C Data is divided into 100 sec bins |
 |
 |
| Module-wise count rates for Quadrant D Data is divided into 100 sec bins |
 |
 |
| Parameter | Plot |
|---|---|
| CZT HV Monitor | 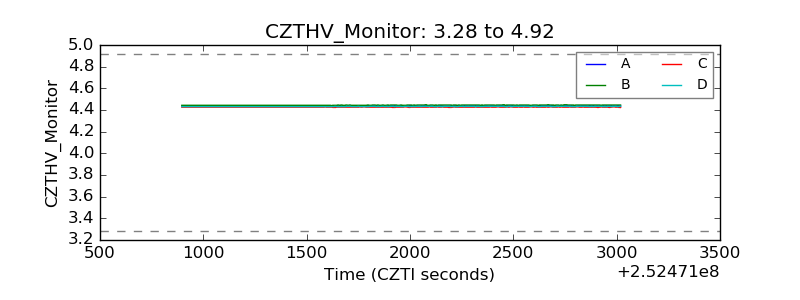 |
| D_VDD | 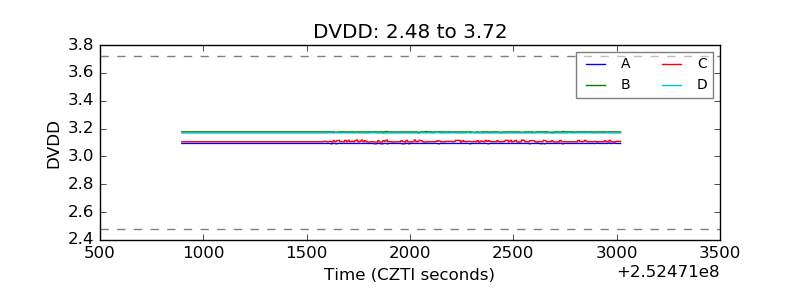 |
| Temperature 1 | 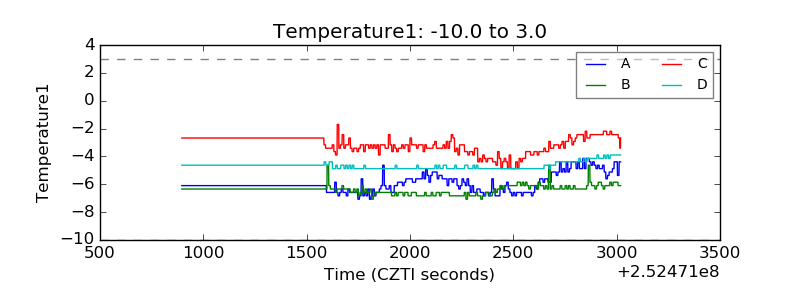 |
| Veto HV Monitor | 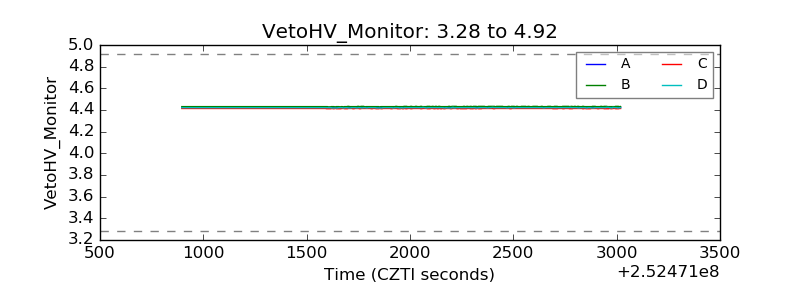 |
| Veto LLD | 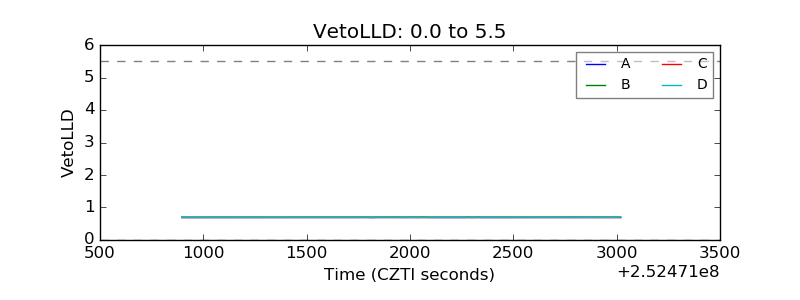 |
| Alpha Counter | 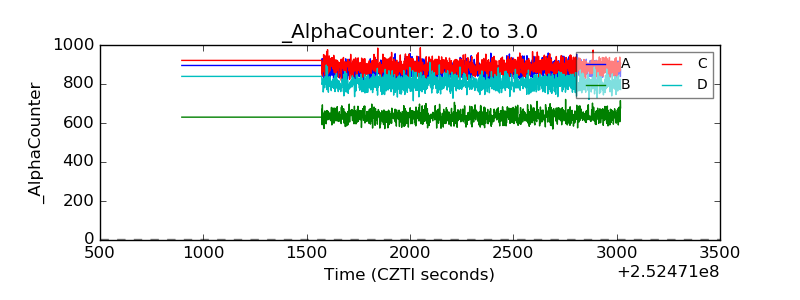 |
| _CPM_Rate | 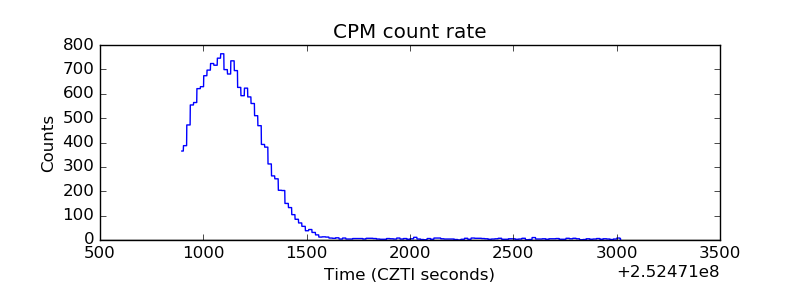 |
| CZT Counter | 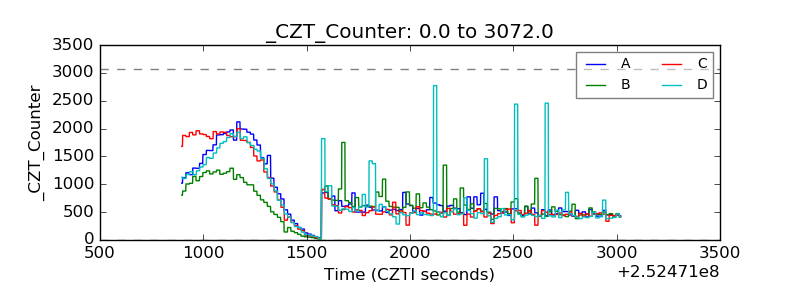 |
| +2.5 Volts monitor |  |
| +5 Volts monitor |  |
| _ROLL_ROT | 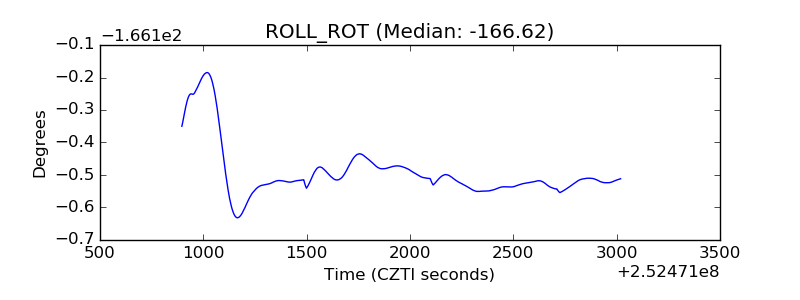 |
| _Roll_DEC | 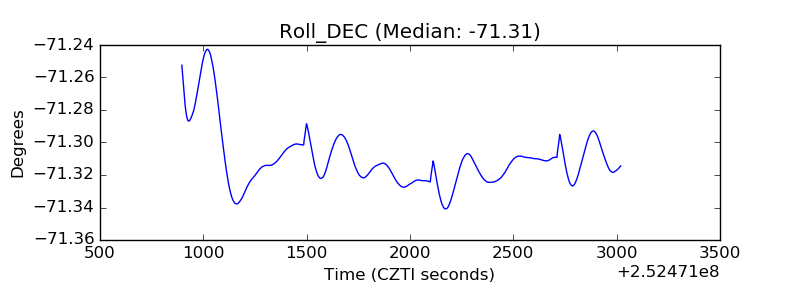 |
| _Roll_RA | 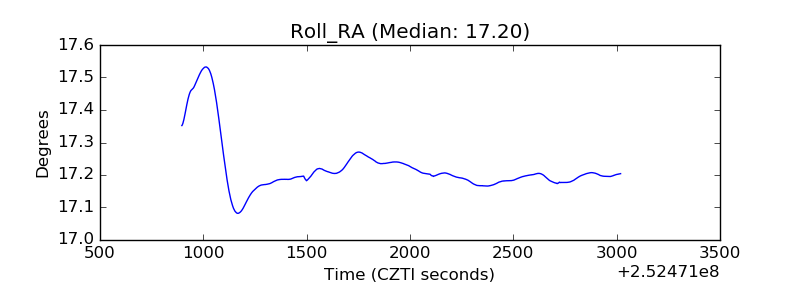 |
| Veto Counter | 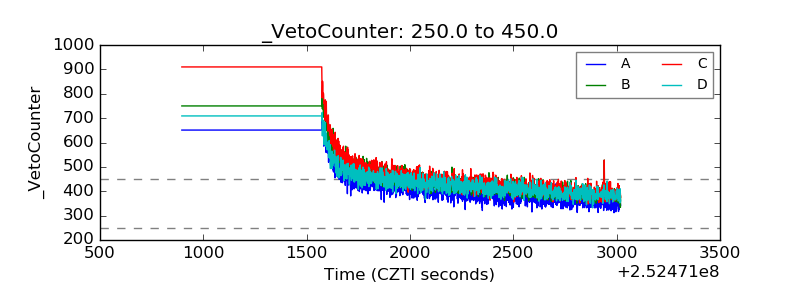 |