| Param | Original file | Final file |
|---|---|---|
| Filename | modeM0/AS1C03_014T02_9000001806_12226cztM0_level2.evt | modeM0/AS1C03_014T02_9000001806_12226cztM0_level2_quad_clean.evt |
| Size (bytes) | 543,818,880 | 124,061,760 |
| Size | 518.6 MB | 118.3 MB |
| Events in quadrant A | 3,856,502 | 843,318 |
| Events in quadrant B | 5,311,535 | 805,995 |
| Events in quadrant C | 3,061,546 | 847,002 |
| Events in quadrant D | 3,791,538 | 799,920 |
| Mode M9 | |||
|---|---|---|---|
| Quadrant | BADHDUFLAG | Total packets | Discarded packets |
| A | 0 | 10 | 0 |
| B | 0 | 10 | 0 |
| C | 0 | 10 | 0 |
| D | 0 | 10 | 0 |
| Mode M0 | |||
|---|---|---|---|
| Quadrant | BADHDUFLAG | Total packets | Discarded packets |
| A | 0 | 15766 | 3 |
| B | 0 | 20198 | 2 |
| C | 0 | 13541 | 2 |
| D | 0 | 15768 | 2 |
| Mode SS | |||
|---|---|---|---|
| Quadrant | BADHDUFLAG | Total packets | Discarded packets |
| A | 0 | 136 | 0 |
| B | 0 | 136 | 0 |
| C | 0 | 136 | 0 |
| D | 0 | 136 | 0 |
| Quadrant | Total seconds | Saturated seconds | Saturation percentage |
|---|---|---|---|
| A | 6605 | 81 | 1.226344% |
| B | 6605 | 723 | 10.946253% |
| C | 6605 | 38 | 0.575322% |
| D | 6605 | 219 | 3.315670% |
Noise dominated data is calculated using 1-second bins in cleaned event files. If a bin has >2000 counts, and if more than 50% of those come from <1% of pixels, then it is considered to be noise-dominated and hence unusable.
| Quadrant | # 1 sec bins | Bins with >0 counts | Bins with >2000 counts | High rate bins dominated by noise | Noise dominated (total time) | Noise dominated (detector-on time) | Marked lightcurve |
|---|---|---|---|---|---|---|---|
| A | 7671 | 6606 | 10 | 10 | 0.13% | 0.15% | 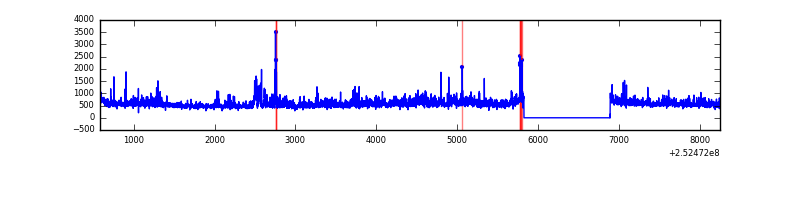 |
| B | 7671 | 6606 | 474 | 474 | 6.18% | 7.18% | 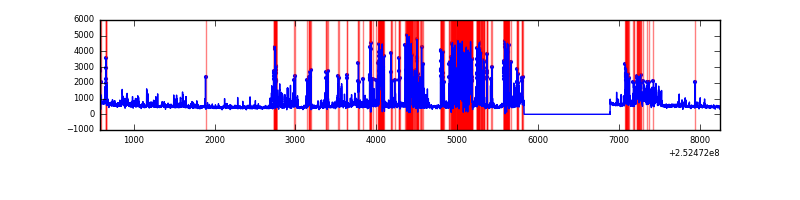 |
| C | 7671 | 6606 | 2 | 2 | 0.03% | 0.03% | 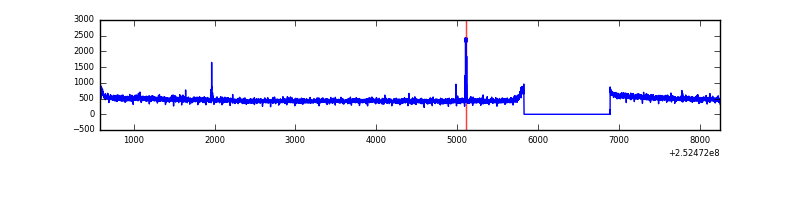 |
| D | 7671 | 6606 | 168 | 168 | 2.19% | 2.54% | 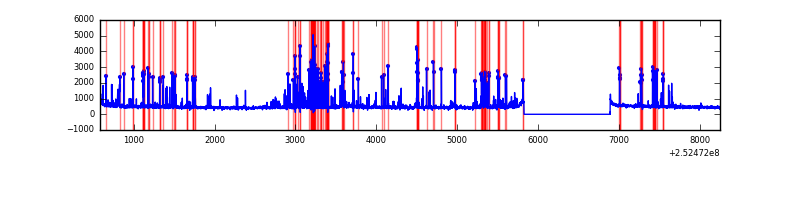 |
Top three noisy pixels from each quadrant. If the there are fewer than three noisy pixels in the level2.evt file, extra rows are filled as -1
| Pixel properties | Quadrant properties | ||||||
|---|---|---|---|---|---|---|---|
| Quadrant | DetID | PixID | Counts | Sigma | Mean | Median | Sigma |
| A | 13 | 251 | 216172 | 1351.6 | 786 | 769 | 159.4 |
| A | 1 | 162 | 180035 | 1124.85 | 786 | 769 | 159.4 |
| A | 1 | 178 | 101851 | 634.26 | 786 | 769 | 159.4 |
| B | 4 | 239 | 2162597 | 15356.73 | 749 | 731 | 140.8 |
| B | 11 | 51 | 100863 | 711.28 | 749 | 731 | 140.8 |
| B | 0 | 229 | 30688 | 212.8 | 749 | 731 | 140.8 |
| C | 7 | 221 | 12799 | 67.79 | 773 | 776 | 177.3 |
| C | 4 | 175 | 8678 | 44.56 | 773 | 776 | 177.3 |
| C | 8 | 128 | 8574 | 43.97 | 773 | 776 | 177.3 |
| D | 1 | 52 | 603822 | 3336.96 | 759 | 737 | 180.7 |
| D | 13 | 104 | 128189 | 705.21 | 759 | 737 | 180.7 |
| D | 5 | 222 | 35466 | 192.16 | 759 | 737 | 180.7 |
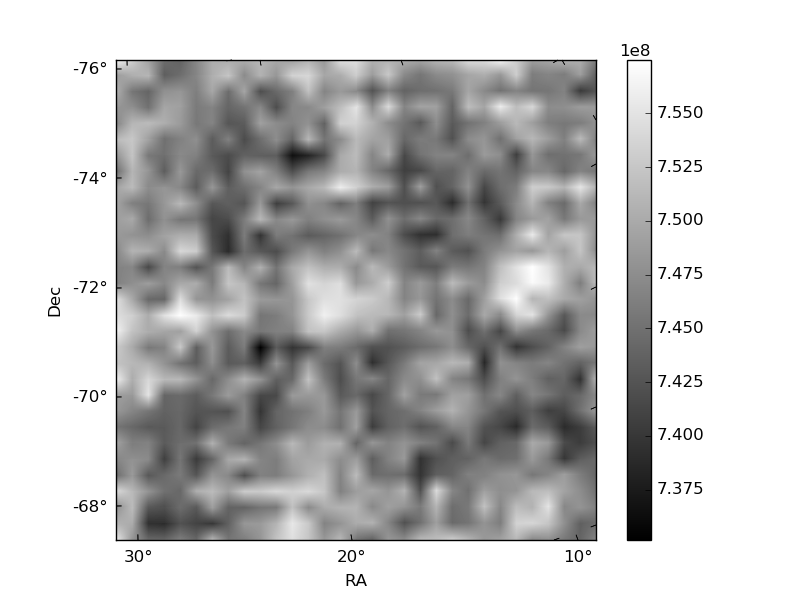
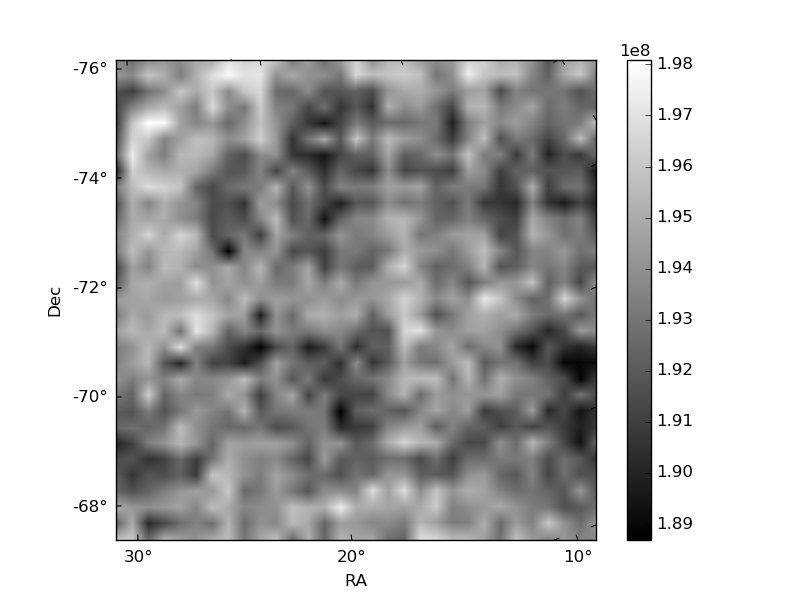
Histogram calculated using DETX and DETY for each event in the final _common_clean file
| Quadrant A | 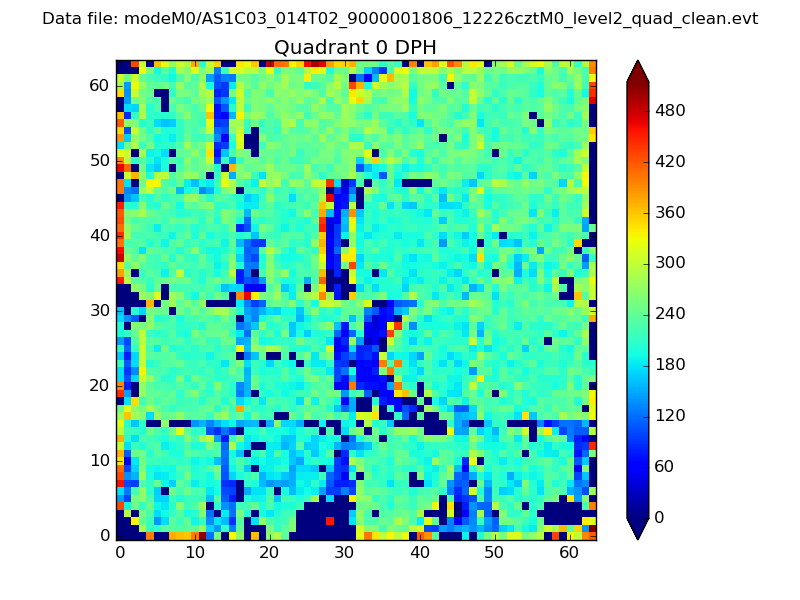 |
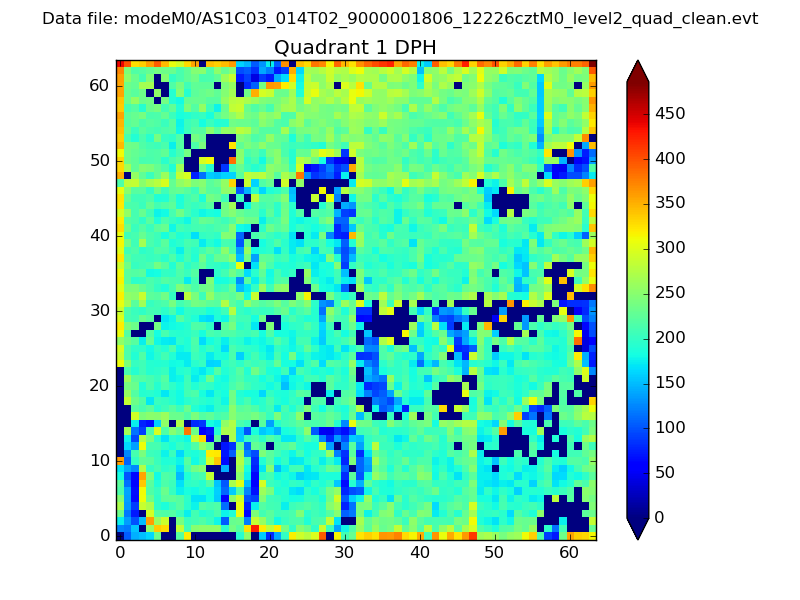 |
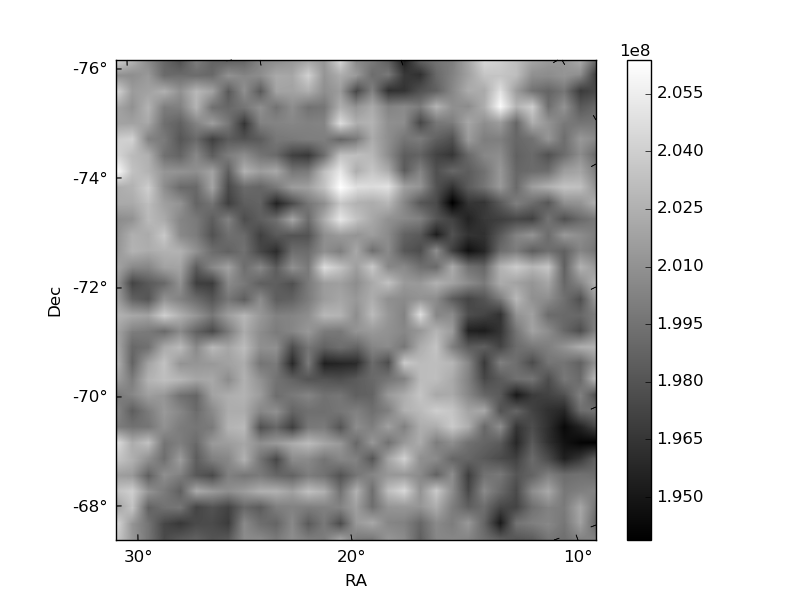
Quadrant B |
|---|---|---|---|
| Quadrant D | 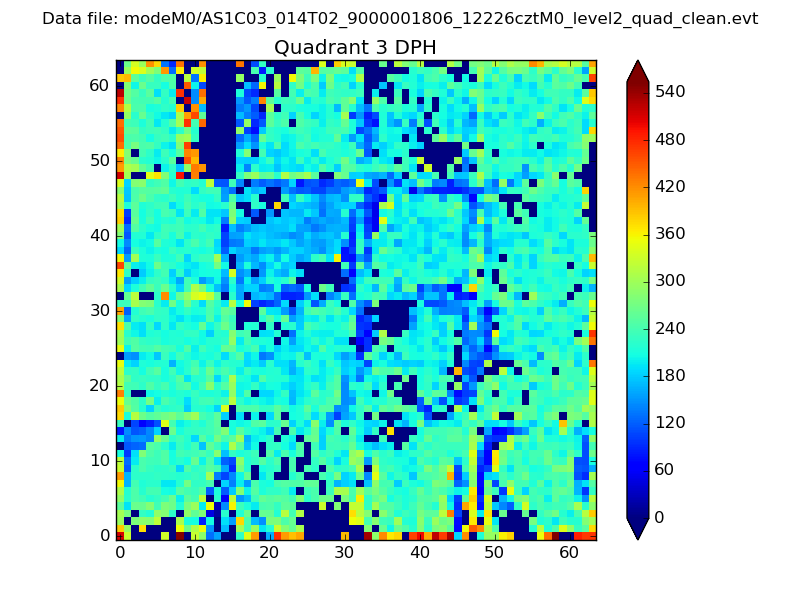 |
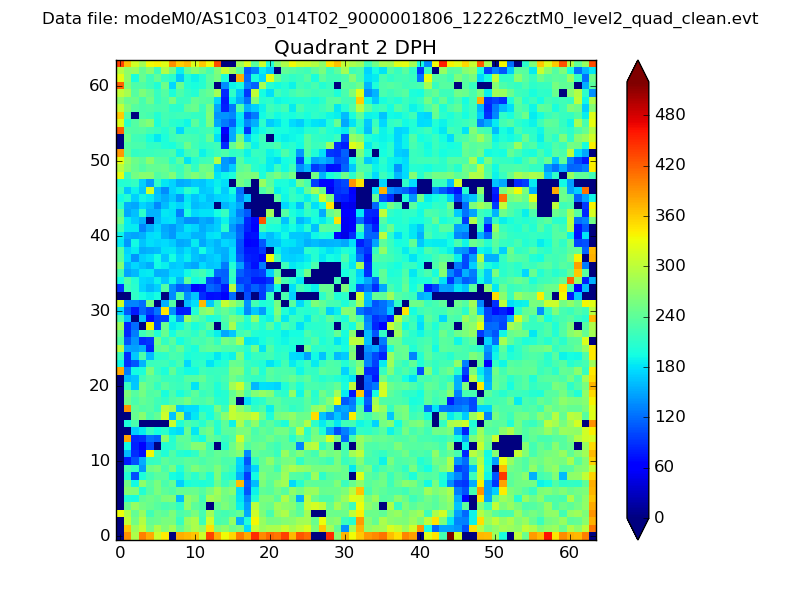 |
Quadrant C |
| Plot type | Count rate plots | Images |
|---|---|---|
| Comparison with Poisson distribution Blue bars denote a histogram of data divided into 1 sec bins. Red curve is a Poisson curve with rate = median count rate of data. |
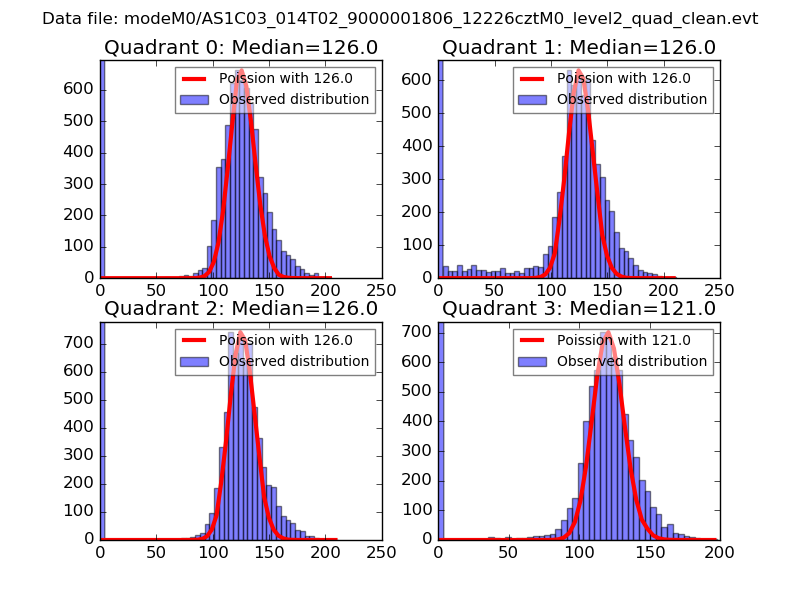 |
 |
| Quadrant-wise count rates Data is divided into 100 sec bins |
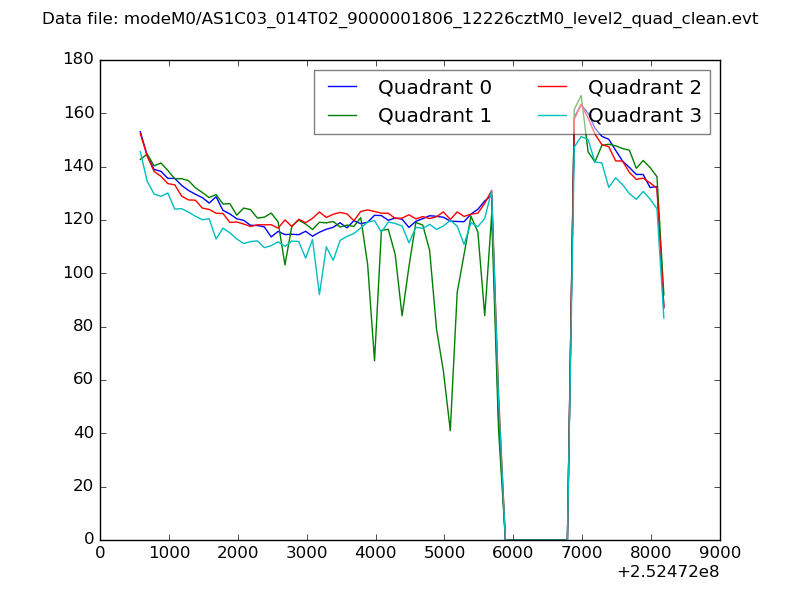 |
|
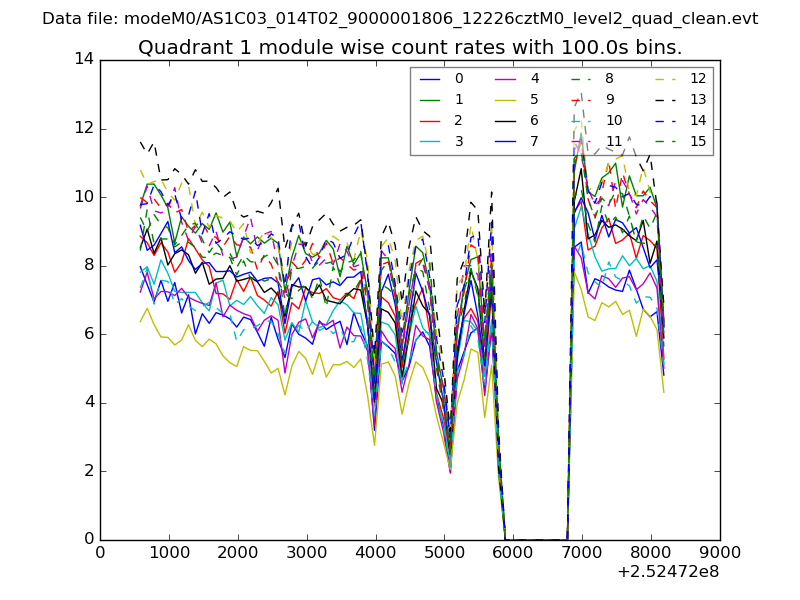
| Module-wise count rates for Quadrant A Data is divided into 100 sec bins |
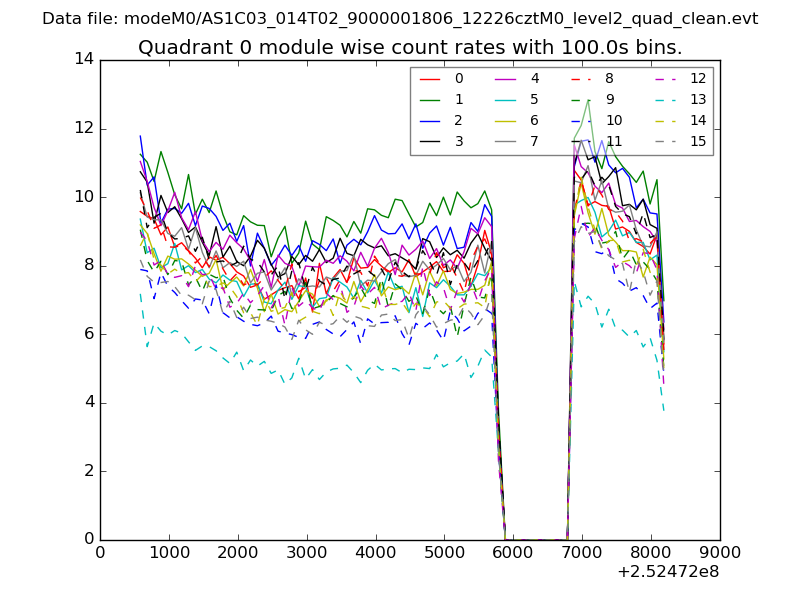 |
 |
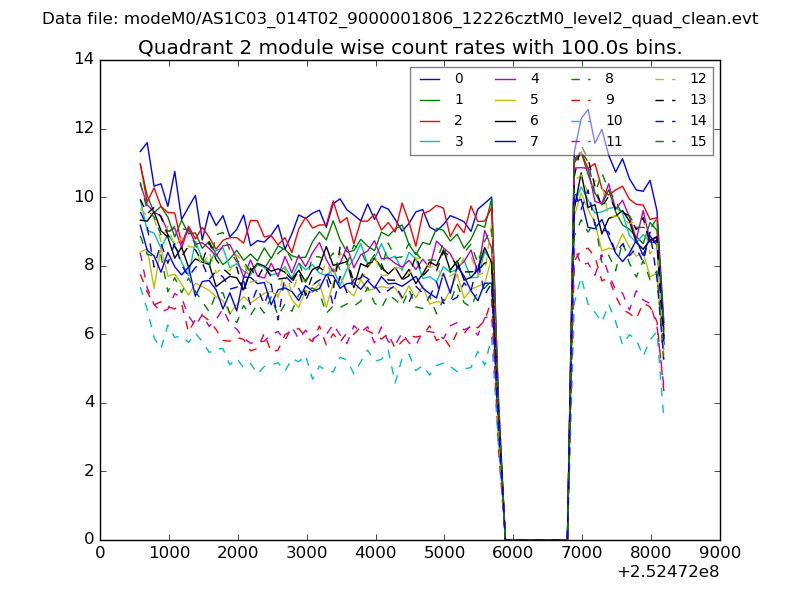
| Module-wise count rates for Quadrant B Data is divided into 100 sec bins |
 |
 |
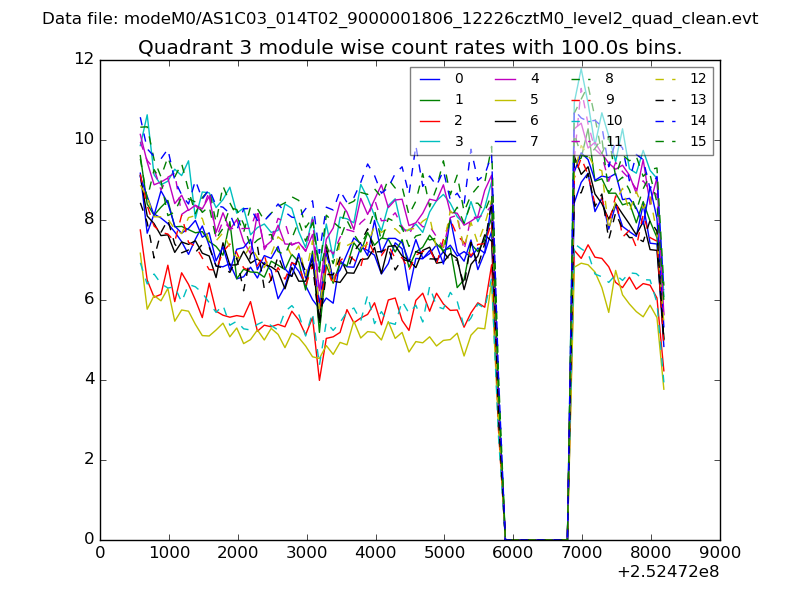
| Module-wise count rates for Quadrant C Data is divided into 100 sec bins |
 |
 |
| Module-wise count rates for Quadrant D Data is divided into 100 sec bins |
 |
 |
| Parameter | Plot |
|---|---|
| CZT HV Monitor | 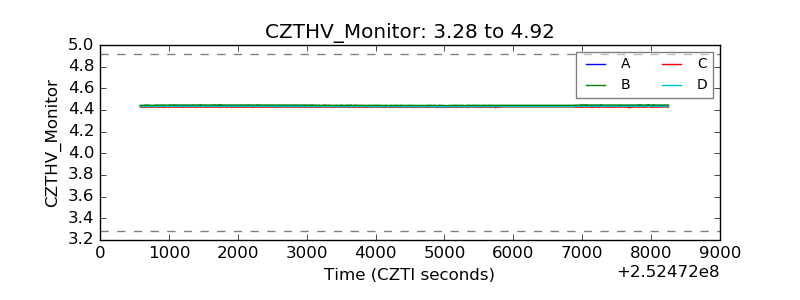 |
| D_VDD | 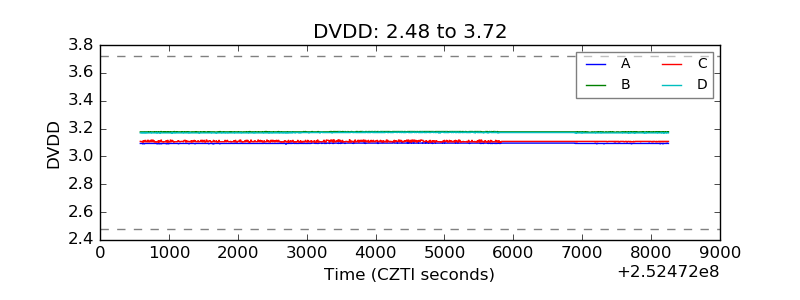 |
| Temperature 1 | 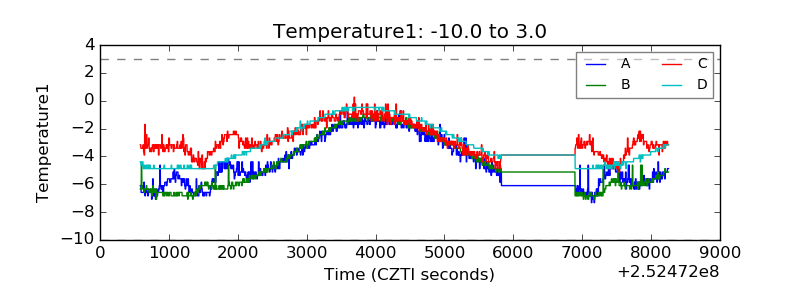 |
| Veto HV Monitor | 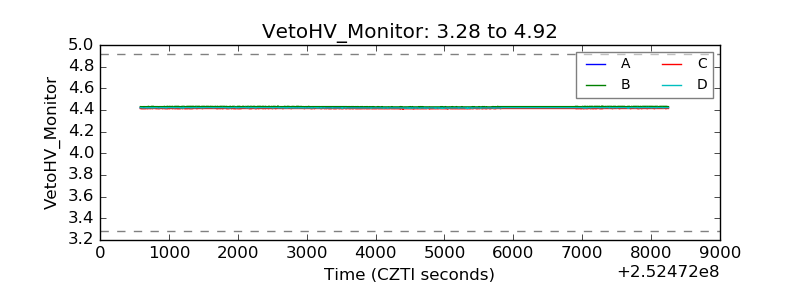 |
| Veto LLD | 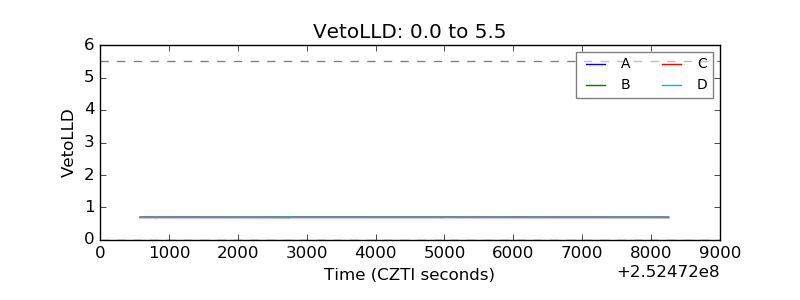 |
| Alpha Counter | 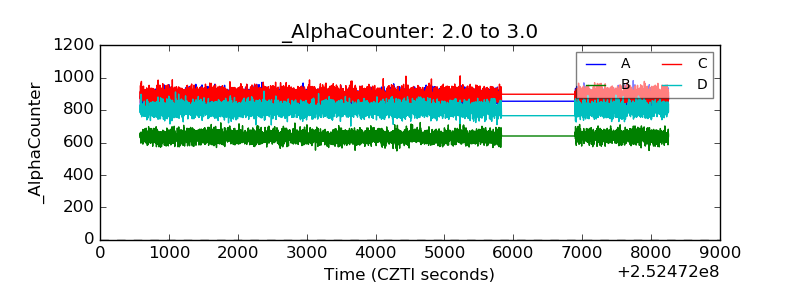 |
| _CPM_Rate | 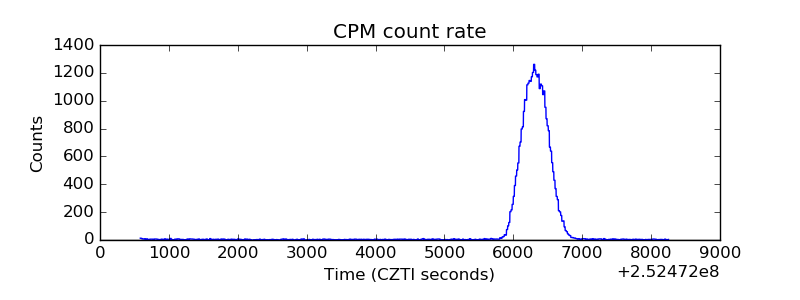 |
| CZT Counter | 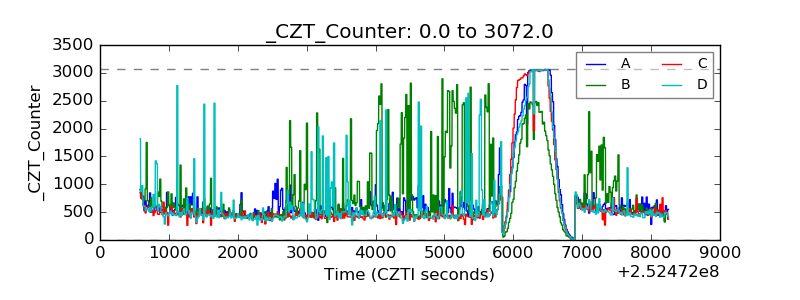 |
| +2.5 Volts monitor |  |
| +5 Volts monitor |  |
| _ROLL_ROT | 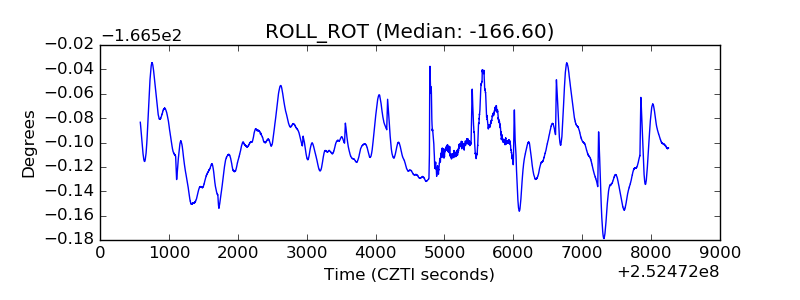 |
| _Roll_DEC | 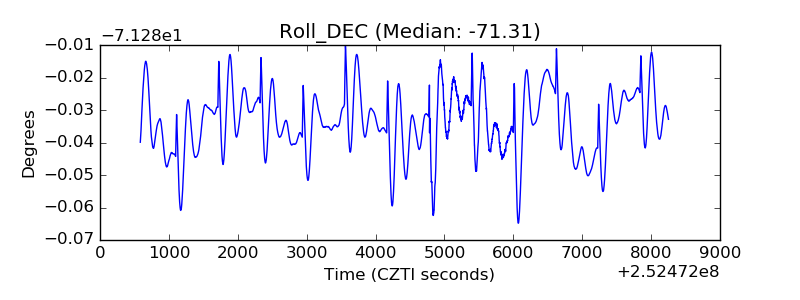 |
| _Roll_RA | 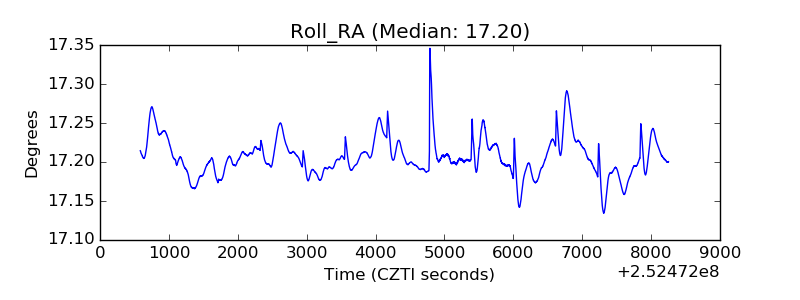 |
| Veto Counter | 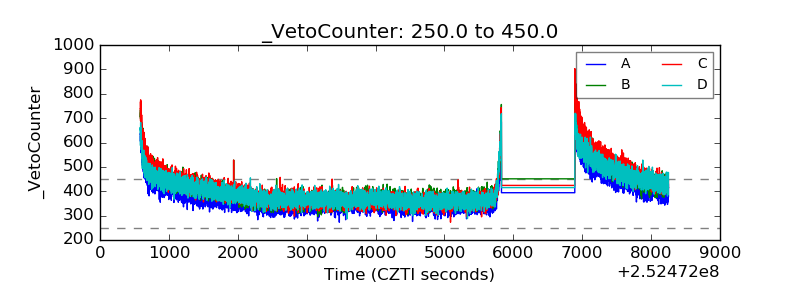 |