| Param | Original file | Final file |
|---|---|---|
| Filename | modeM0/AS1C03_014T02_9000001806_12228cztM0_level2.evt | modeM0/AS1C03_014T02_9000001806_12228cztM0_level2_quad_clean.evt |
| Size (bytes) | 512,812,800 | 124,652,160 |
| Size | 489.1 MB | 118.9 MB |
| Events in quadrant A | 3,694,885 | 854,350 |
| Events in quadrant B | 5,230,870 | 806,871 |
| Events in quadrant C | 2,978,885 | 858,408 |
| Events in quadrant D | 3,199,881 | 817,628 |
| Mode M9 | |||
|---|---|---|---|
| Quadrant | BADHDUFLAG | Total packets | Discarded packets |
| A | 0 | 12 | 0 |
| B | 0 | 12 | 0 |
| C | 0 | 12 | 0 |
| D | 0 | 12 | 0 |
| Mode M0 | |||
|---|---|---|---|
| Quadrant | BADHDUFLAG | Total packets | Discarded packets |
| A | 0 | 15108 | 2 |
| B | 0 | 19617 | 1 |
| C | 0 | 13095 | 1 |
| D | 0 | 13686 | 1 |
| Mode SS | |||
|---|---|---|---|
| Quadrant | BADHDUFLAG | Total packets | Discarded packets |
| A | 0 | 126 | 0 |
| B | 0 | 126 | 0 |
| C | 0 | 126 | 0 |
| D | 0 | 126 | 0 |
| Quadrant | Total seconds | Saturated seconds | Saturation percentage |
|---|---|---|---|
| A | 6281 | 105 | 1.671708% |
| B | 6281 | 894 | 14.233402% |
| C | 6281 | 63 | 1.003025% |
| D | 6281 | 116 | 1.846840% |
Noise dominated data is calculated using 1-second bins in cleaned event files. If a bin has >2000 counts, and if more than 50% of those come from <1% of pixels, then it is considered to be noise-dominated and hence unusable.
| Quadrant | # 1 sec bins | Bins with >0 counts | Bins with >2000 counts | High rate bins dominated by noise | Noise dominated (total time) | Noise dominated (detector-on time) | Marked lightcurve |
|---|---|---|---|---|---|---|---|
| A | 7427 | 6283 | 4 | 4 | 0.05% | 0.06% | 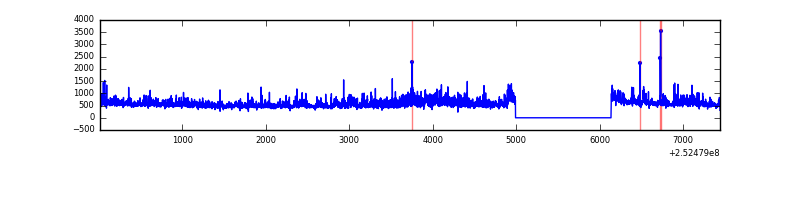 |
| B | 7427 | 6281 | 515 | 515 | 6.93% | 8.20% | 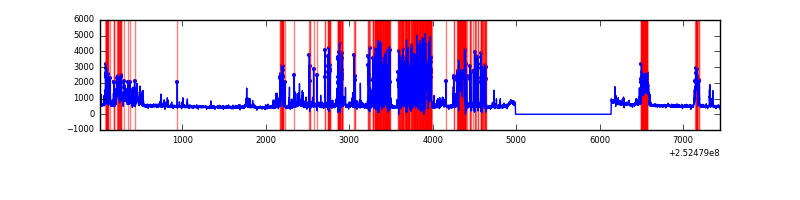 |
| C | 7427 | 6283 | 0 | 0 | 0.00% | 0.00% | 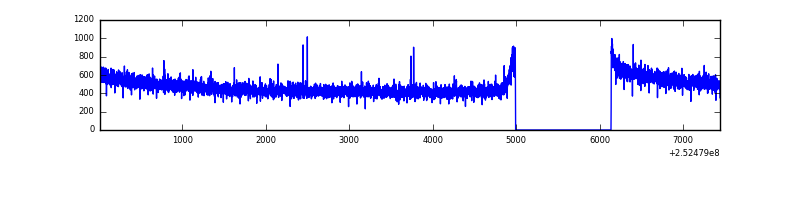 |
| D | 7427 | 6283 | 51 | 51 | 0.69% | 0.81% |  |
Top three noisy pixels from each quadrant. If the there are fewer than three noisy pixels in the level2.evt file, extra rows are filled as -1
| Pixel properties | Quadrant properties | ||||||
|---|---|---|---|---|---|---|---|
| Quadrant | DetID | PixID | Counts | Sigma | Mean | Median | Sigma |
| A | 13 | 251 | 199559 | 1284.59 | 775 | 760 | 154.8 |
| A | 1 | 162 | 186046 | 1197.27 | 775 | 760 | 154.8 |
| A | 1 | 178 | 103231 | 662.14 | 775 | 760 | 154.8 |
| B | 4 | 239 | 2205480 | 16281.58 | 725 | 708 | 135.4 |
| B | 11 | 51 | 87245 | 639.05 | 725 | 708 | 135.4 |
| B | 3 | 209 | 32535 | 235.03 | 725 | 708 | 135.4 |
| C | 13 | 61 | 5647 | 28.18 | 760 | 763 | 173.3 |
| C | 4 | 175 | 3964 | 18.47 | 760 | 763 | 173.3 |
| C | 8 | 128 | 3957 | 18.43 | 760 | 763 | 173.3 |
| D | 1 | 52 | 191109 | 1078.67 | 754 | 736 | 176.5 |
| D | 13 | 104 | 39718 | 220.88 | 754 | 736 | 176.5 |
| D | 2 | 234 | 28115 | 155.13 | 754 | 736 | 176.5 |
Histogram calculated using DETX and DETY for each event in the final _common_clean file
| Quadrant A |  |
 |
Quadrant B |
|---|---|---|---|
| Quadrant D | 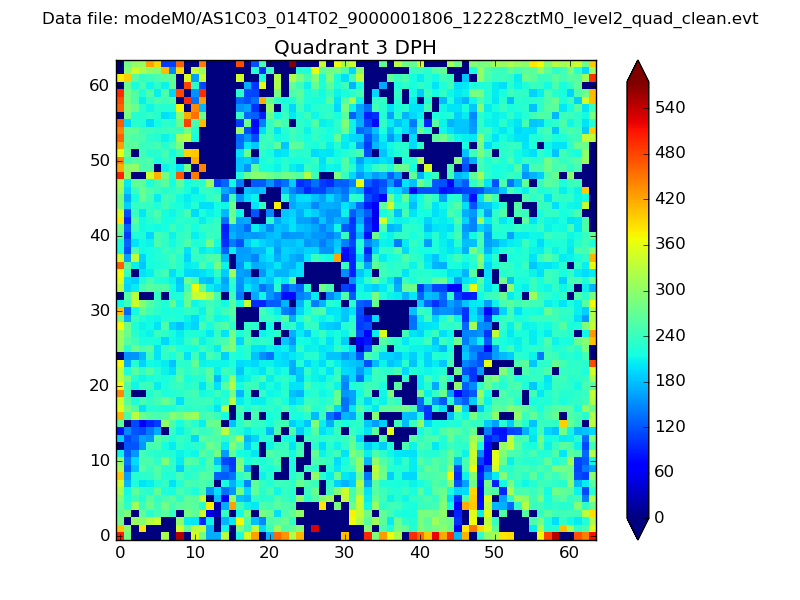 |
 |
Quadrant C |
| Plot type | Count rate plots | Images |
|---|---|---|
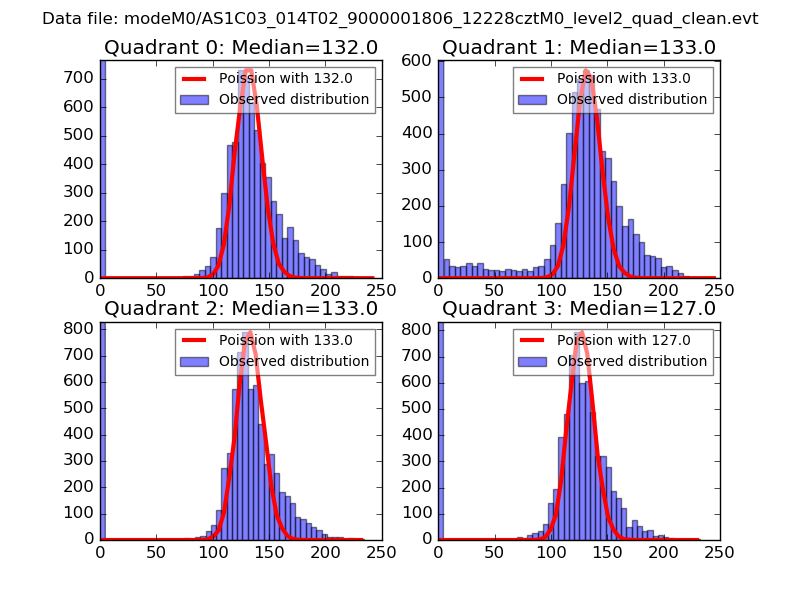
| Comparison with Poisson distribution Blue bars denote a histogram of data divided into 1 sec bins. Red curve is a Poisson curve with rate = median count rate of data. |
 |
 |
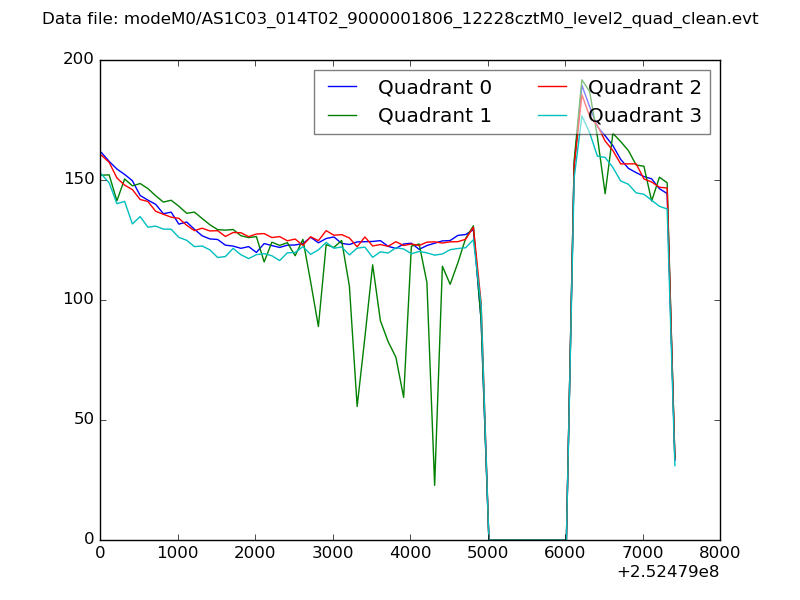
| Quadrant-wise count rates Data is divided into 100 sec bins |
 |
|
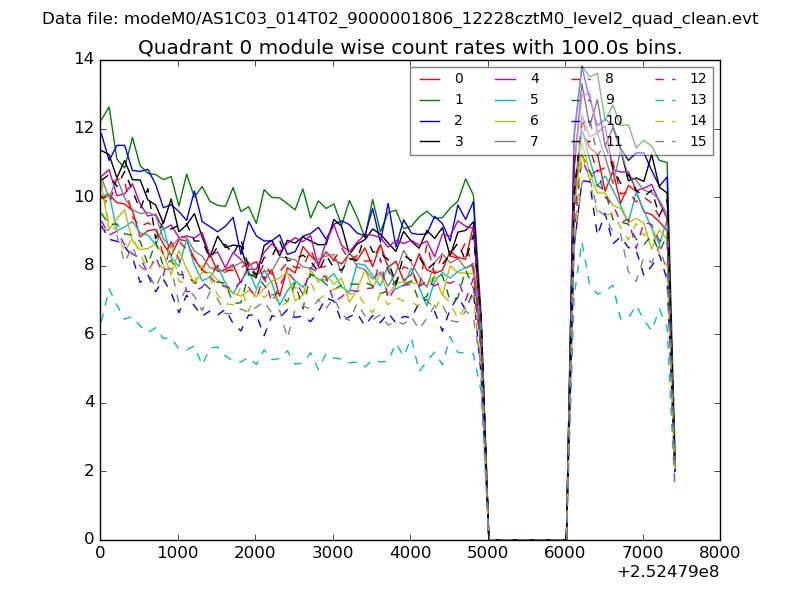
| Module-wise count rates for Quadrant A Data is divided into 100 sec bins |
 |
 |
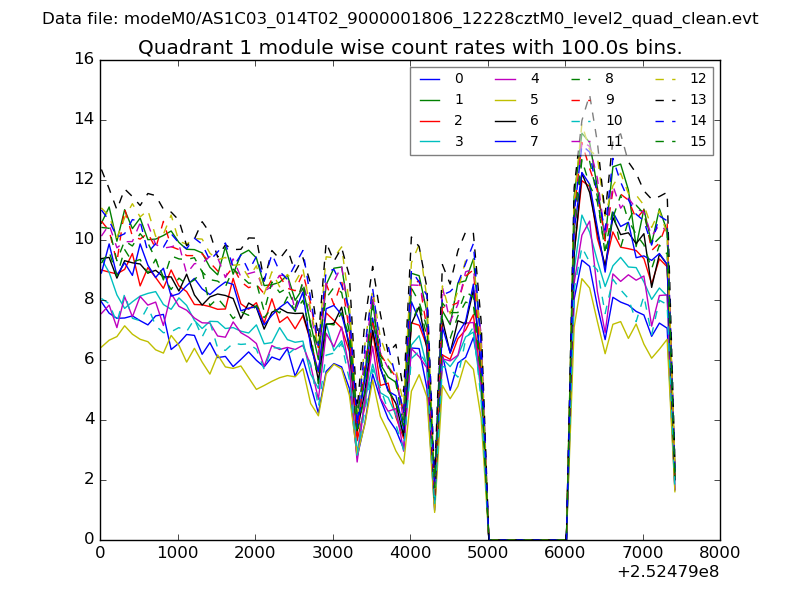
| Module-wise count rates for Quadrant B Data is divided into 100 sec bins |
 |
 |
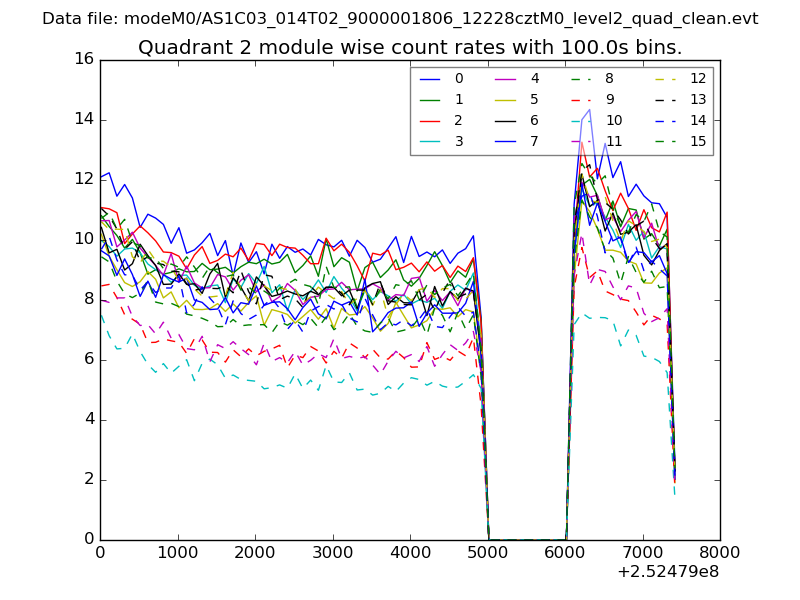
| Module-wise count rates for Quadrant C Data is divided into 100 sec bins |
 |
 |
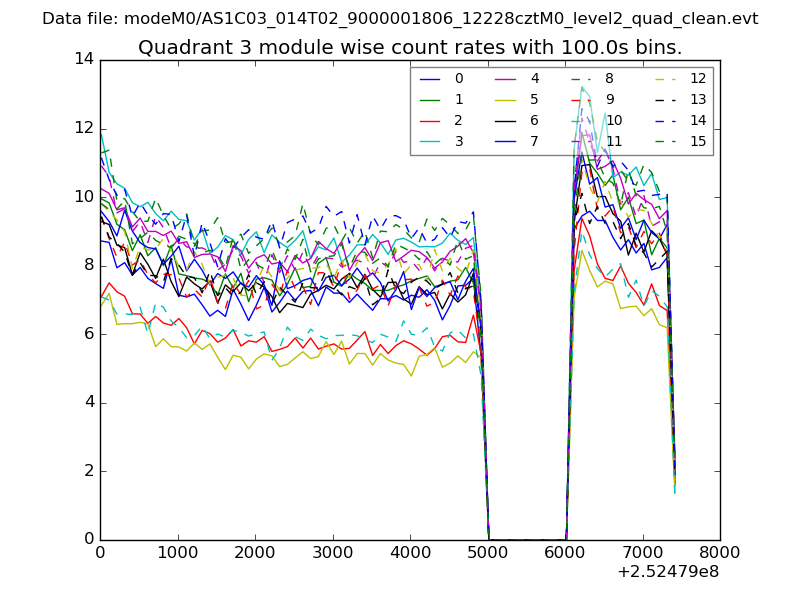
| Module-wise count rates for Quadrant D Data is divided into 100 sec bins |
 |
 |
| Parameter | Plot |
|---|---|
| CZT HV Monitor | 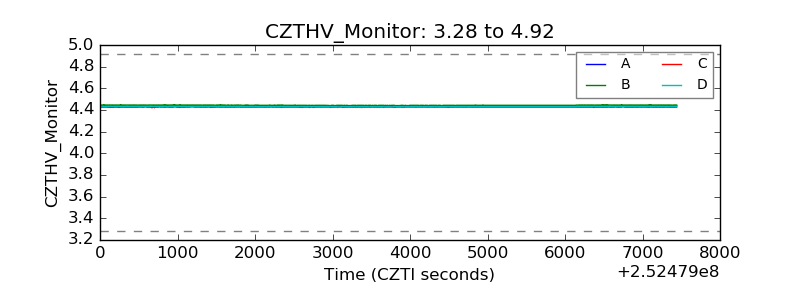 |
| D_VDD | 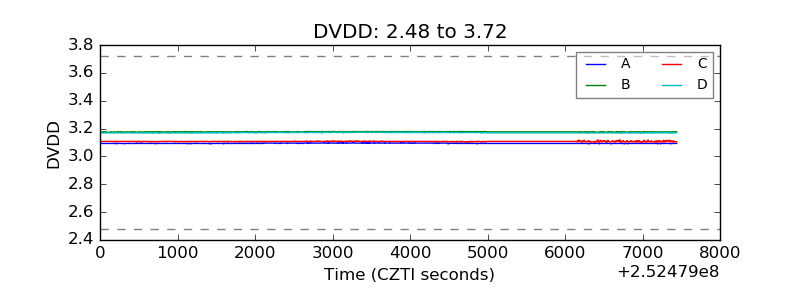 |
| Temperature 1 | 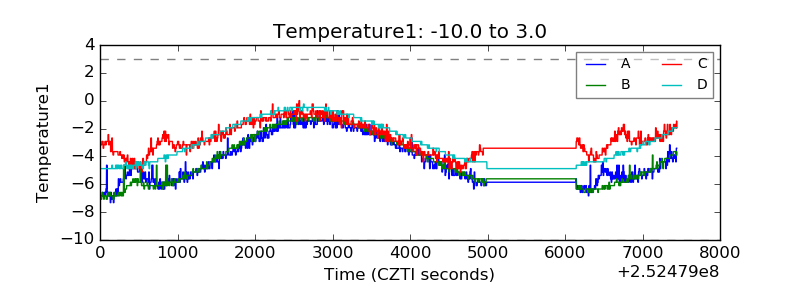 |
| Veto HV Monitor | 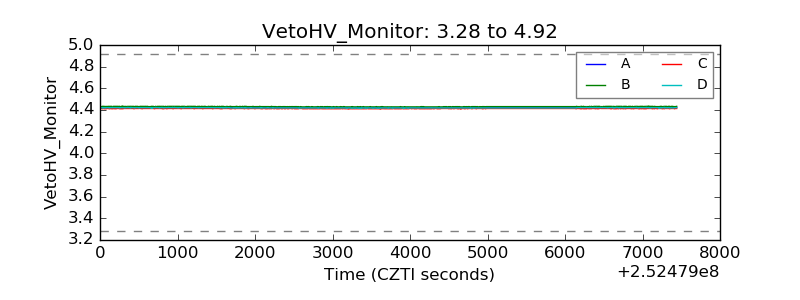 |
| Veto LLD | 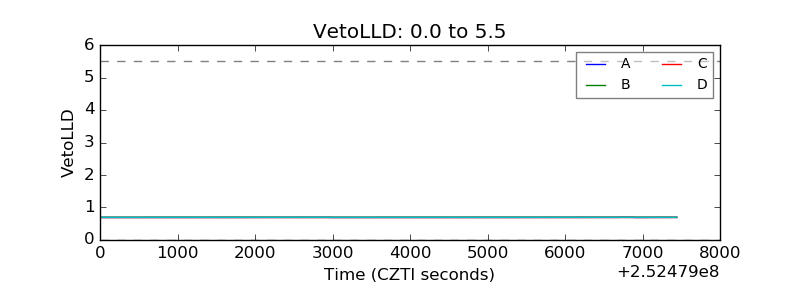 |
| Alpha Counter | 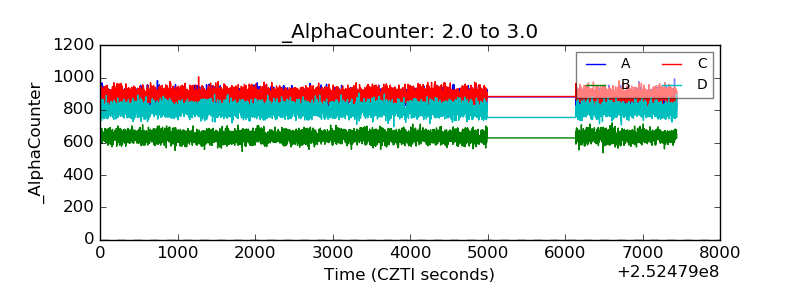 |
| _CPM_Rate | 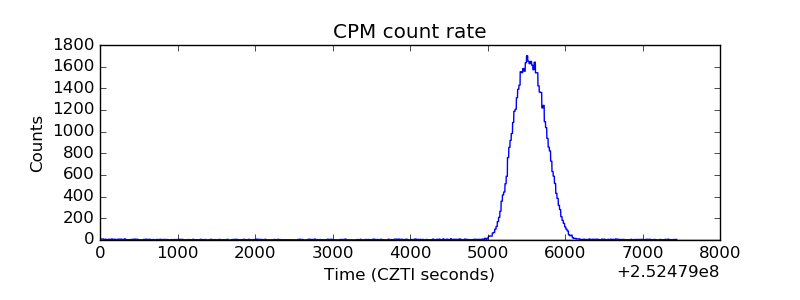 |
| CZT Counter |  |
| +2.5 Volts monitor |  |
| +5 Volts monitor | 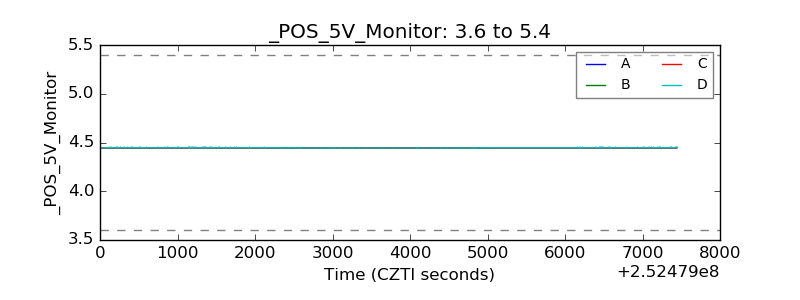 |
| _ROLL_ROT | 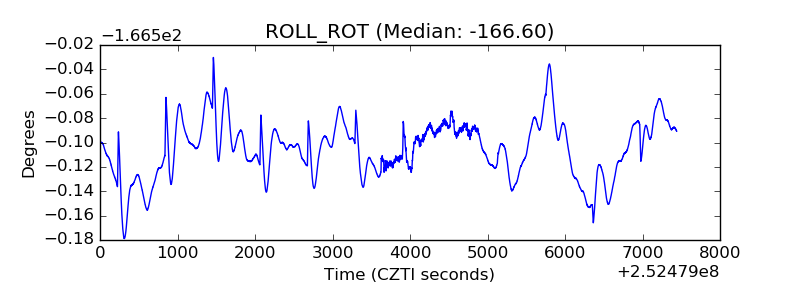 |
| _Roll_DEC | 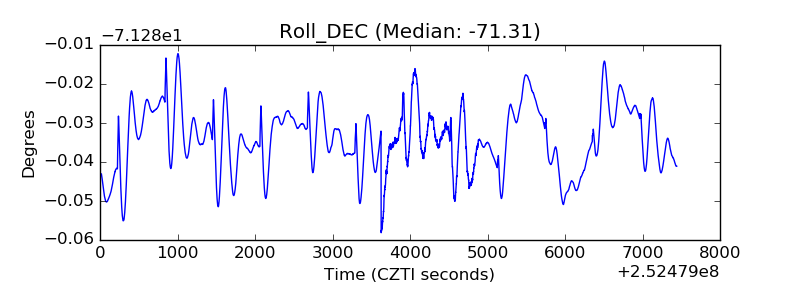 |
| _Roll_RA | 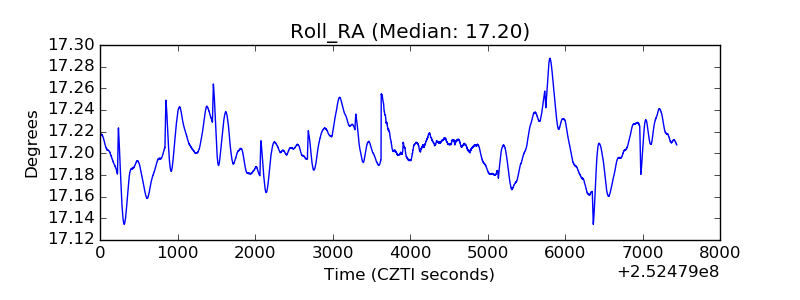 |
| Veto Counter | 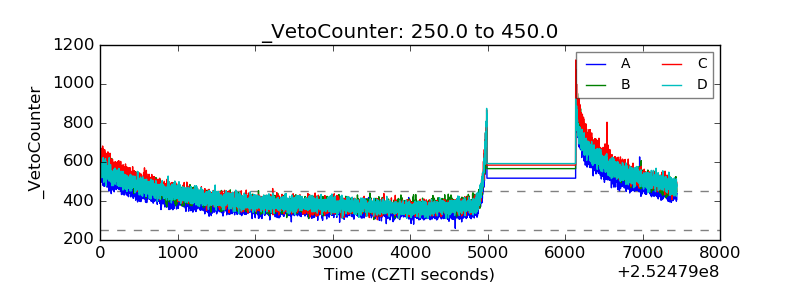 |