| Param | Original file | Final file |
|---|---|---|
| Filename | modeM0/AS1C03_014T02_9000001806_12229cztM0_level2.evt | modeM0/AS1C03_014T02_9000001806_12229cztM0_level2_quad_clean.evt |
| Size (bytes) | 487,117,440 | 126,630,720 |
| Size | 464.6 MB | 120.8 MB |
| Events in quadrant A | 3,657,537 | 866,436 |
| Events in quadrant B | 4,311,954 | 852,521 |
| Events in quadrant C | 2,975,266 | 869,515 |
| Events in quadrant D | 3,398,892 | 826,129 |
| Mode M9 | |||
|---|---|---|---|
| Quadrant | BADHDUFLAG | Total packets | Discarded packets |
| A | 0 | 12 | 0 |
| B | 0 | 12 | 0 |
| C | 0 | 12 | 0 |
| D | 0 | 12 | 0 |
| Mode M0 | |||
|---|---|---|---|
| Quadrant | BADHDUFLAG | Total packets | Discarded packets |
| A | 0 | 14840 | 2 |
| B | 0 | 16683 | 1 |
| C | 0 | 12896 | 1 |
| D | 0 | 14035 | 1 |
| Mode SS | |||
|---|---|---|---|
| Quadrant | BADHDUFLAG | Total packets | Discarded packets |
| A | 0 | 122 | 0 |
| B | 0 | 122 | 0 |
| C | 0 | 122 | 0 |
| D | 0 | 122 | 0 |
| Quadrant | Total seconds | Saturated seconds | Saturation percentage |
|---|---|---|---|
| A | 6023 | 89 | 1.477669% |
| B | 6023 | 488 | 8.102275% |
| C | 6023 | 58 | 0.962975% |
| D | 6023 | 144 | 2.390835% |
Noise dominated data is calculated using 1-second bins in cleaned event files. If a bin has >2000 counts, and if more than 50% of those come from <1% of pixels, then it is considered to be noise-dominated and hence unusable.
| Quadrant | # 1 sec bins | Bins with >0 counts | Bins with >2000 counts | High rate bins dominated by noise | Noise dominated (total time) | Noise dominated (detector-on time) | Marked lightcurve |
|---|---|---|---|---|---|---|---|
| A | 7269 | 6024 | 7 | 7 | 0.10% | 0.12% | 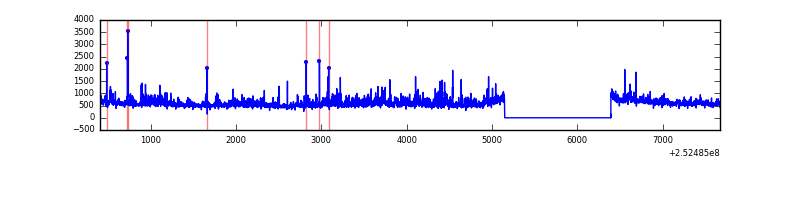 |
| B | 7269 | 6025 | 252 | 252 | 3.47% | 4.18% | 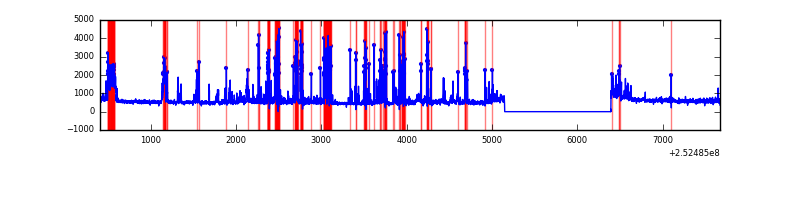 |
| C | 7269 | 6024 | 0 | 0 | 0.00% | 0.00% |  |
| D | 7269 | 6024 | 64 | 64 | 0.88% | 1.06% | 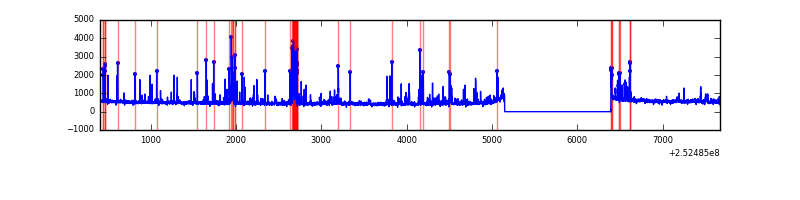 |
Top three noisy pixels from each quadrant. If the there are fewer than three noisy pixels in the level2.evt file, extra rows are filled as -1
| Pixel properties | Quadrant properties | ||||||
|---|---|---|---|---|---|---|---|
| Quadrant | DetID | PixID | Counts | Sigma | Mean | Median | Sigma |
| A | 13 | 251 | 215743 | 1393.94 | 770 | 756 | 154.2 |
| A | 1 | 162 | 134384 | 866.42 | 770 | 756 | 154.2 |
| A | 8 | 15 | 116057 | 747.59 | 770 | 756 | 154.2 |
| B | 4 | 239 | 1100051 | 8018.35 | 745 | 729 | 137.1 |
| B | 11 | 51 | 99179 | 718.09 | 745 | 729 | 137.1 |
| B | 0 | 168 | 39492 | 282.73 | 745 | 729 | 137.1 |
| C | 15 | 208 | 41237 | 239.4 | 746 | 751 | 169.1 |
| C | 4 | 175 | 13529 | 75.56 | 746 | 751 | 169.1 |
| C | 13 | 61 | 5496 | 28.06 | 746 | 751 | 169.1 |
| D | 1 | 52 | 196662 | 1117.42 | 745 | 725 | 175.3 |
| D | 2 | 33 | 121029 | 686.09 | 745 | 725 | 175.3 |
| D | 13 | 104 | 88172 | 498.7 | 745 | 725 | 175.3 |
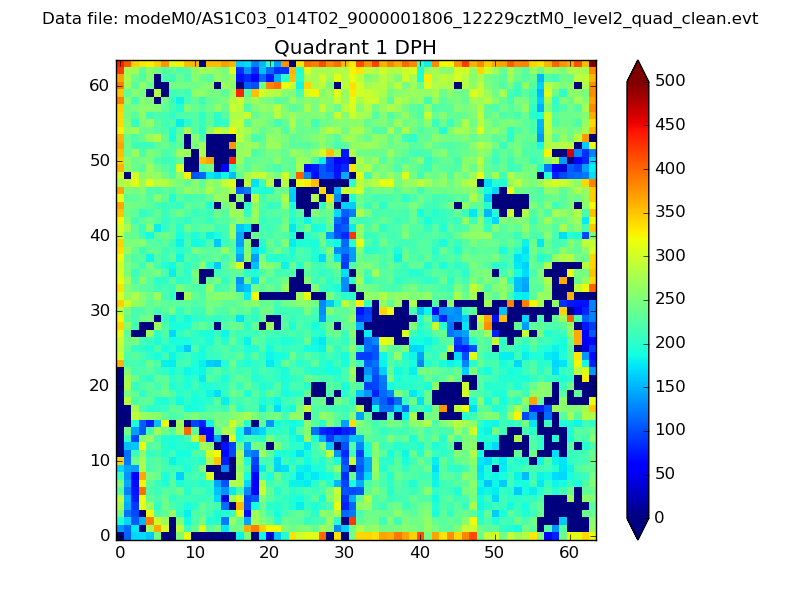
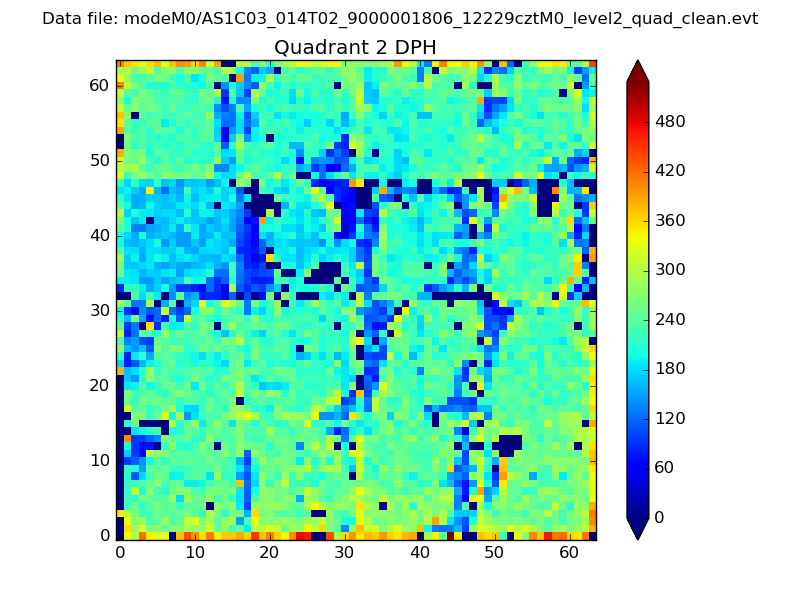
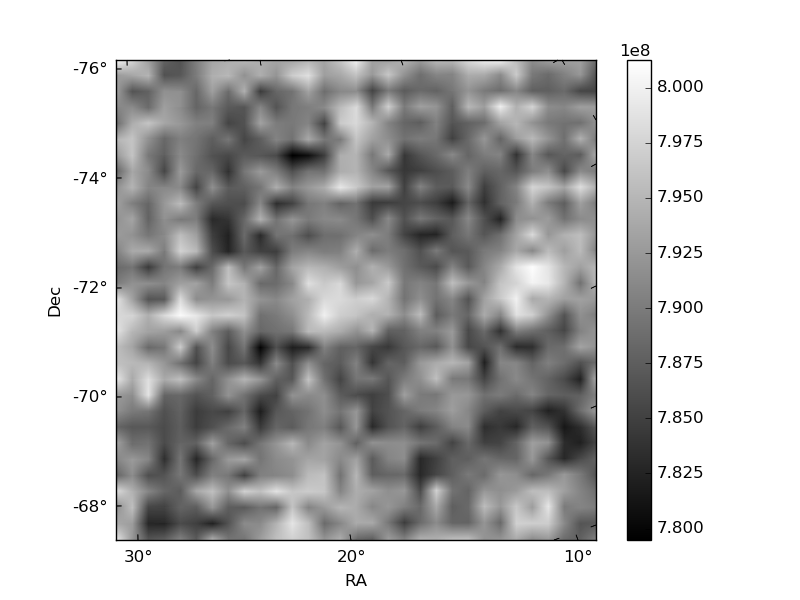
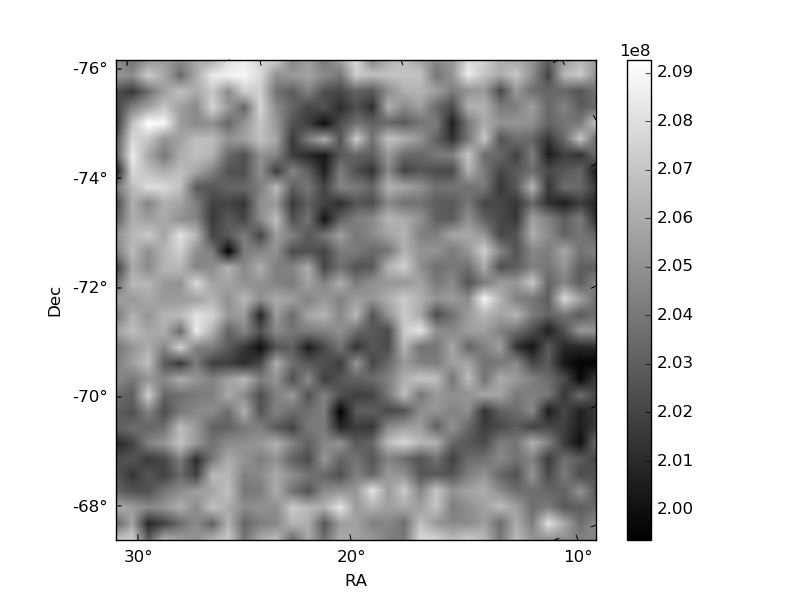
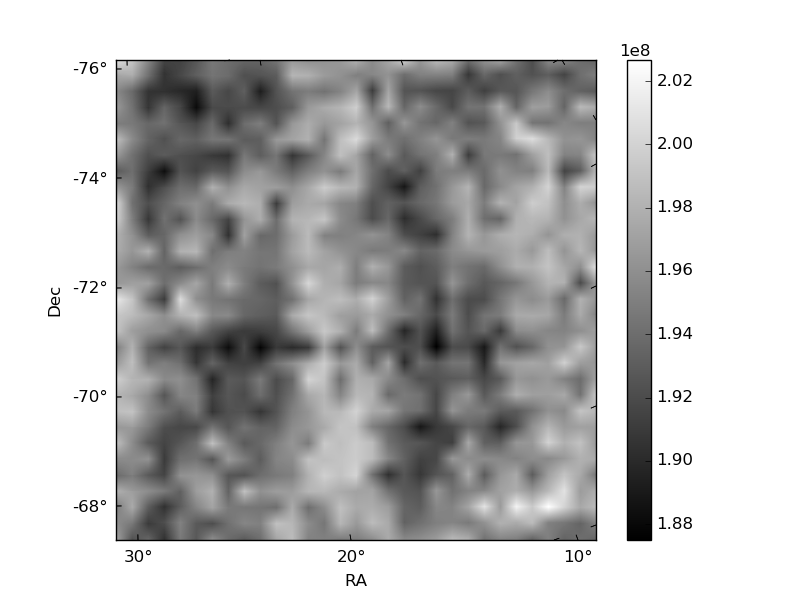
Histogram calculated using DETX and DETY for each event in the final _common_clean file
| Quadrant A | 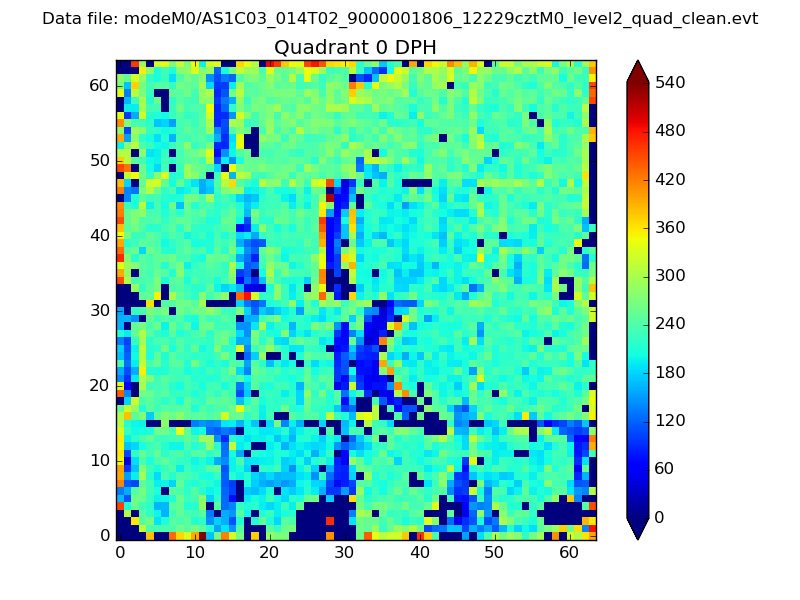 |
 |
Quadrant B |
|---|---|---|---|
| Quadrant D | 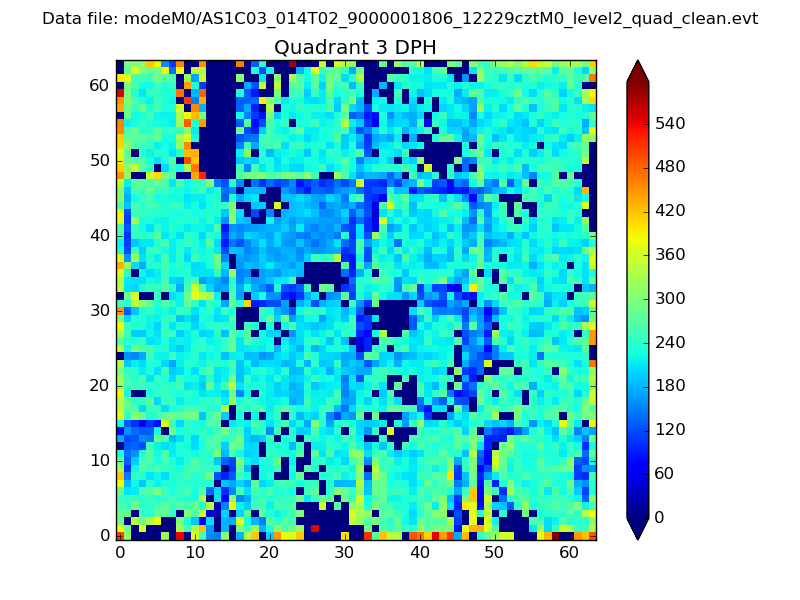 |
 |
Quadrant C |
| Plot type | Count rate plots | Images |
|---|---|---|
| Comparison with Poisson distribution Blue bars denote a histogram of data divided into 1 sec bins. Red curve is a Poisson curve with rate = median count rate of data. |
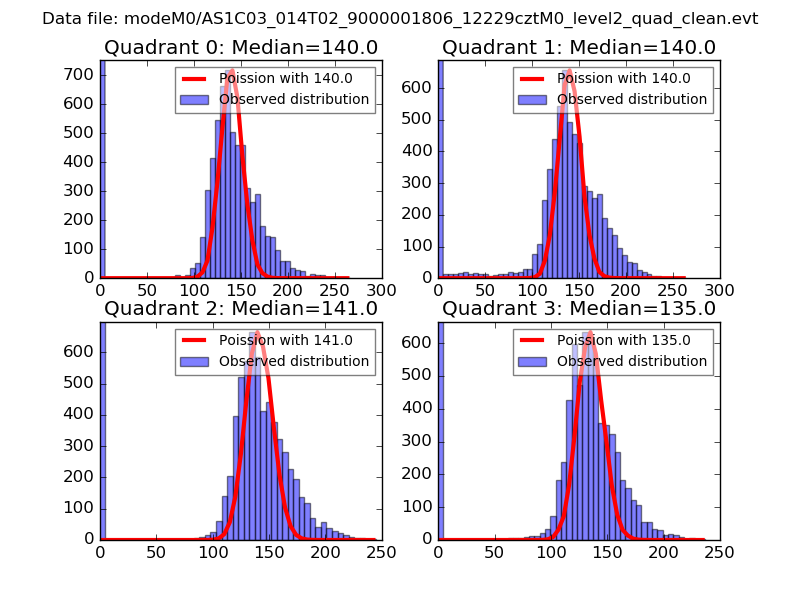 |
 |
| Quadrant-wise count rates Data is divided into 100 sec bins |
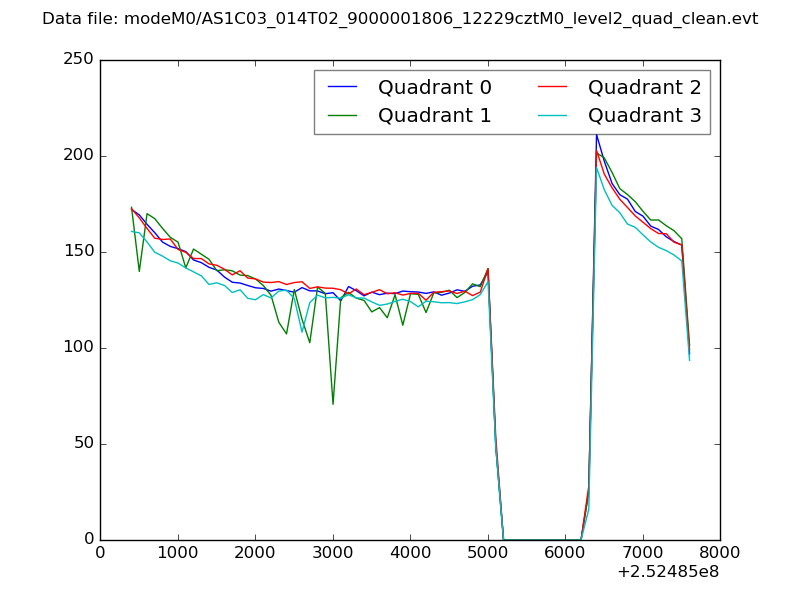 |
|
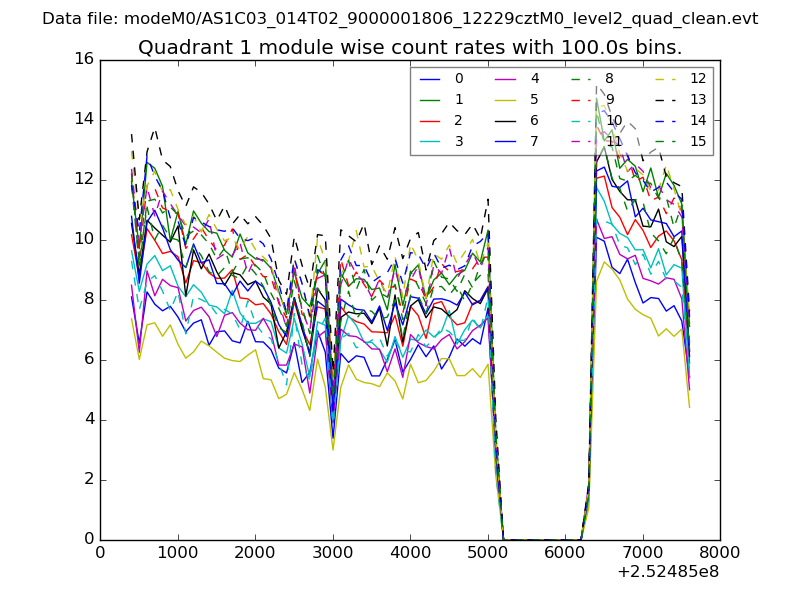
| Module-wise count rates for Quadrant A Data is divided into 100 sec bins |
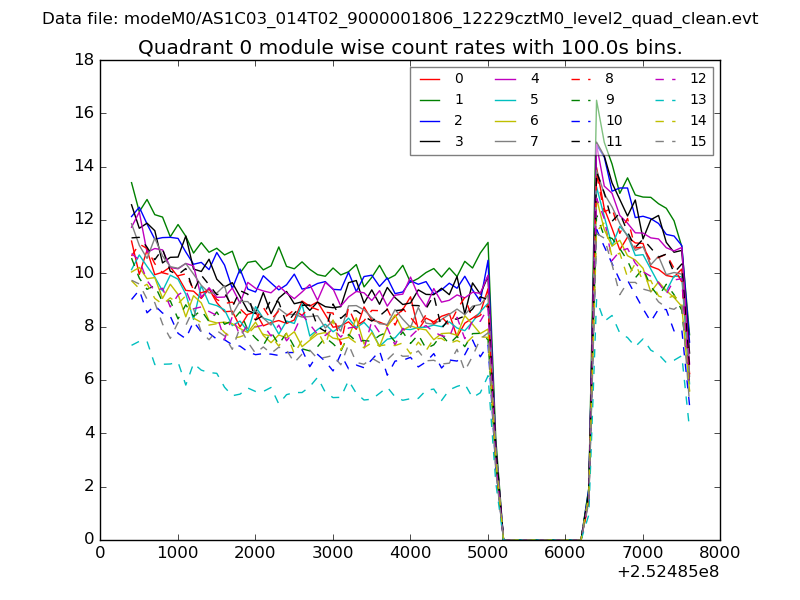 |
 |
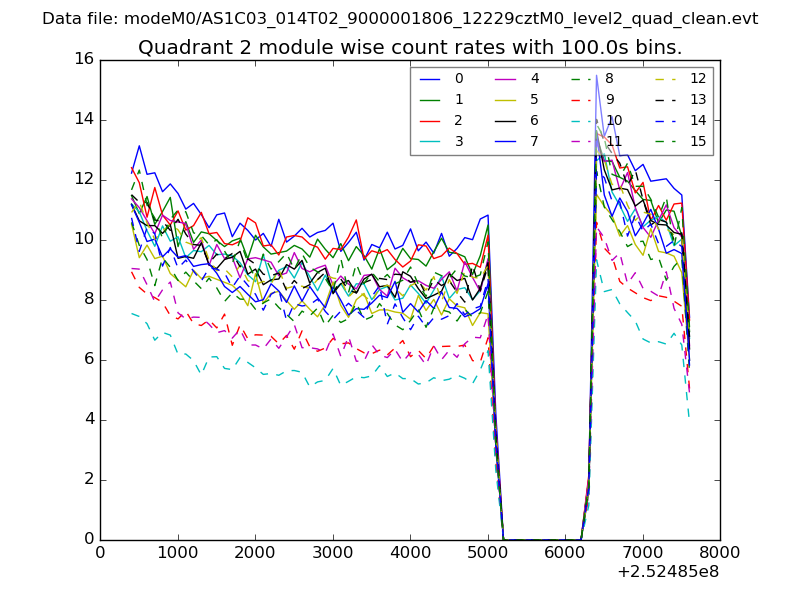
| Module-wise count rates for Quadrant B Data is divided into 100 sec bins |
 |
 |
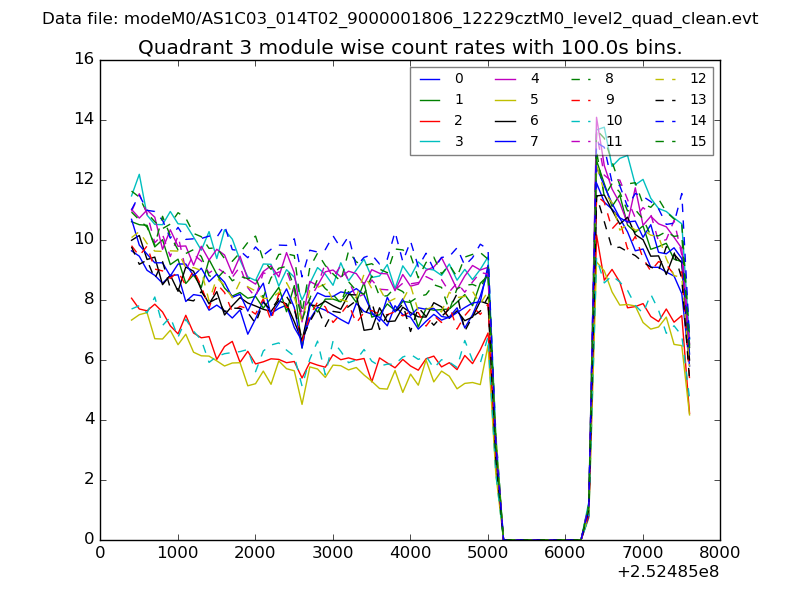
| Module-wise count rates for Quadrant C Data is divided into 100 sec bins |
 |
 |
| Module-wise count rates for Quadrant D Data is divided into 100 sec bins |
 |
 |
| Parameter | Plot |
|---|---|
| CZT HV Monitor | 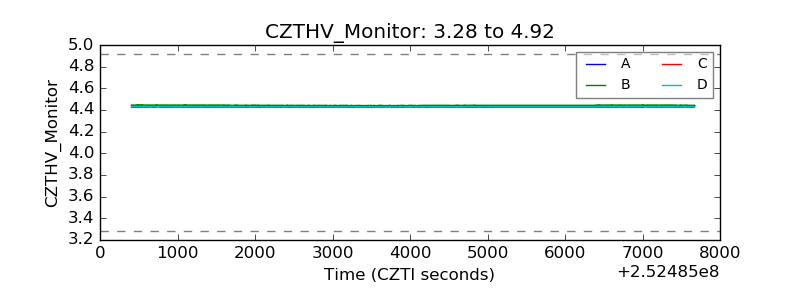 |
| D_VDD | 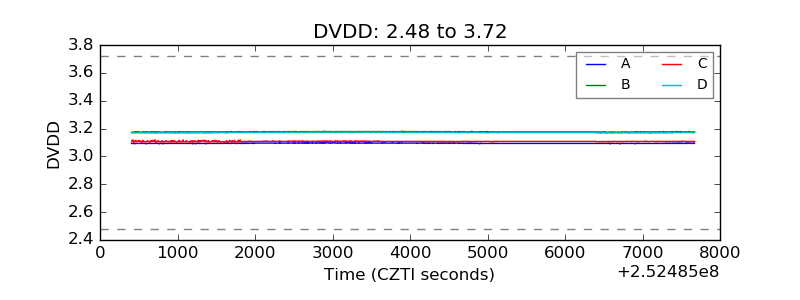 |
| Temperature 1 | 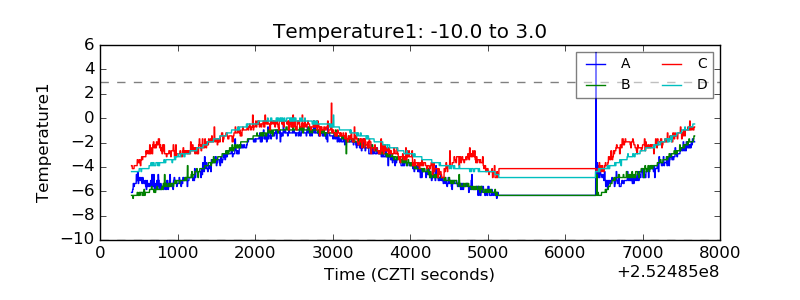 |
| Veto HV Monitor | 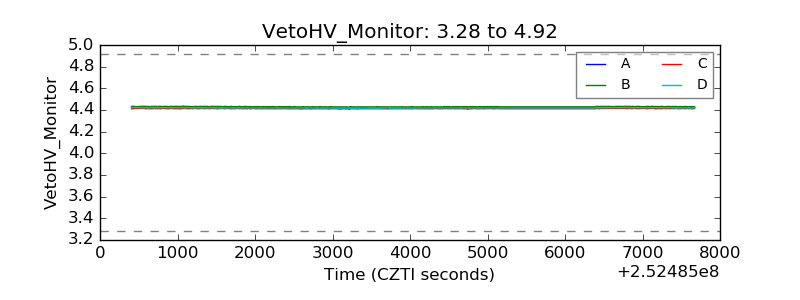 |
| Veto LLD | 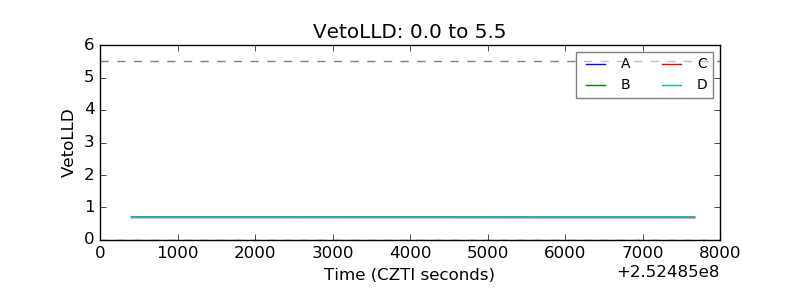 |
| Alpha Counter | 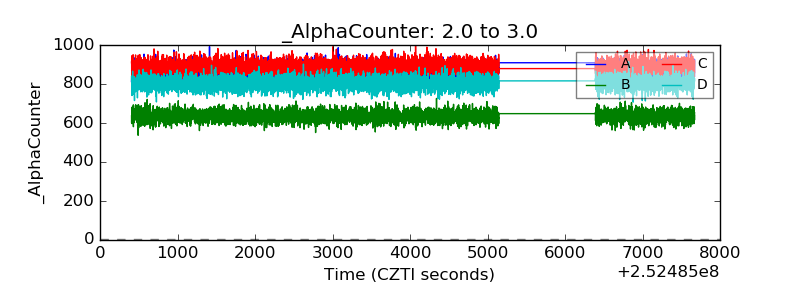 |
| _CPM_Rate | 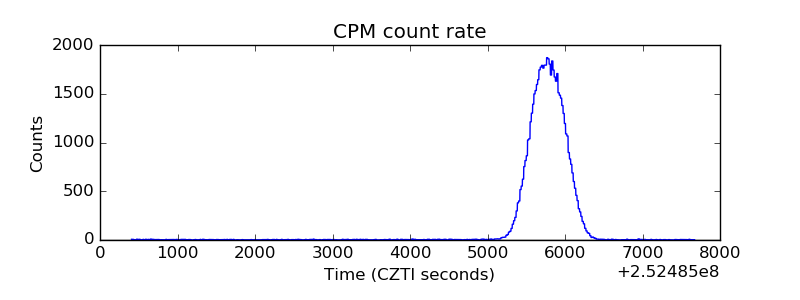 |
| CZT Counter | 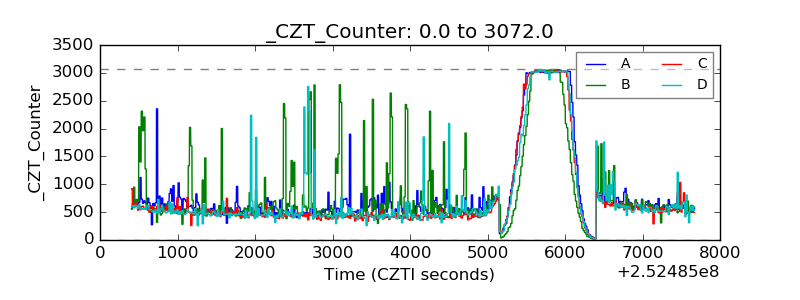 |
| +2.5 Volts monitor |  |
| +5 Volts monitor | 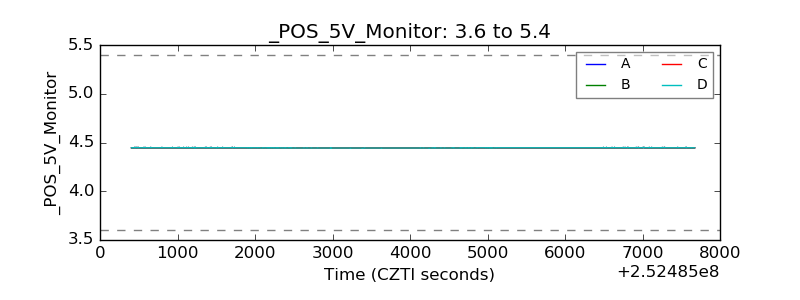 |
| _ROLL_ROT |  |
| _Roll_DEC |  |
| _Roll_RA | 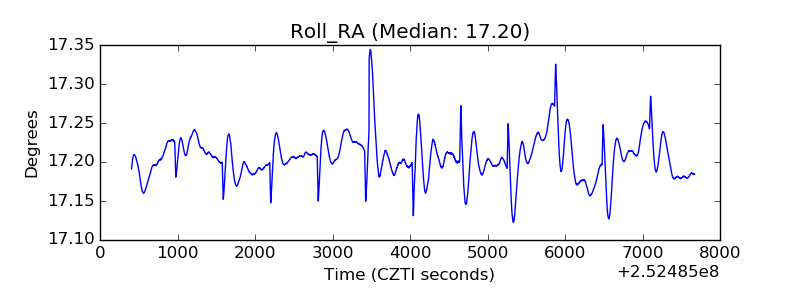 |
| Veto Counter |  |