| Param | Original file | Final file |
|---|---|---|
| Filename | modeM0/AS1C03_014T02_9000001806_12233cztM0_level2.evt | modeM0/AS1C03_014T02_9000001806_12233cztM0_level2_quad_clean.evt |
| Size (bytes) | 596,016,000 | 116,524,800 |
| Size | 568.4 MB | 111.1 MB |
| Events in quadrant A | 5,953,347 | 775,467 |
| Events in quadrant B | 4,212,386 | 778,334 |
| Events in quadrant C | 2,988,970 | 790,875 |
| Events in quadrant D | 4,469,574 | 744,533 |
| Mode M9 | |||
|---|---|---|---|
| Quadrant | BADHDUFLAG | Total packets | Discarded packets |
| A | 0 | 9 | 0 |
| B | 0 | 9 | 0 |
| C | 0 | 9 | 0 |
| D | 0 | 9 | 0 |
| Mode M0 | |||
|---|---|---|---|
| Quadrant | BADHDUFLAG | Total packets | Discarded packets |
| A | 0 | 22130 | 2 |
| B | 0 | 16674 | 1 |
| C | 0 | 13399 | 1 |
| D | 0 | 17776 | 1 |
| Mode SS | |||
|---|---|---|---|
| Quadrant | BADHDUFLAG | Total packets | Discarded packets |
| A | 0 | 128 | 0 |
| B | 0 | 128 | 0 |
| C | 0 | 128 | 0 |
| D | 0 | 128 | 0 |
| Quadrant | Total seconds | Saturated seconds | Saturation percentage |
|---|---|---|---|
| A | 6295 | 513 | 8.149325% |
| B | 6295 | 386 | 6.131851% |
| C | 6295 | 42 | 0.667196% |
| D | 6295 | 387 | 6.147736% |
Noise dominated data is calculated using 1-second bins in cleaned event files. If a bin has >2000 counts, and if more than 50% of those come from <1% of pixels, then it is considered to be noise-dominated and hence unusable.
| Quadrant | # 1 sec bins | Bins with >0 counts | Bins with >2000 counts | High rate bins dominated by noise | Noise dominated (total time) | Noise dominated (detector-on time) | Marked lightcurve |
|---|---|---|---|---|---|---|---|
| A | 7166 | 6297 | 254 | 254 | 3.54% | 4.03% | 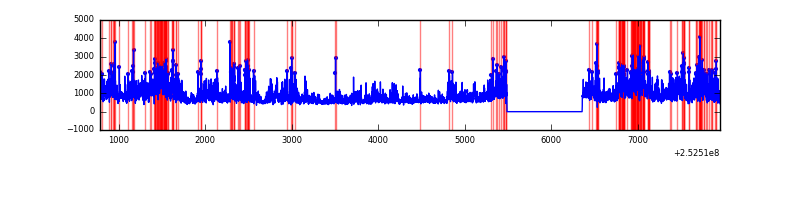 |
| B | 7166 | 6297 | 207 | 207 | 2.89% | 3.29% | 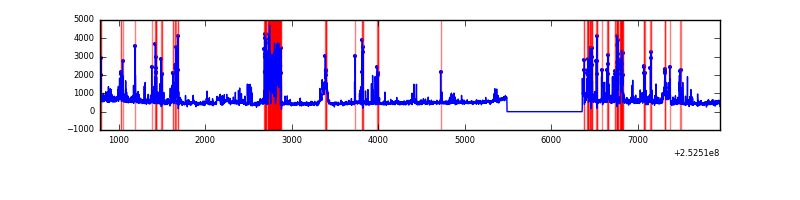 |
| C | 7166 | 6297 | 26 | 26 | 0.36% | 0.41% | 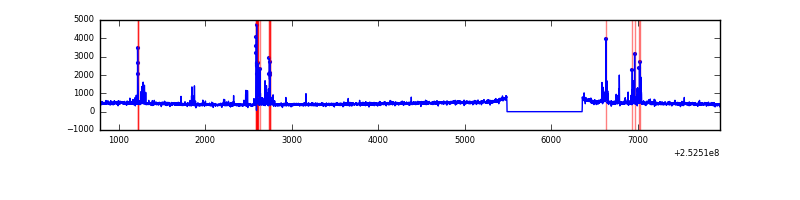 |
| D | 7166 | 6297 | 289 | 289 | 4.03% | 4.59% | 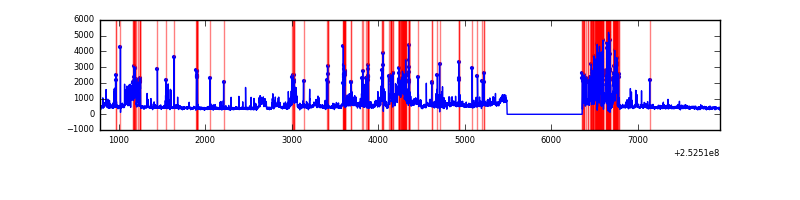 |
Top three noisy pixels from each quadrant. If the there are fewer than three noisy pixels in the level2.evt file, extra rows are filled as -1
| Pixel properties | Quadrant properties | ||||||
|---|---|---|---|---|---|---|---|
| Quadrant | DetID | PixID | Counts | Sigma | Mean | Median | Sigma |
| A | 13 | 251 | 2713398 | 18425.57 | 715 | 699 | 147.2 |
| A | 1 | 162 | 148850 | 1006.29 | 715 | 699 | 147.2 |
| A | 1 | 178 | 85267 | 574.41 | 715 | 699 | 147.2 |
| B | 4 | 239 | 762430 | 5702.38 | 710 | 694 | 133.6 |
| B | 11 | 51 | 185565 | 1383.95 | 710 | 694 | 133.6 |
| B | 10 | 246 | 156195 | 1164.08 | 710 | 694 | 133.6 |
| C | 15 | 208 | 210800 | 1313.02 | 697 | 699 | 160.0 |
| C | 4 | 175 | 49862 | 307.24 | 697 | 699 | 160.0 |
| C | 0 | 207 | 7333 | 41.46 | 697 | 699 | 160.0 |
| D | 1 | 52 | 1061678 | 6369.9 | 683 | 662 | 166.6 |
| D | 13 | 104 | 303055 | 1815.44 | 683 | 662 | 166.6 |
| D | 12 | 221 | 172569 | 1032.06 | 683 | 662 | 166.6 |
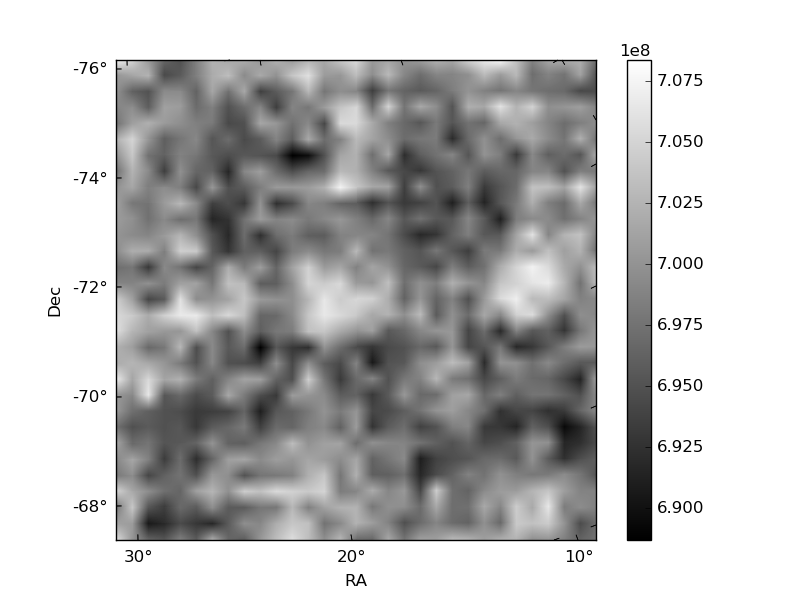
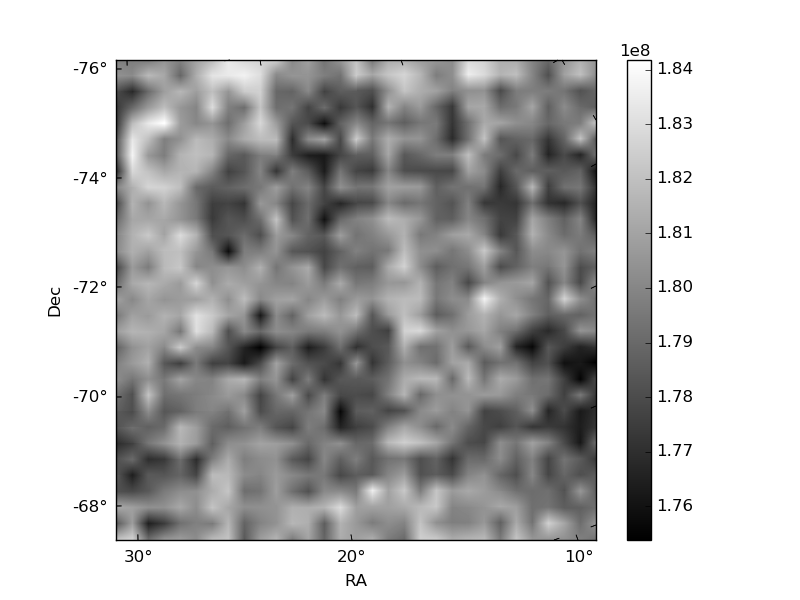
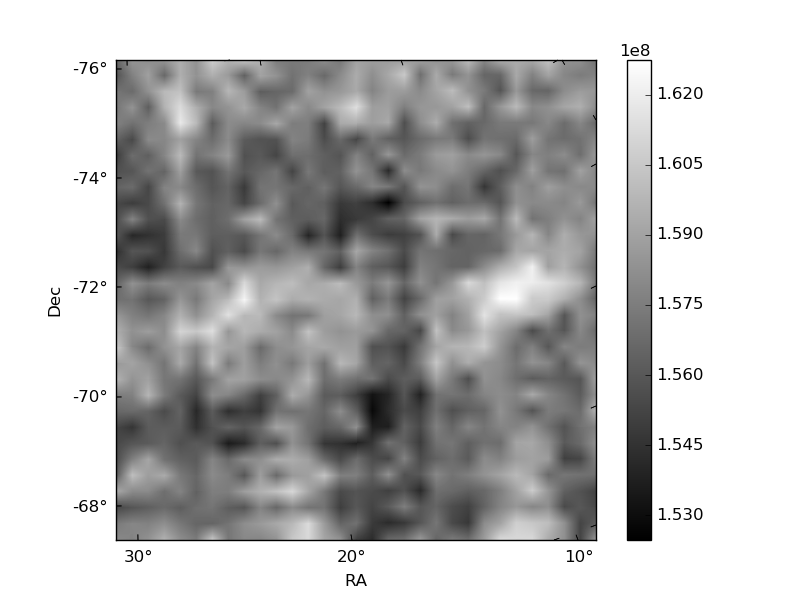
Histogram calculated using DETX and DETY for each event in the final _common_clean file
| Quadrant A | 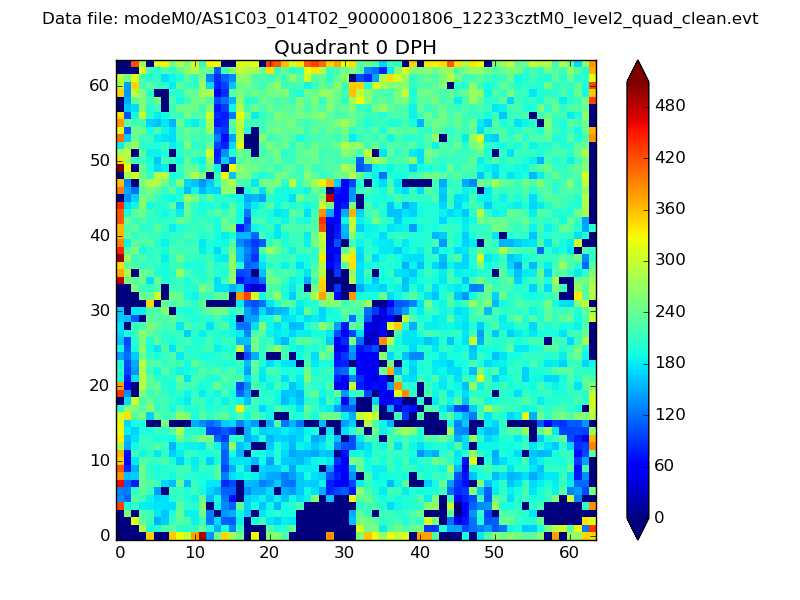 |
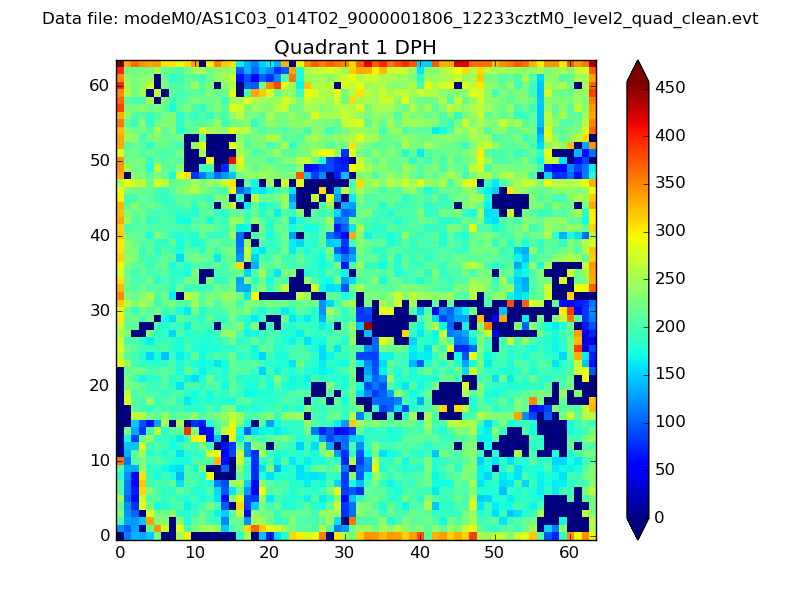 |
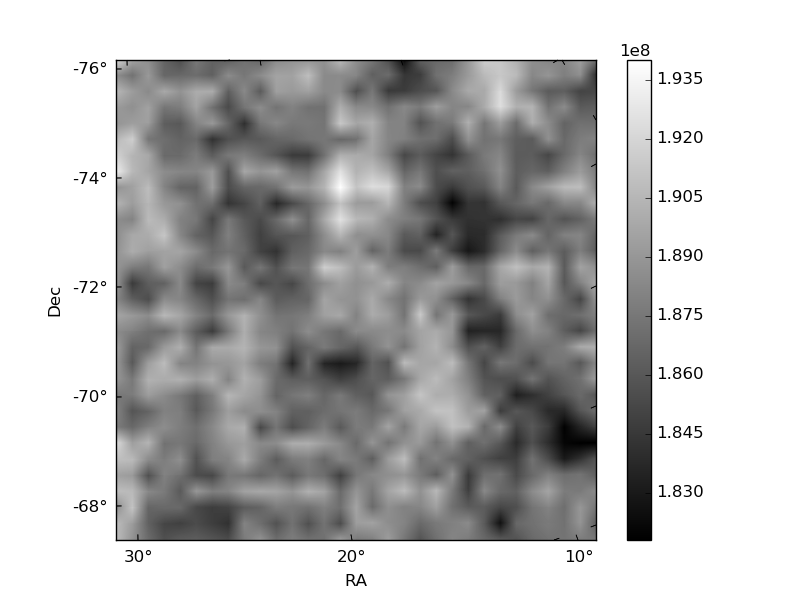
Quadrant B |
|---|---|---|---|
| Quadrant D | 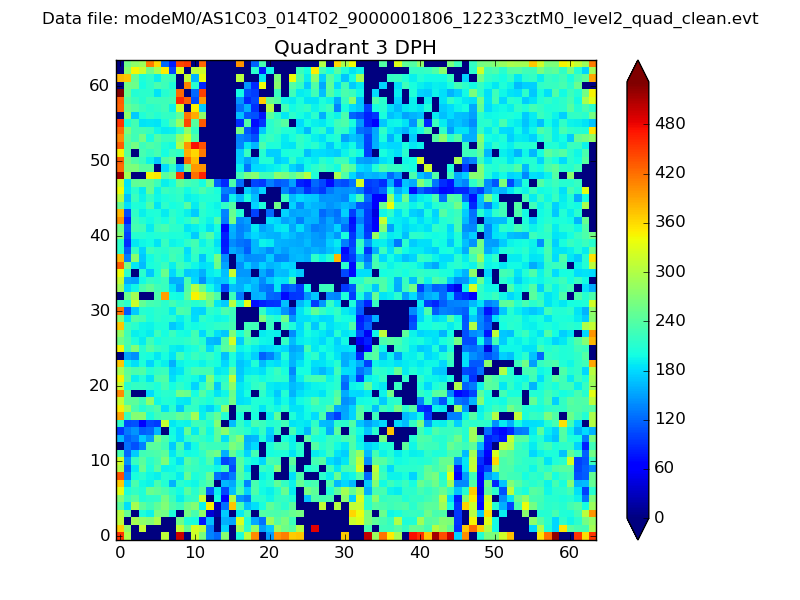 |
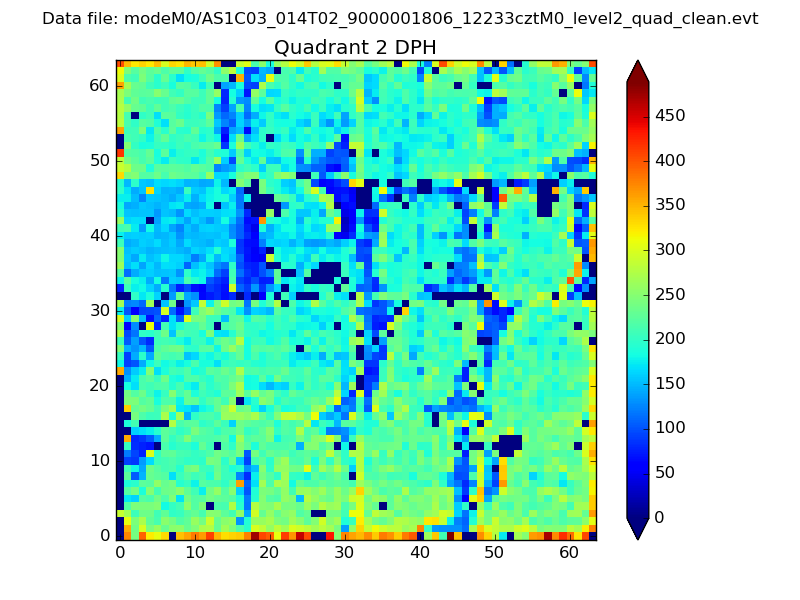 |
Quadrant C |
| Plot type | Count rate plots | Images |
|---|---|---|
| Comparison with Poisson distribution Blue bars denote a histogram of data divided into 1 sec bins. Red curve is a Poisson curve with rate = median count rate of data. |
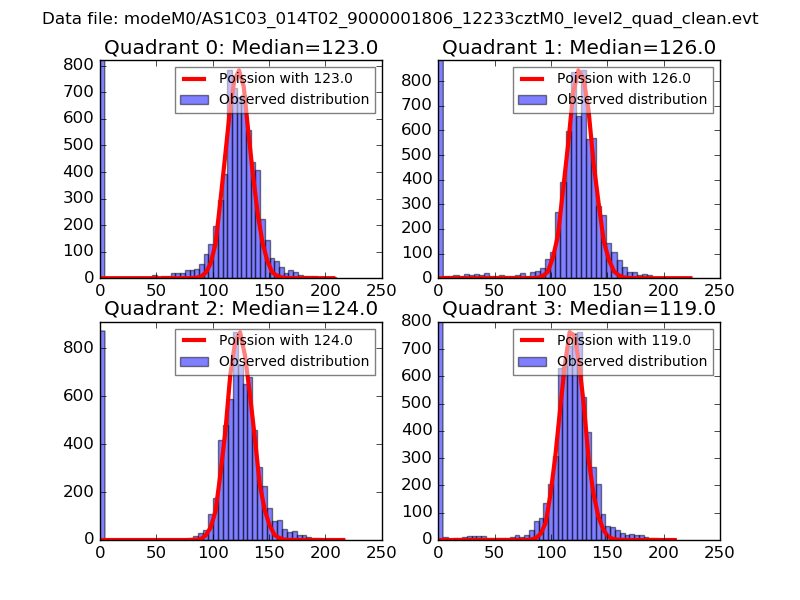 |
 |
| Quadrant-wise count rates Data is divided into 100 sec bins |
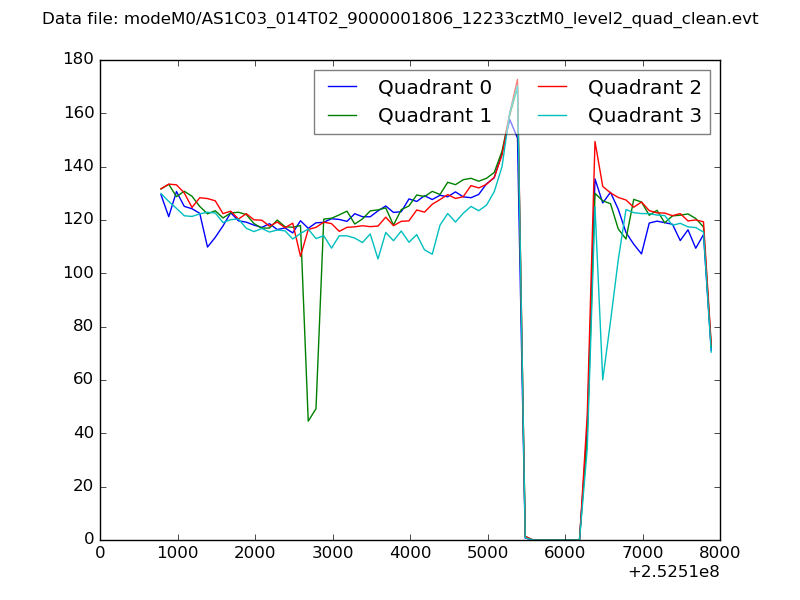 |
|
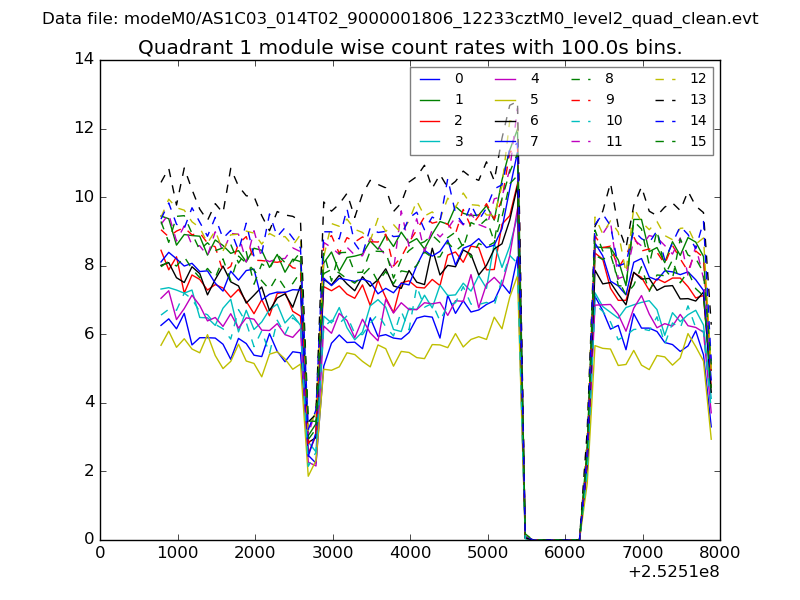
| Module-wise count rates for Quadrant A Data is divided into 100 sec bins |
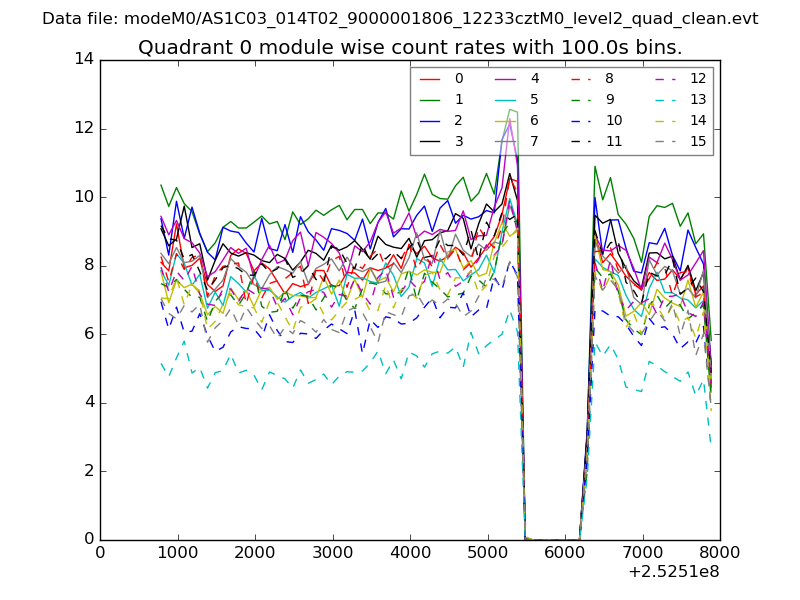 |
 |
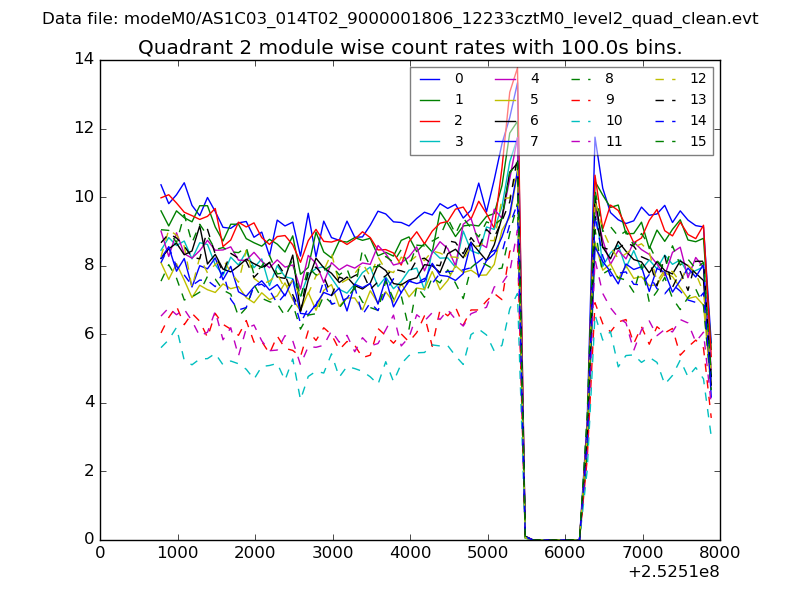
| Module-wise count rates for Quadrant B Data is divided into 100 sec bins |
 |
 |
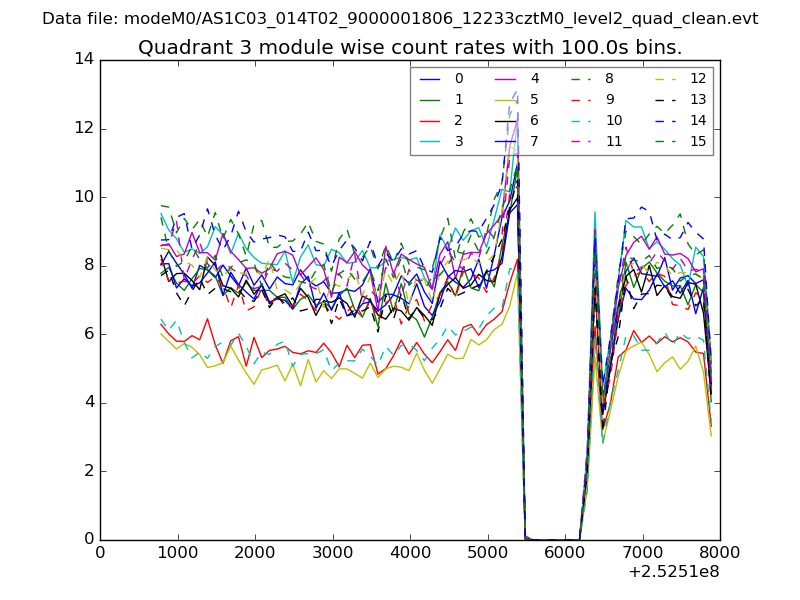
| Module-wise count rates for Quadrant C Data is divided into 100 sec bins |
 |
 |
| Module-wise count rates for Quadrant D Data is divided into 100 sec bins |
 |
 |
| Parameter | Plot |
|---|---|
| CZT HV Monitor |  |
| D_VDD | 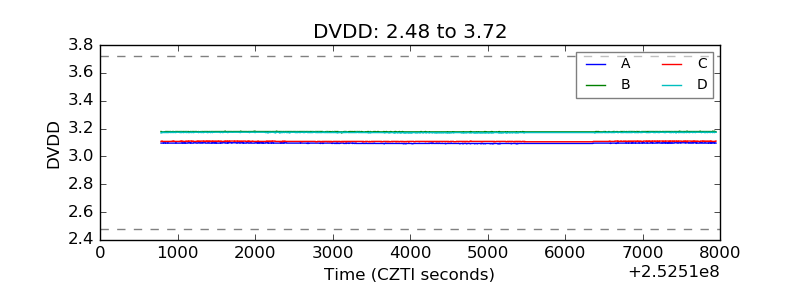 |
| Temperature 1 | 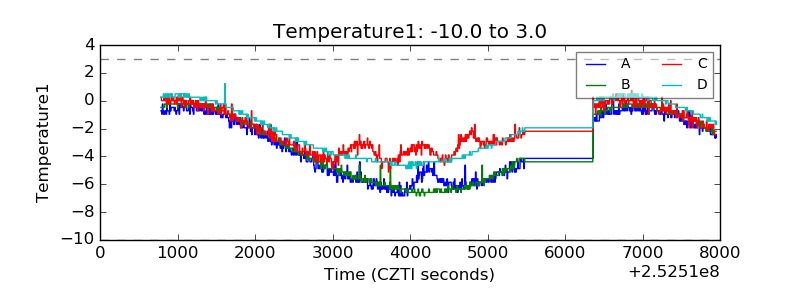 |
| Veto HV Monitor | 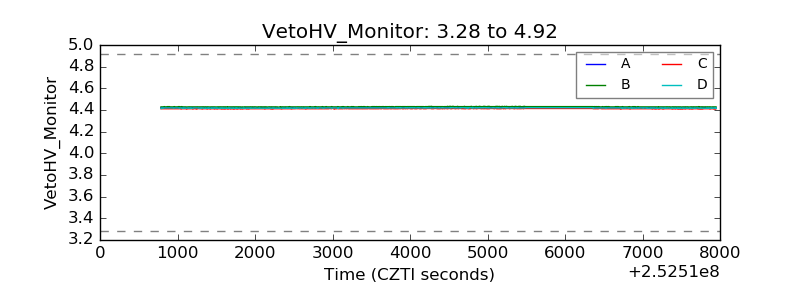 |
| Veto LLD | 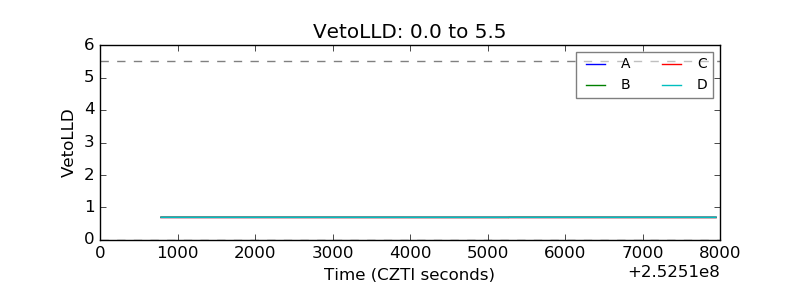 |
| Alpha Counter | 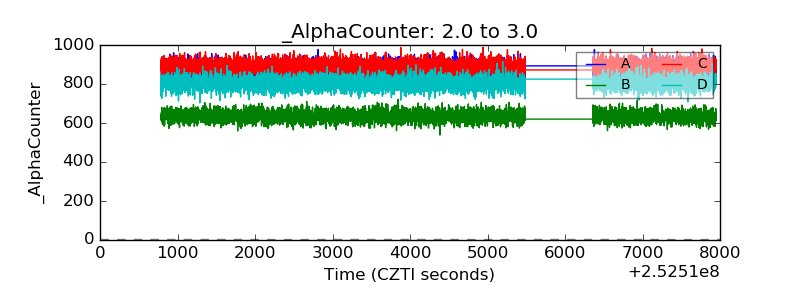 |
| _CPM_Rate | 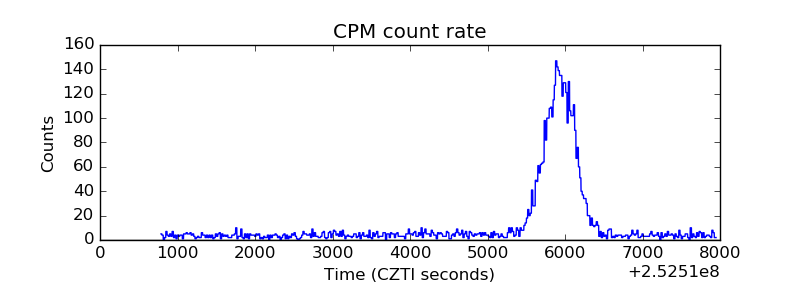 |
| CZT Counter | 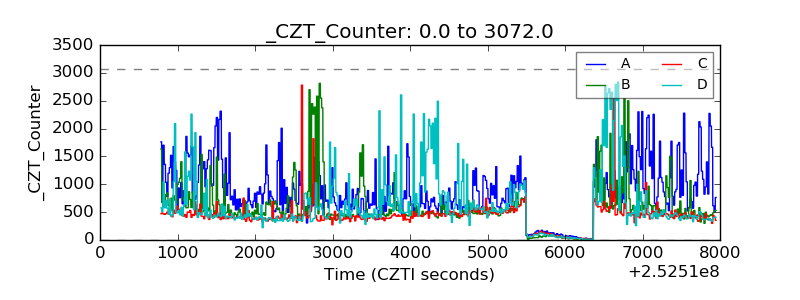 |
| +2.5 Volts monitor |  |
| +5 Volts monitor |  |
| _ROLL_ROT | 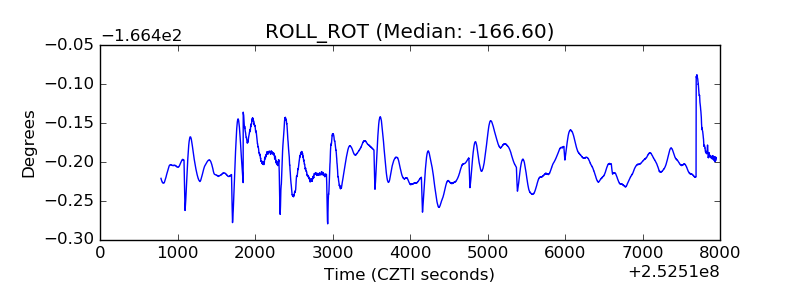 |
| _Roll_DEC | 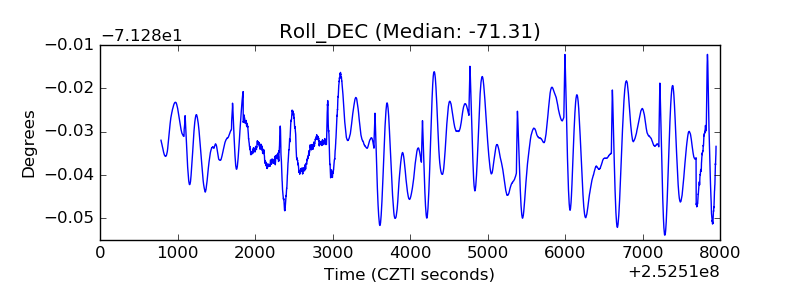 |
| _Roll_RA | 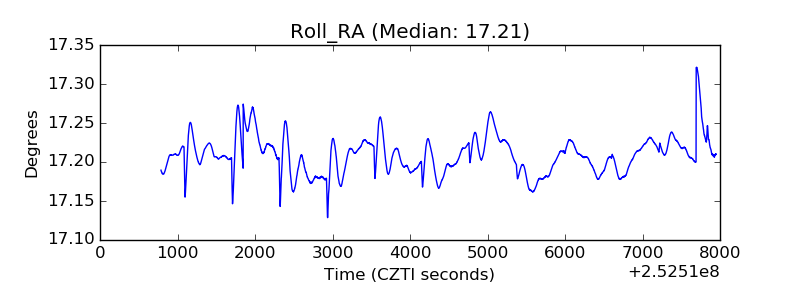 |
| Veto Counter | 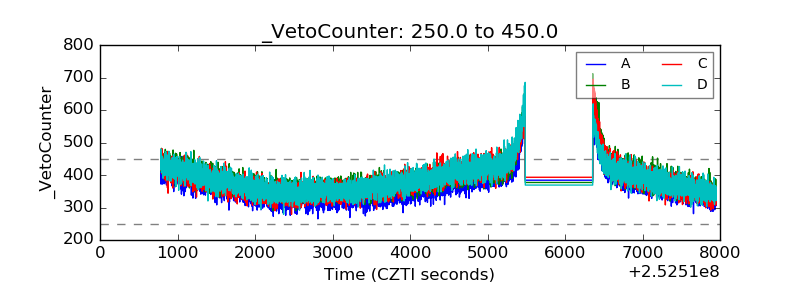 |