| Param | Original file | Final file |
|---|---|---|
| Filename | modeM0/AS1C03_014T02_9000001806_12234cztM0_level2.evt | modeM0/AS1C03_014T02_9000001806_12234cztM0_level2_quad_clean.evt |
| Size (bytes) | 191,963,520 | 34,623,360 |
| Size | 183.1 MB | 33.0 MB |
| Events in quadrant A | 2,378,190 | 222,840 |
| Events in quadrant B | 1,628,044 | 216,085 |
| Events in quadrant C | 831,932 | 235,028 |
| Events in quadrant D | 837,741 | 228,890 |
| Mode M0 | |||
|---|---|---|---|
| Quadrant | BADHDUFLAG | Total packets | Discarded packets |
| A | 0 | 8491 | 0 |
| B | 0 | 6192 | 0 |
| C | 0 | 4088 | 0 |
| D | 0 | 4089 | 0 |
| Mode SS | |||
|---|---|---|---|
| Quadrant | BADHDUFLAG | Total packets | Discarded packets |
| A | 0 | 40 | 0 |
| B | 0 | 40 | 0 |
| C | 0 | 40 | 0 |
| D | 0 | 40 | 0 |
| Quadrant | Total seconds | Saturated seconds | Saturation percentage |
|---|---|---|---|
| A | 1995 | 253 | 12.681704% |
| B | 1995 | 270 | 13.533835% |
| C | 1995 | 4 | 0.200501% |
| D | 1995 | 0 | 0.000000% |
Noise dominated data is calculated using 1-second bins in cleaned event files. If a bin has >2000 counts, and if more than 50% of those come from <1% of pixels, then it is considered to be noise-dominated and hence unusable.
| Quadrant | # 1 sec bins | Bins with >0 counts | Bins with >2000 counts | High rate bins dominated by noise | Noise dominated (total time) | Noise dominated (detector-on time) | Marked lightcurve |
|---|---|---|---|---|---|---|---|
| A | 1996 | 1996 | 200 | 200 | 10.02% | 10.02% | 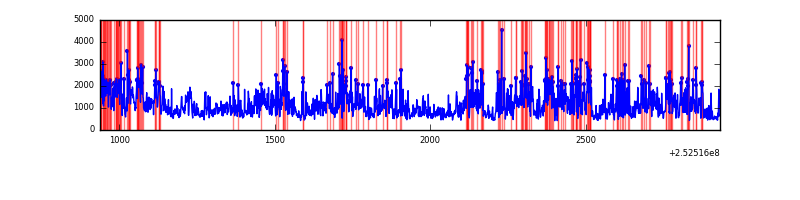 |
| B | 1996 | 1996 | 207 | 207 | 10.37% | 10.37% | 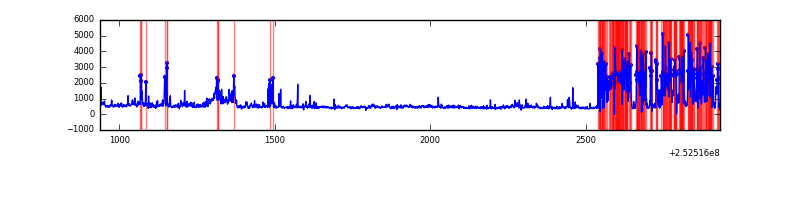 |
| C | 1996 | 1996 | 3 | 3 | 0.15% | 0.15% | 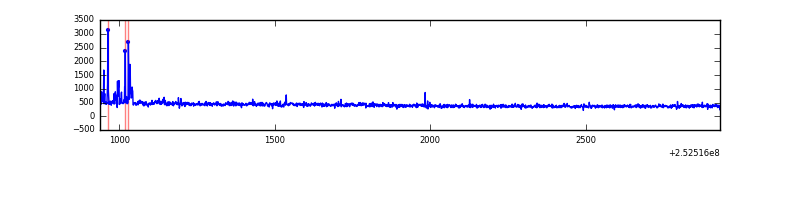 |
| D | 1996 | 1996 | 2 | 2 | 0.10% | 0.10% | 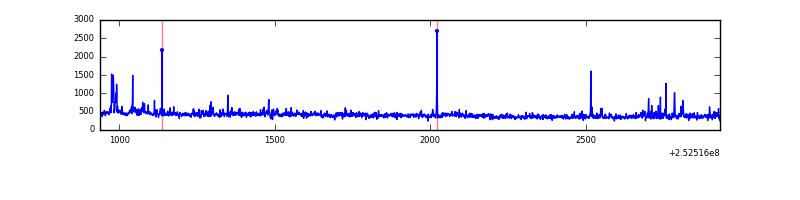 |
Top three noisy pixels from each quadrant. If the there are fewer than three noisy pixels in the level2.evt file, extra rows are filled as -1
| Pixel properties | Quadrant properties | ||||||
|---|---|---|---|---|---|---|---|
| Quadrant | DetID | PixID | Counts | Sigma | Mean | Median | Sigma |
| A | 13 | 251 | 1436398 | 33111.71 | 203 | 198 | 43.4 |
| A | 1 | 162 | 48068 | 1103.65 | 203 | 198 | 43.4 |
| A | 5 | 16 | 35712 | 818.78 | 203 | 198 | 43.4 |
| B | 4 | 239 | 678184 | 17596.13 | 194 | 191 | 38.5 |
| B | 10 | 246 | 64959 | 1680.94 | 194 | 191 | 38.5 |
| B | 11 | 51 | 59090 | 1528.62 | 194 | 191 | 38.5 |
| C | 15 | 208 | 37777 | 802.16 | 197 | 198 | 46.8 |
| C | 4 | 175 | 20463 | 432.57 | 197 | 198 | 46.8 |
| C | 13 | 61 | 1531 | 28.45 | 197 | 198 | 46.8 |
| D | 13 | 104 | 18275 | 356.3 | 198 | 191 | 50.8 |
| D | 10 | 199 | 17017 | 331.51 | 198 | 191 | 50.8 |
| D | 10 | 157 | 14826 | 288.34 | 198 | 191 | 50.8 |
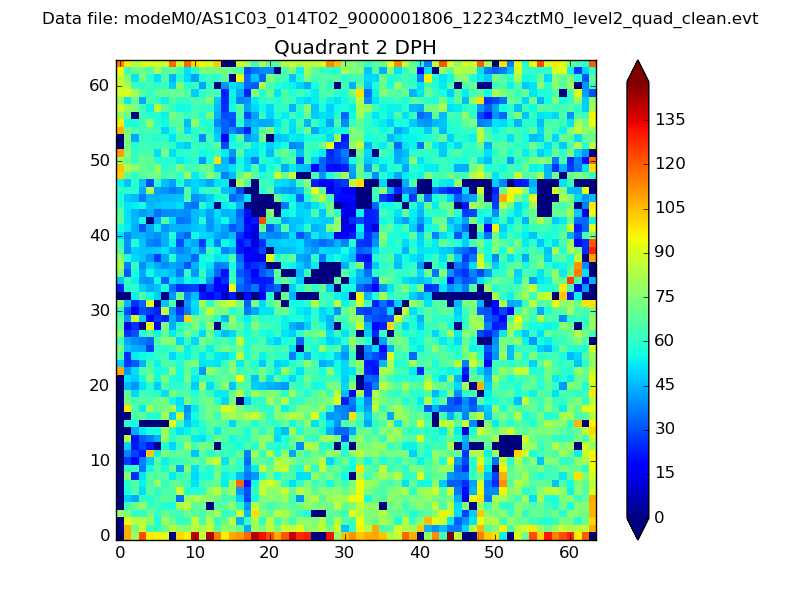
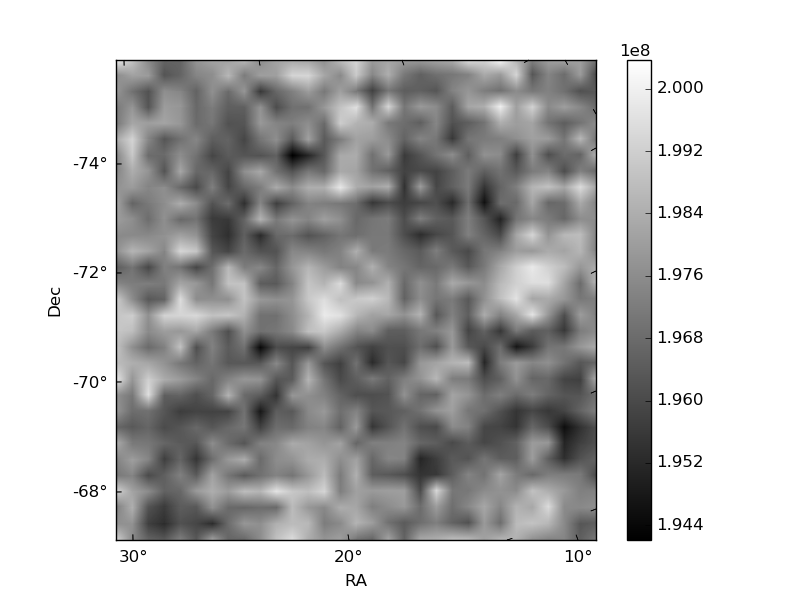
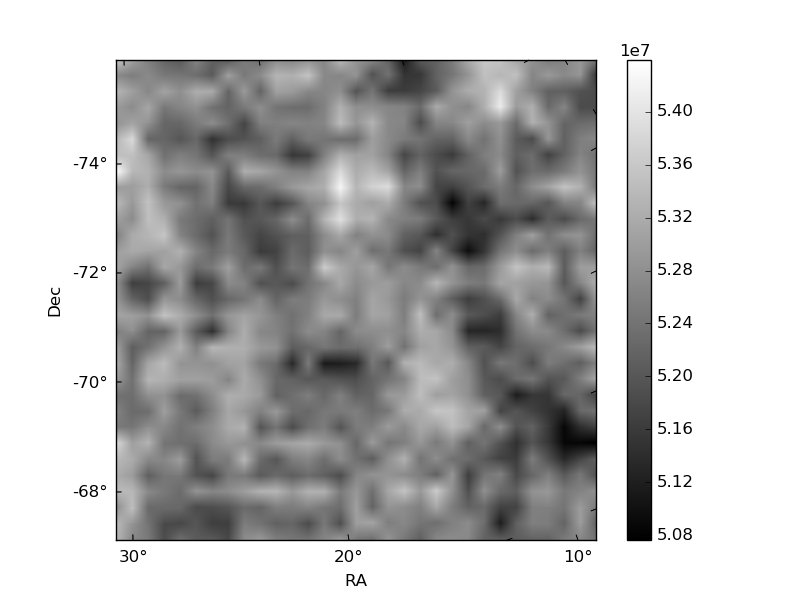
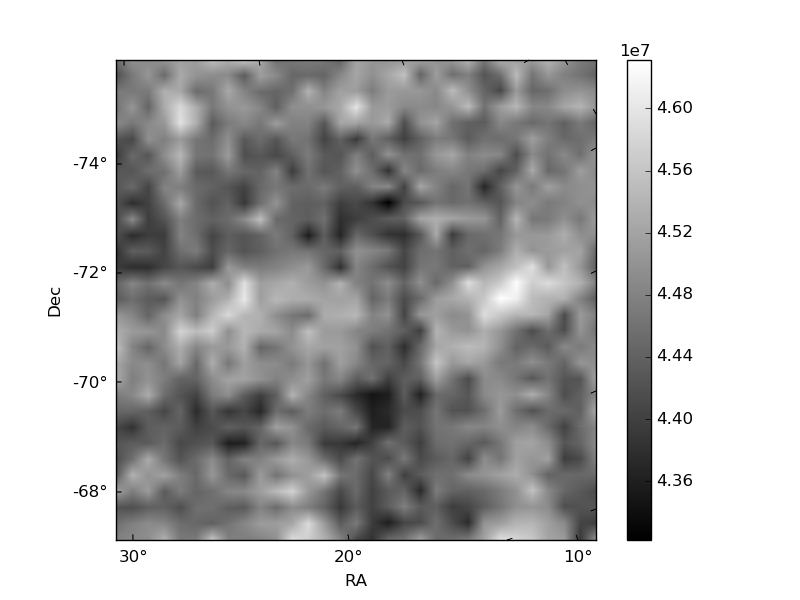
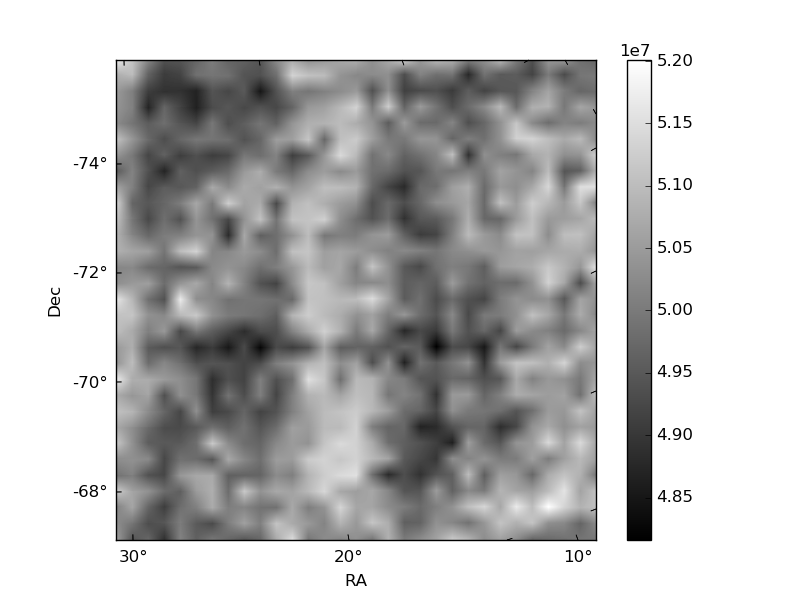
Histogram calculated using DETX and DETY for each event in the final _common_clean file
| Quadrant A | 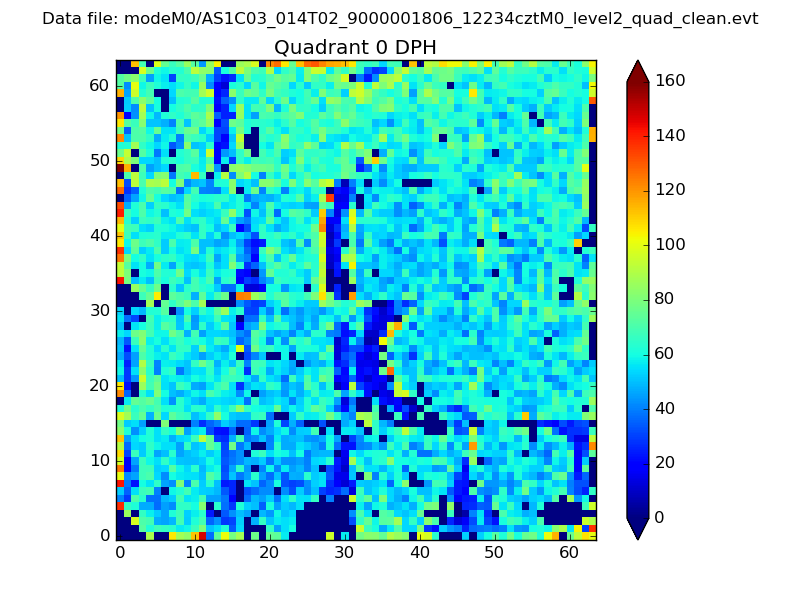 |
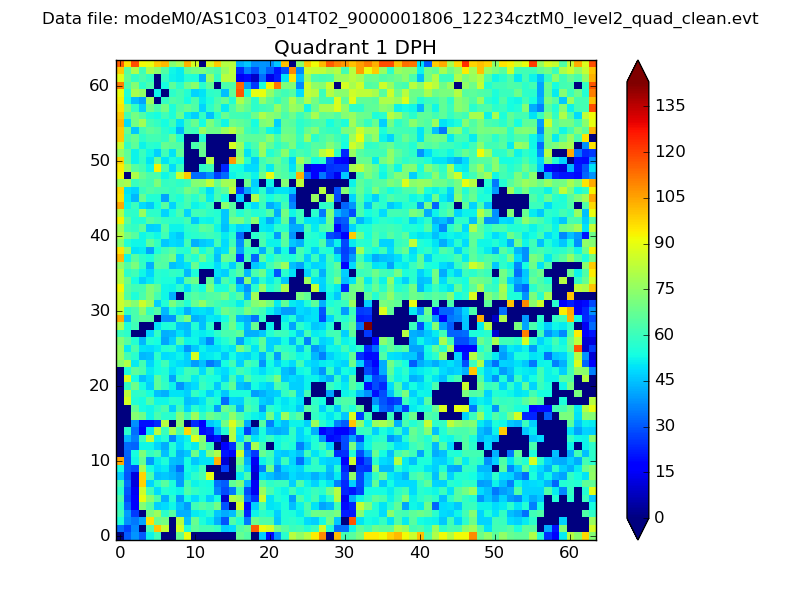 |
Quadrant B |
|---|---|---|---|
| Quadrant D | 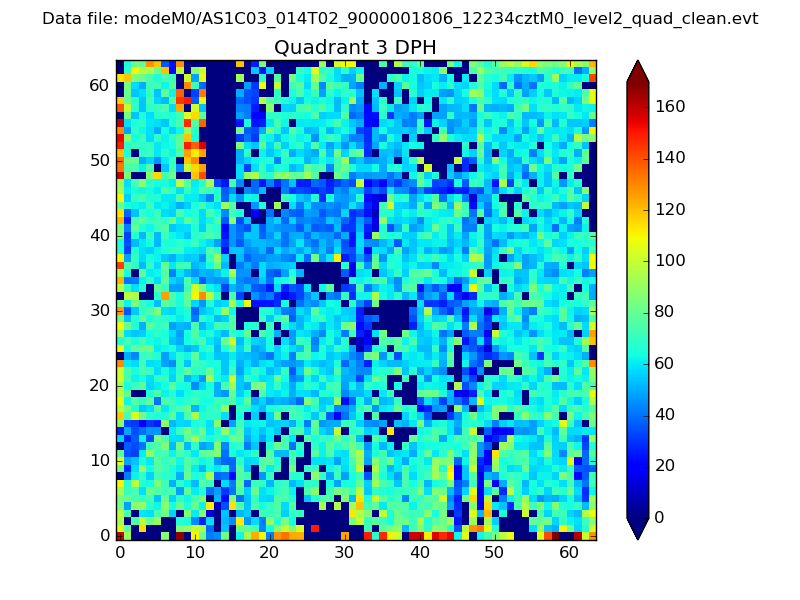 |
 |
Quadrant C |
| Plot type | Count rate plots | Images |
|---|---|---|
| Comparison with Poisson distribution Blue bars denote a histogram of data divided into 1 sec bins. Red curve is a Poisson curve with rate = median count rate of data. |
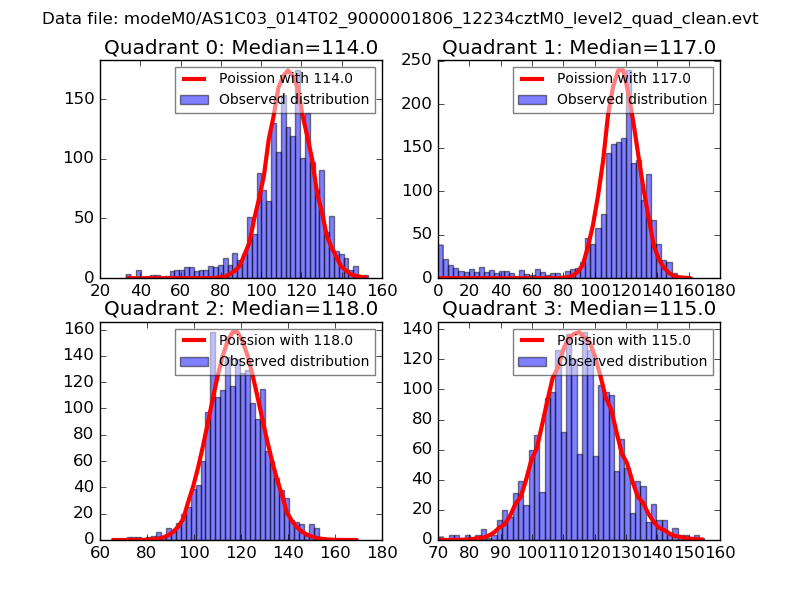 |
 |
| Quadrant-wise count rates Data is divided into 100 sec bins |
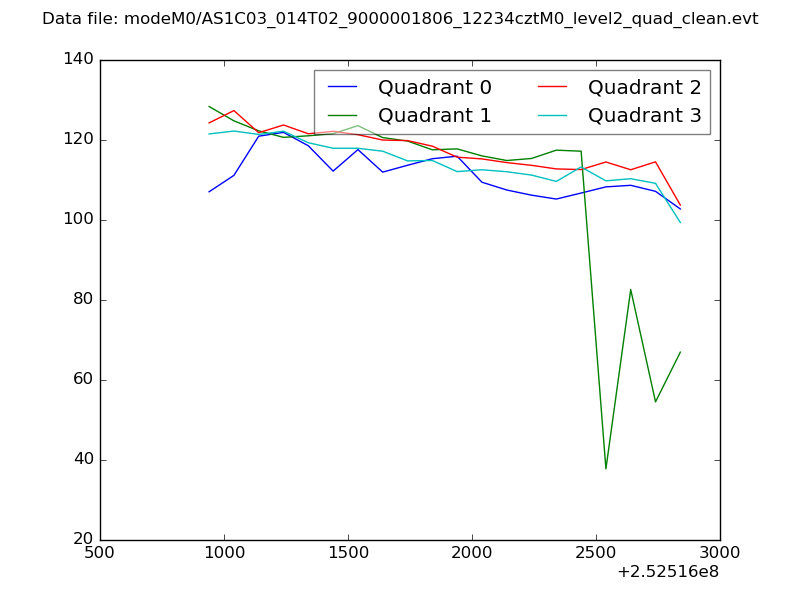 |
|
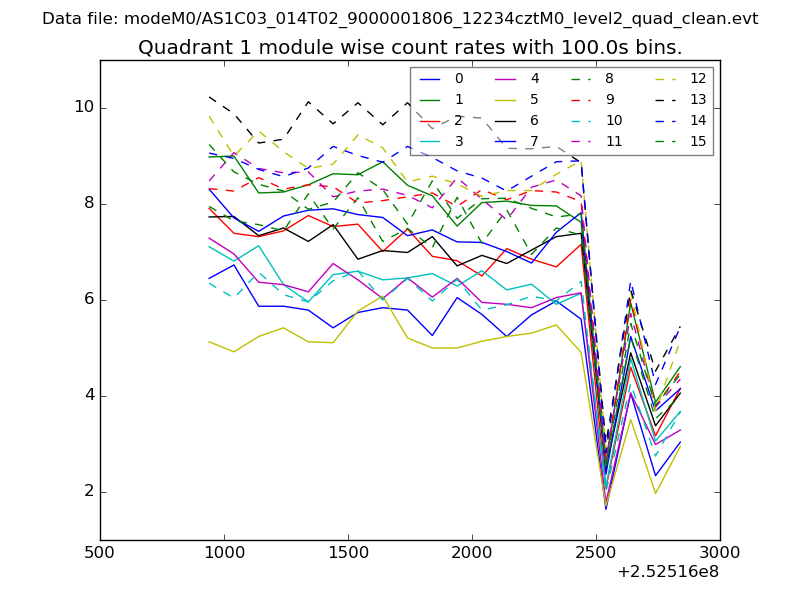
| Module-wise count rates for Quadrant A Data is divided into 100 sec bins |
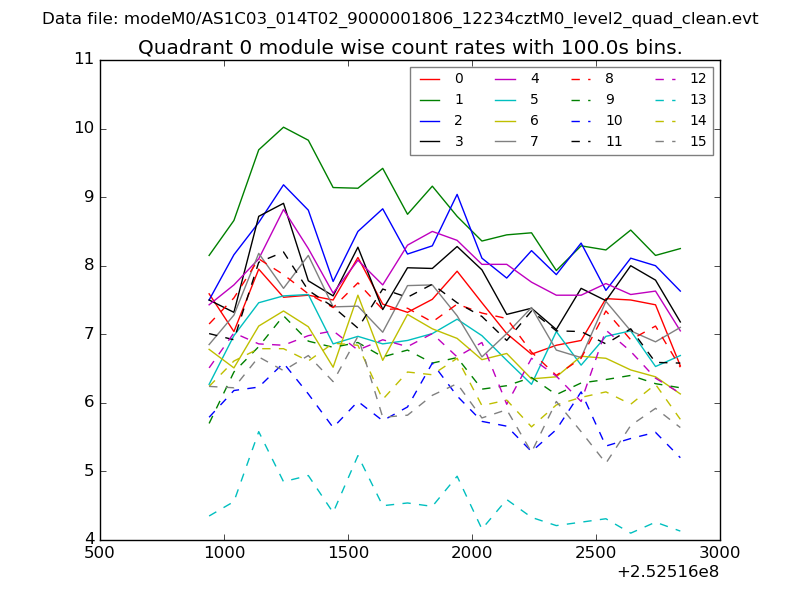 |
 |
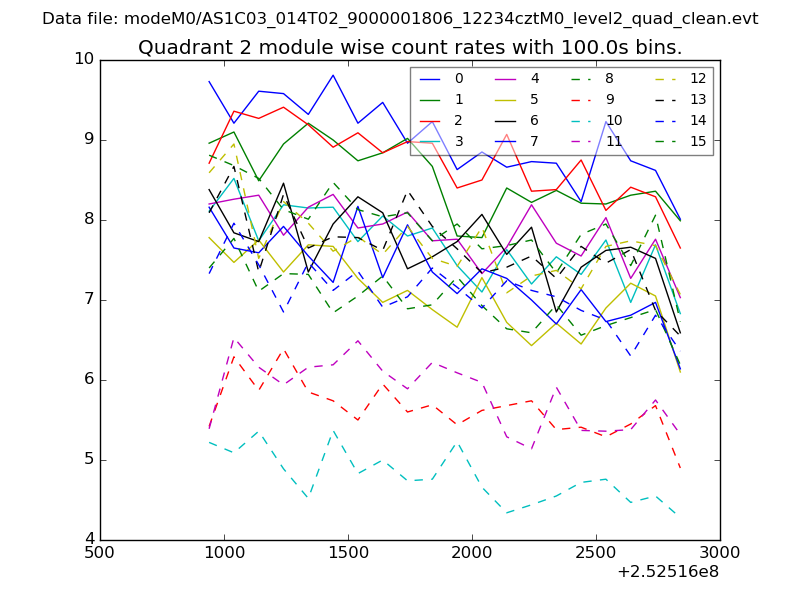
| Module-wise count rates for Quadrant B Data is divided into 100 sec bins |
 |
 |
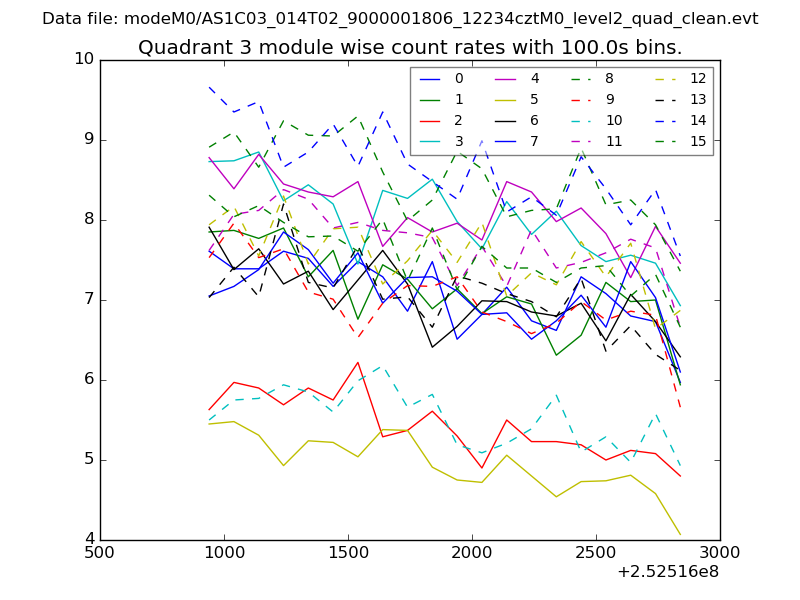
| Module-wise count rates for Quadrant C Data is divided into 100 sec bins |
 |
 |
| Module-wise count rates for Quadrant D Data is divided into 100 sec bins |
 |
 |
| Parameter | Plot |
|---|---|
| CZT HV Monitor |  |
| D_VDD | 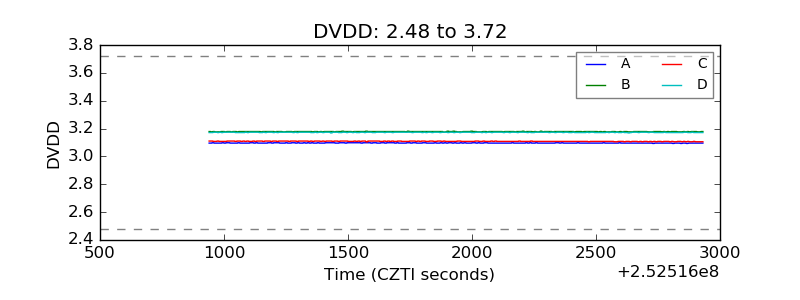 |
| Temperature 1 | 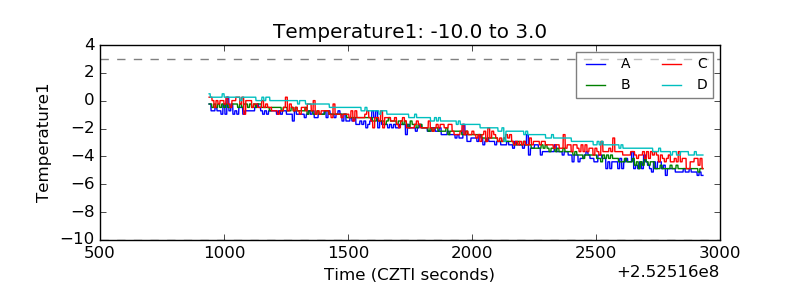 |
| Veto HV Monitor | 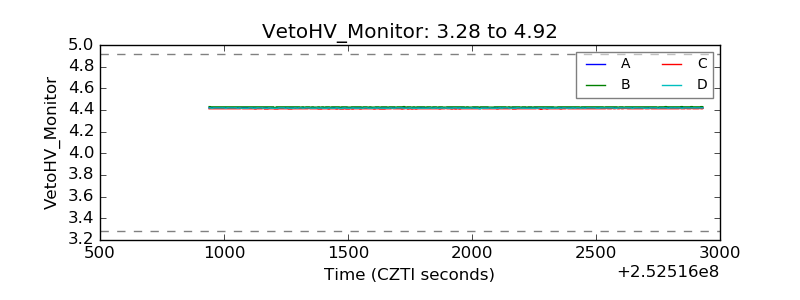 |
| Veto LLD | 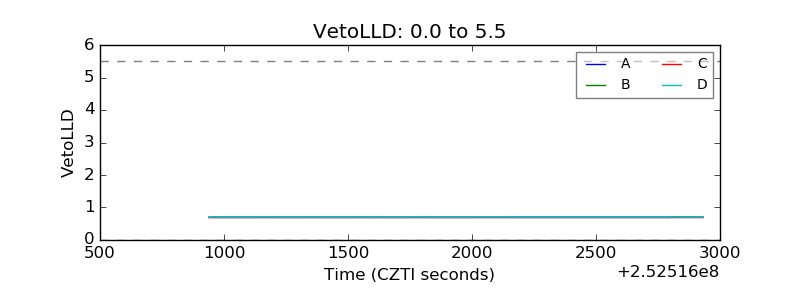 |
| Alpha Counter | 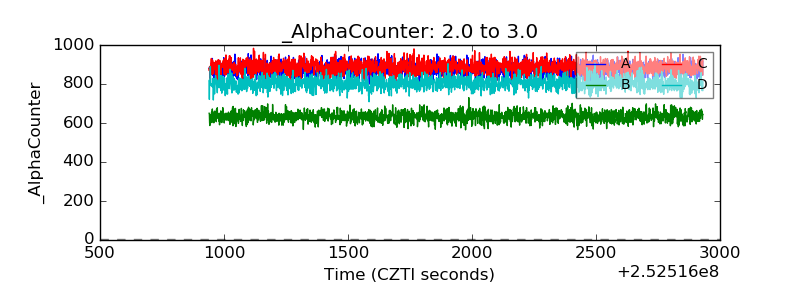 |
| _CPM_Rate | 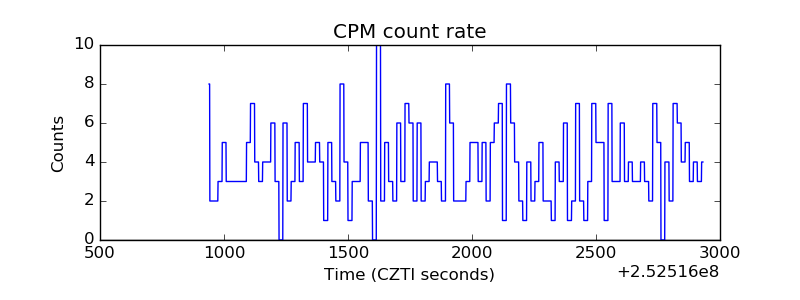 |
| CZT Counter | 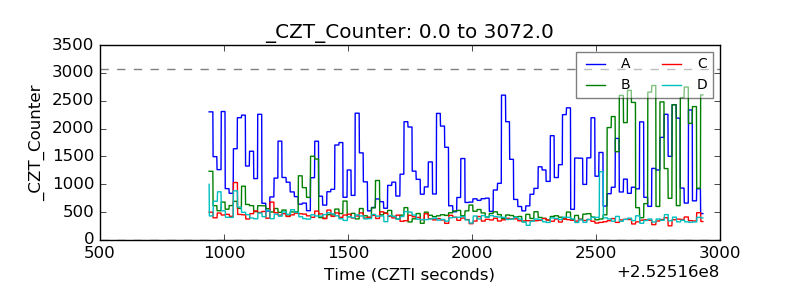 |
| +2.5 Volts monitor |  |
| +5 Volts monitor |  |
| _ROLL_ROT | 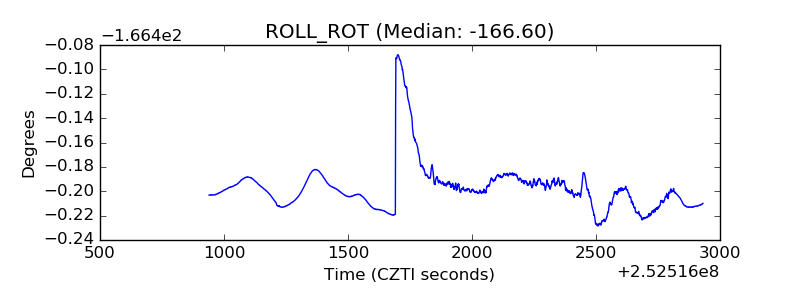 |
| _Roll_DEC | 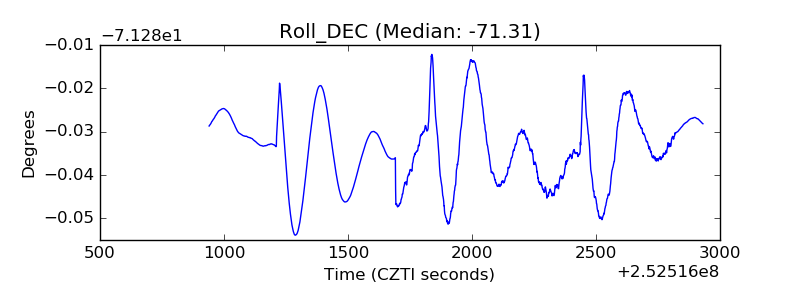 |
| _Roll_RA | 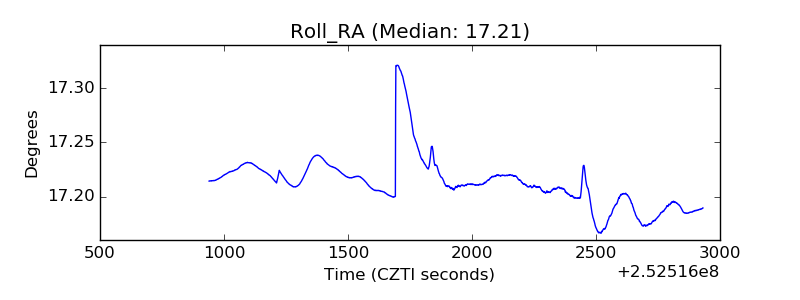 |
| Veto Counter | 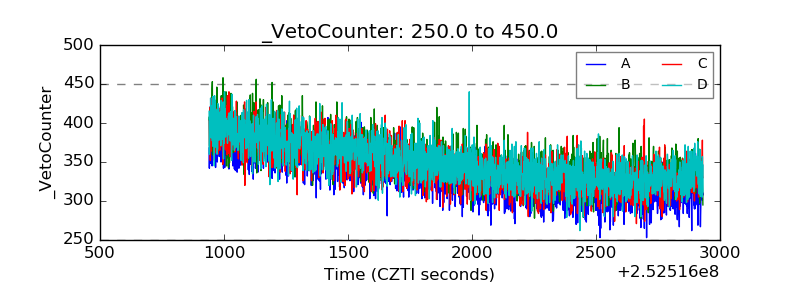 |