| Param | Original file | Final file |
|---|---|---|
| Filename | modeM0/AS1C03_014T03_9000001808_12234cztM0_level2.evt | modeM0/AS1C03_014T03_9000001808_12234cztM0_level2_quad_clean.evt |
| Size (bytes) | 365,158,080 | 81,460,800 |
| Size | 348.2 MB | 77.7 MB |
| Events in quadrant A | 3,746,921 | 536,391 |
| Events in quadrant B | 2,557,307 | 549,139 |
| Events in quadrant C | 2,059,706 | 546,645 |
| Events in quadrant D | 2,395,723 | 525,317 |
| Mode M0 | |||
|---|---|---|---|
| Quadrant | BADHDUFLAG | Total packets | Discarded packets |
| A | 0 | 14241 | 2 |
| B | 0 | 10429 | 1 |
| C | 0 | 9074 | 1 |
| D | 0 | 10147 | 1 |
| Mode M9 | |||
|---|---|---|---|
| Quadrant | BADHDUFLAG | Total packets | Discarded packets |
| A | 0 | 4 | 0 |
| B | 0 | 4 | 0 |
| C | 0 | 4 | 0 |
| D | 0 | 4 | 0 |
| Mode SS | |||
|---|---|---|---|
| Quadrant | BADHDUFLAG | Total packets | Discarded packets |
| A | 0 | 90 | 0 |
| B | 0 | 90 | 0 |
| C | 0 | 90 | 0 |
| D | 0 | 90 | 0 |
| Quadrant | Total seconds | Saturated seconds | Saturation percentage |
|---|---|---|---|
| A | 4395 | 312 | 7.098976% |
| B | 4395 | 224 | 5.096701% |
| C | 4395 | 13 | 0.295791% |
| D | 4395 | 82 | 1.865757% |
Noise dominated data is calculated using 1-second bins in cleaned event files. If a bin has >2000 counts, and if more than 50% of those come from <1% of pixels, then it is considered to be noise-dominated and hence unusable.
| Quadrant | # 1 sec bins | Bins with >0 counts | Bins with >2000 counts | High rate bins dominated by noise | Noise dominated (total time) | Noise dominated (detector-on time) | Marked lightcurve |
|---|---|---|---|---|---|---|---|
| A | 4811 | 4397 | 76 | 76 | 1.58% | 1.73% | 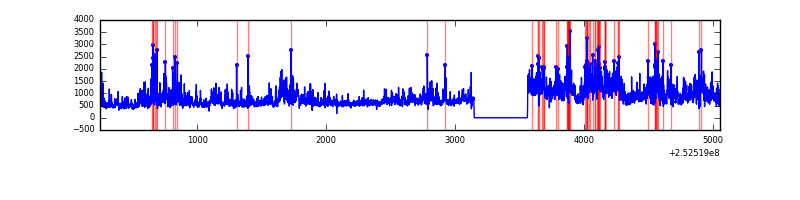 |
| B | 4811 | 4396 | 70 | 70 | 1.45% | 1.59% | 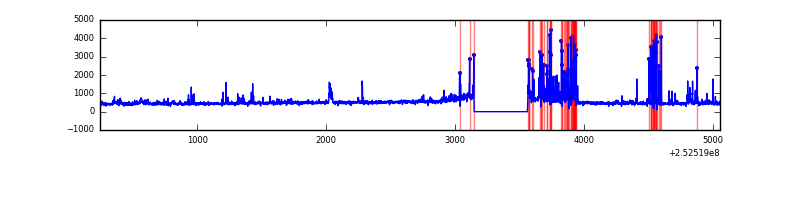 |
| C | 4811 | 4397 | 1 | 1 | 0.02% | 0.02% | 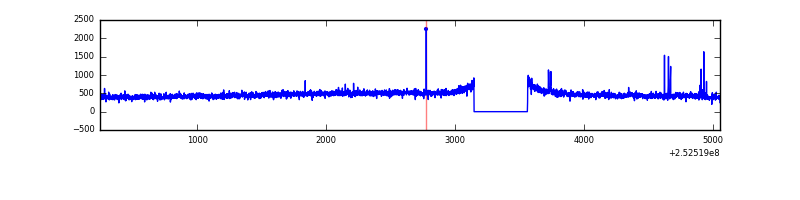 |
| D | 4811 | 4397 | 57 | 57 | 1.18% | 1.30% | 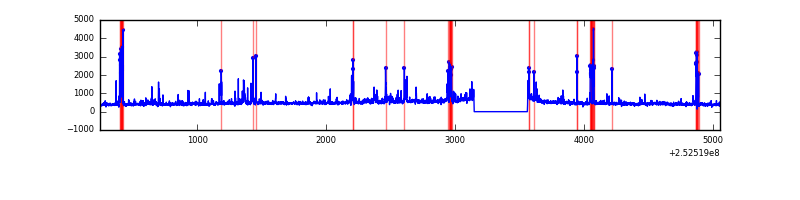 |
Top three noisy pixels from each quadrant. If the there are fewer than three noisy pixels in the level2.evt file, extra rows are filled as -1
| Pixel properties | Quadrant properties | ||||||
|---|---|---|---|---|---|---|---|
| Quadrant | DetID | PixID | Counts | Sigma | Mean | Median | Sigma |
| A | 13 | 251 | 1298866 | 11954.25 | 519 | 507 | 108.6 |
| A | 1 | 162 | 98541 | 902.62 | 519 | 507 | 108.6 |
| A | 15 | 174 | 77949 | 713.02 | 519 | 507 | 108.6 |
| B | 4 | 239 | 328978 | 3319.59 | 520 | 506 | 98.9 |
| B | 10 | 246 | 80889 | 812.36 | 520 | 506 | 98.9 |
| B | 11 | 51 | 26399 | 261.67 | 520 | 506 | 98.9 |
| C | 4 | 175 | 25144 | 207.21 | 512 | 513 | 118.9 |
| C | 15 | 208 | 20259 | 166.12 | 512 | 513 | 118.9 |
| C | 0 | 207 | 9008 | 71.47 | 512 | 513 | 118.9 |
| D | 1 | 52 | 212983 | 1704.84 | 510 | 493 | 124.6 |
| D | 13 | 249 | 65372 | 520.53 | 510 | 493 | 124.6 |
| D | 2 | 33 | 41207 | 326.66 | 510 | 493 | 124.6 |
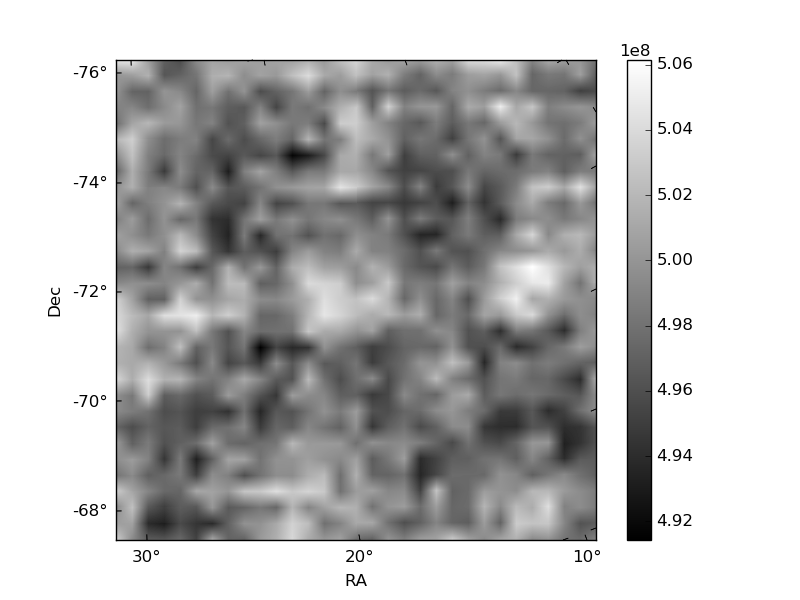
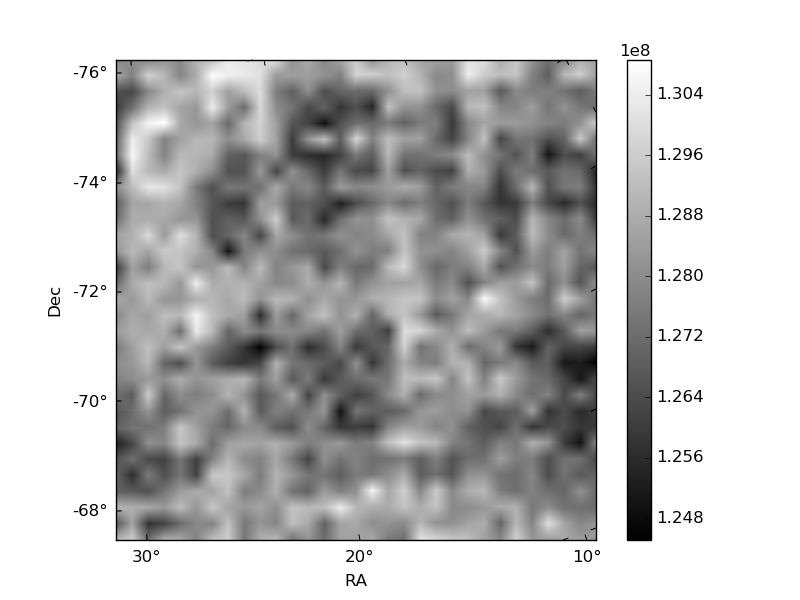
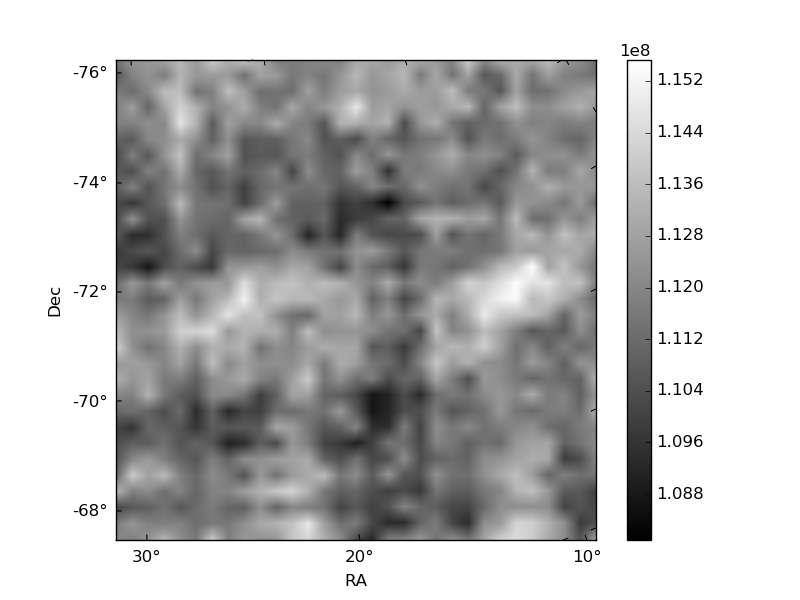
Histogram calculated using DETX and DETY for each event in the final _common_clean file
| Quadrant A | 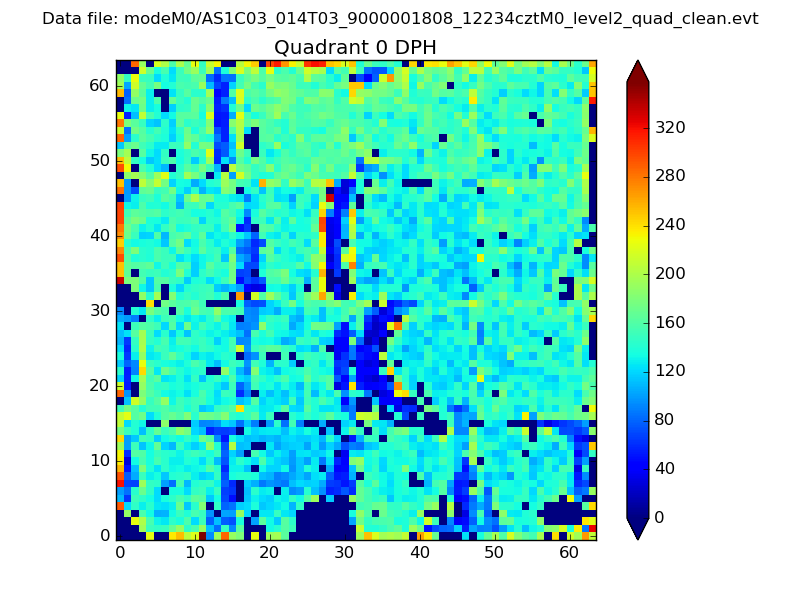 |
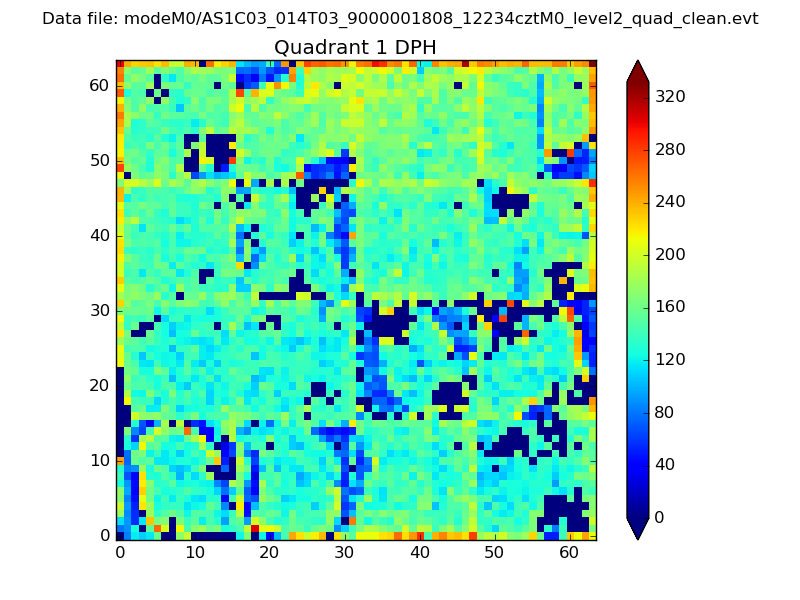 |
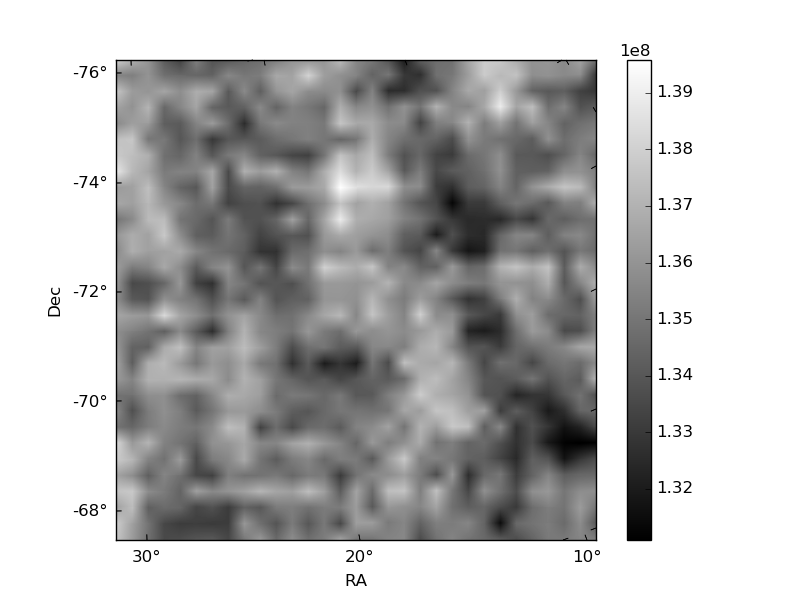
Quadrant B |
|---|---|---|---|
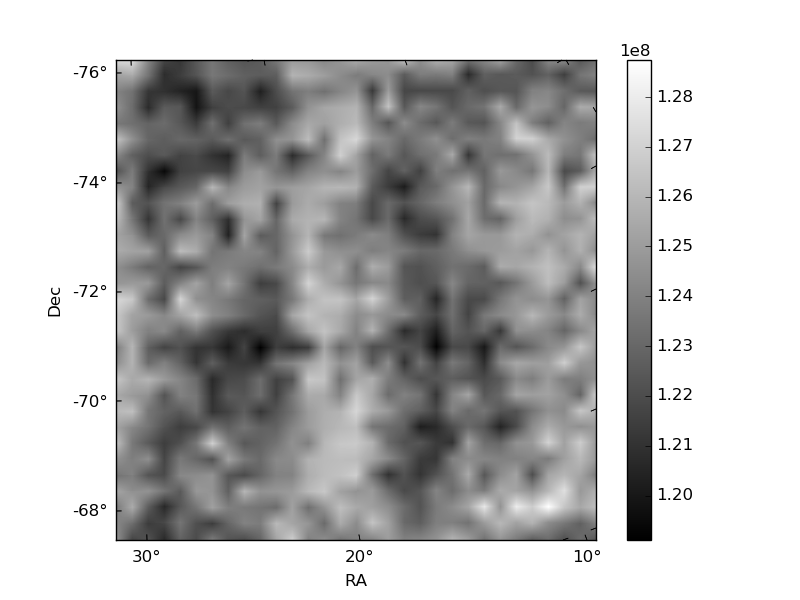
| Quadrant D | 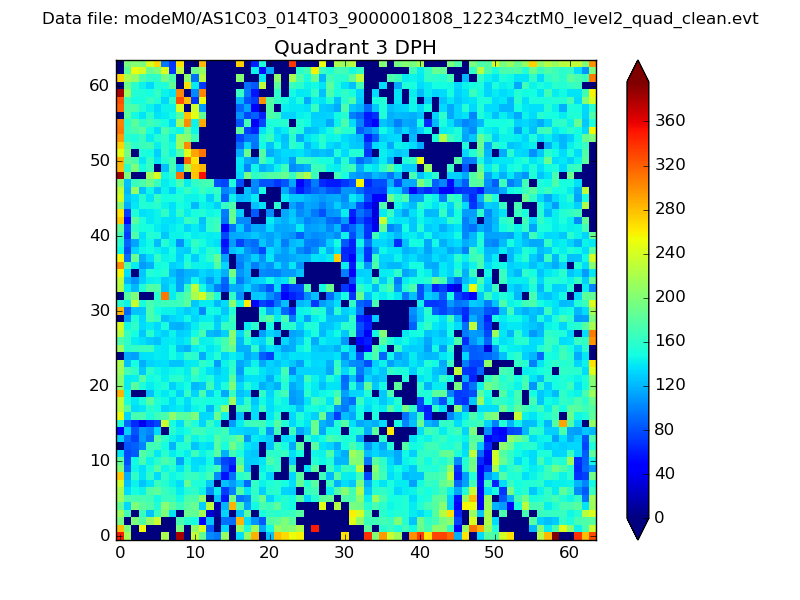 |
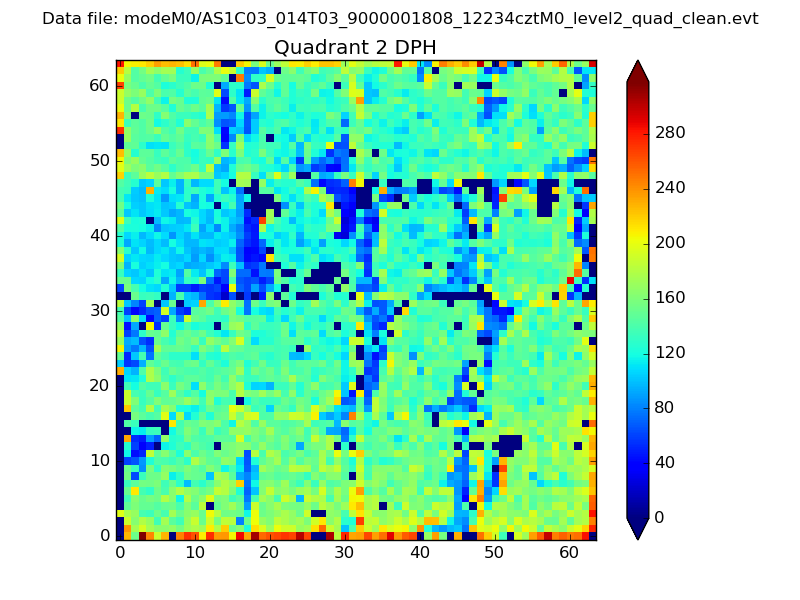 |
Quadrant C |
| Plot type | Count rate plots | Images |
|---|---|---|
| Comparison with Poisson distribution Blue bars denote a histogram of data divided into 1 sec bins. Red curve is a Poisson curve with rate = median count rate of data. |
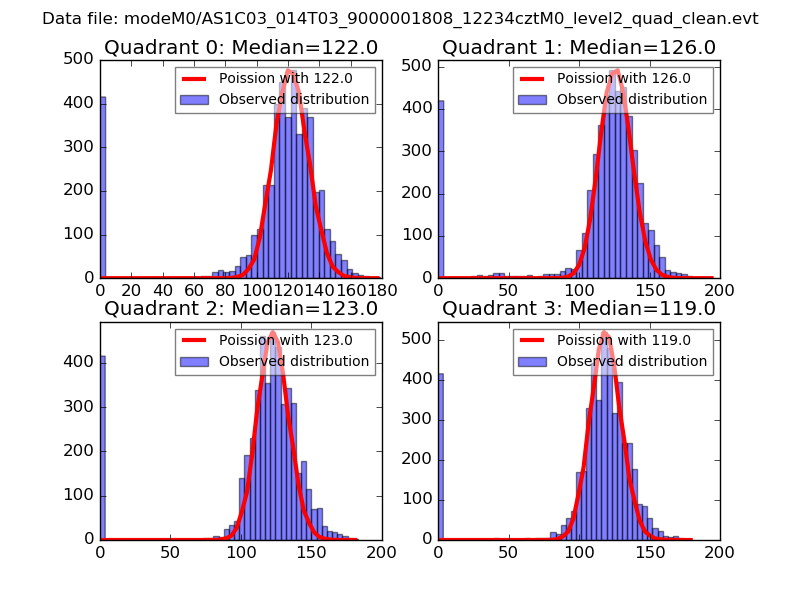 |
 |
| Quadrant-wise count rates Data is divided into 100 sec bins |
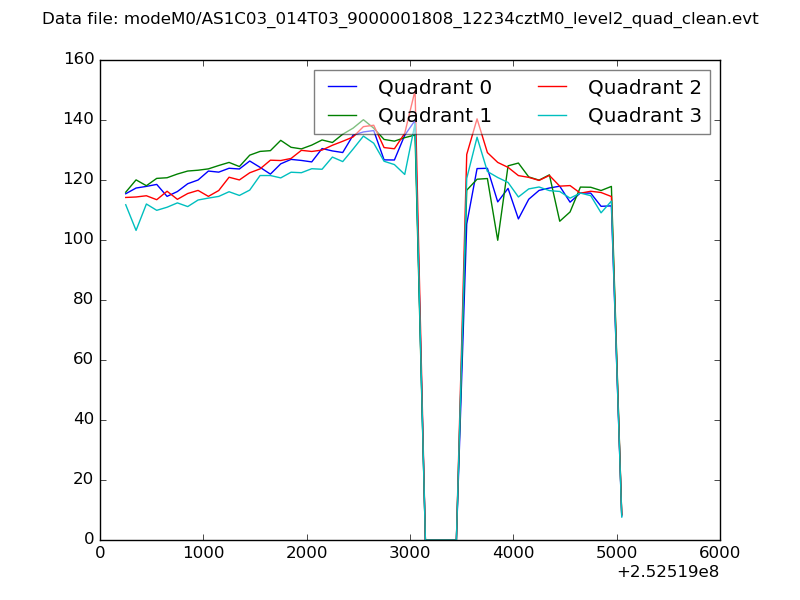 |
|
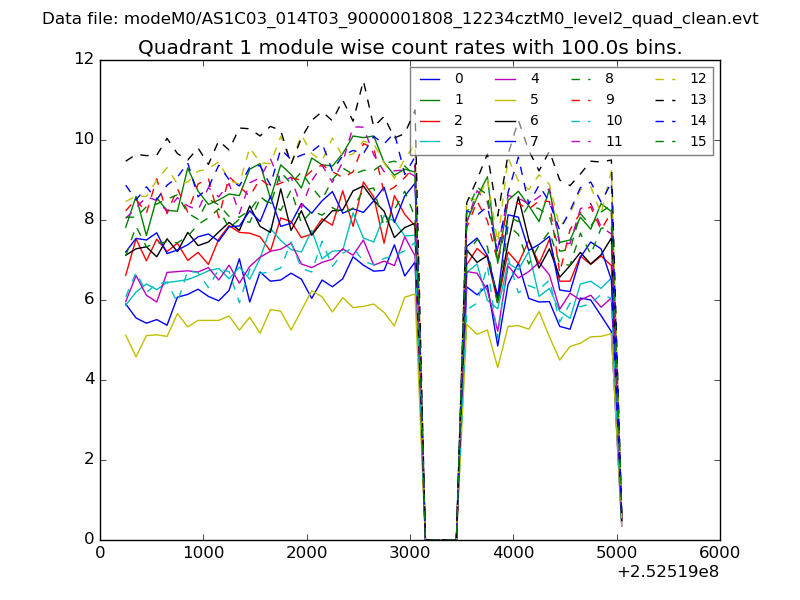
| Module-wise count rates for Quadrant A Data is divided into 100 sec bins |
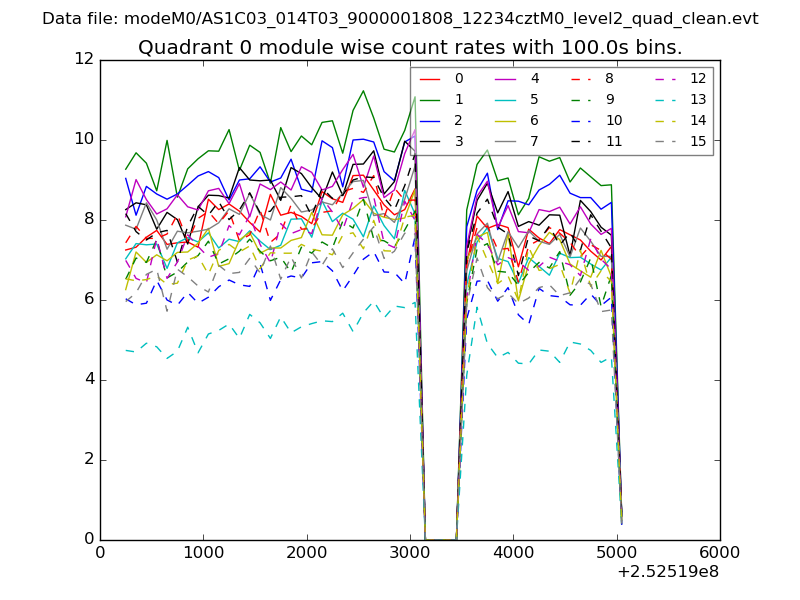 |
 |
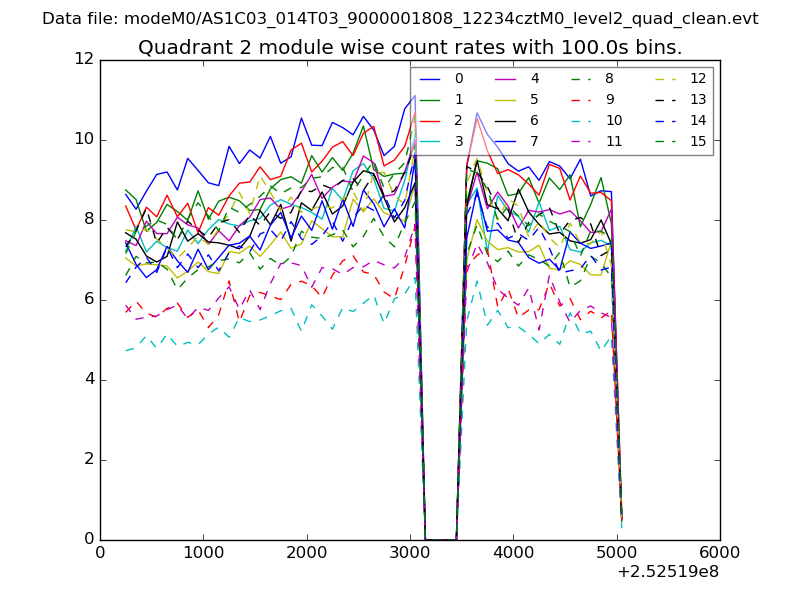
| Module-wise count rates for Quadrant B Data is divided into 100 sec bins |
 |
 |
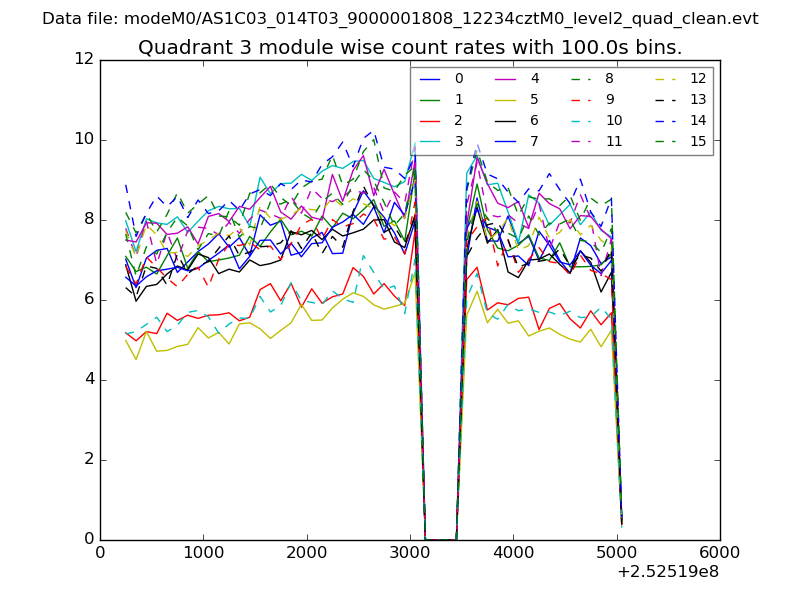
| Module-wise count rates for Quadrant C Data is divided into 100 sec bins |
 |
 |
| Module-wise count rates for Quadrant D Data is divided into 100 sec bins |
 |
 |
| Parameter | Plot |
|---|---|
| CZT HV Monitor | 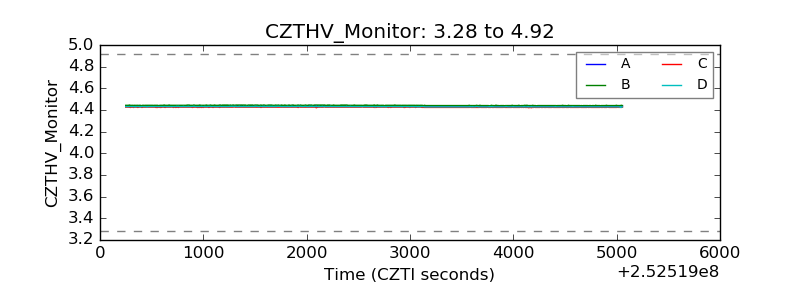 |
| D_VDD | 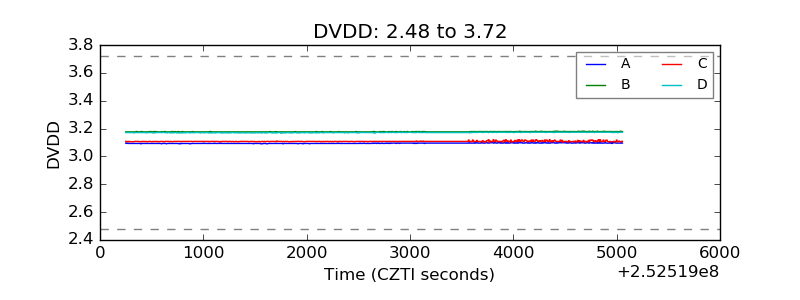 |
| Temperature 1 | 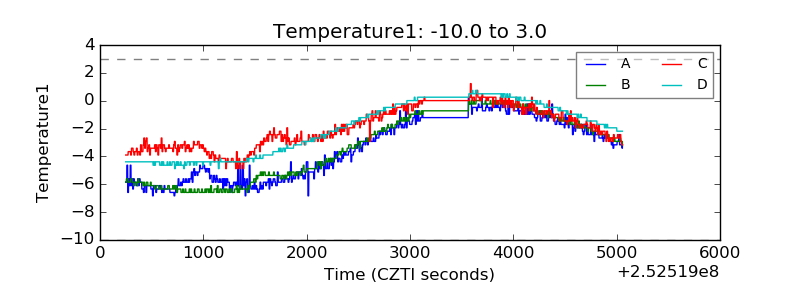 |
| Veto HV Monitor |  |
| Veto LLD | 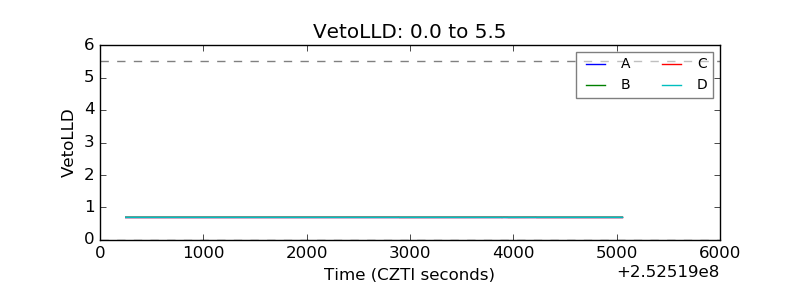 |
| Alpha Counter | 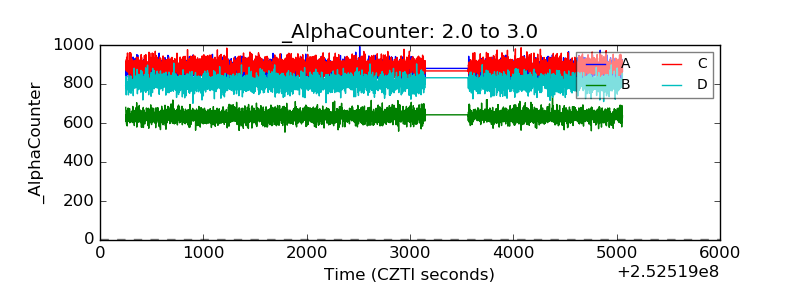 |
| _CPM_Rate | 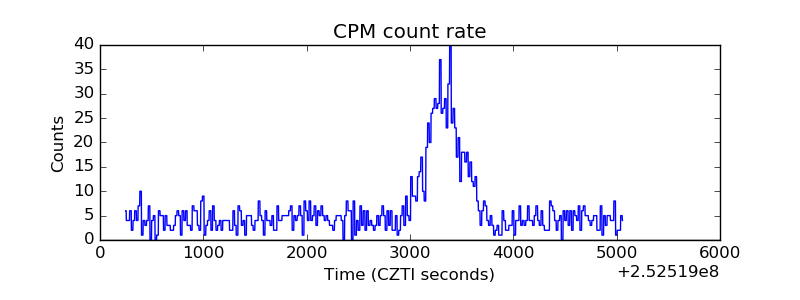 |
| CZT Counter | 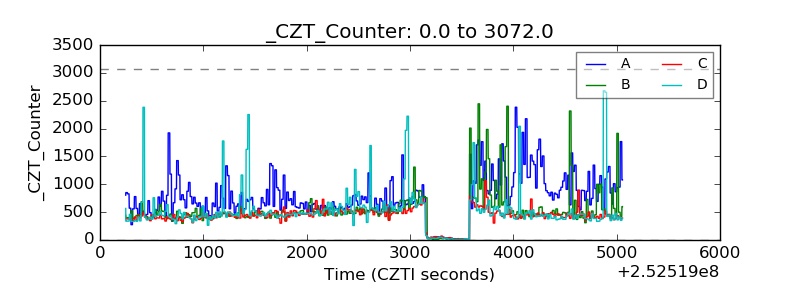 |
| +2.5 Volts monitor | 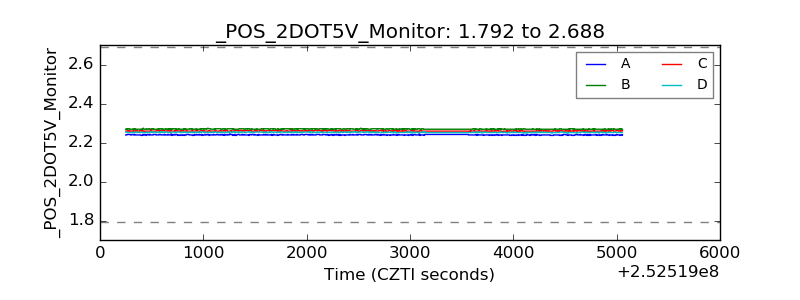 |
| +5 Volts monitor | 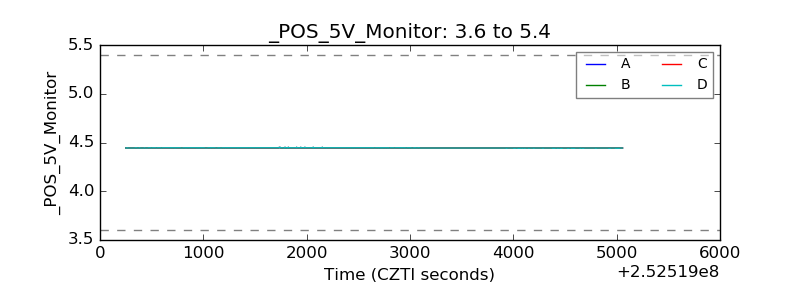 |
| _ROLL_ROT | 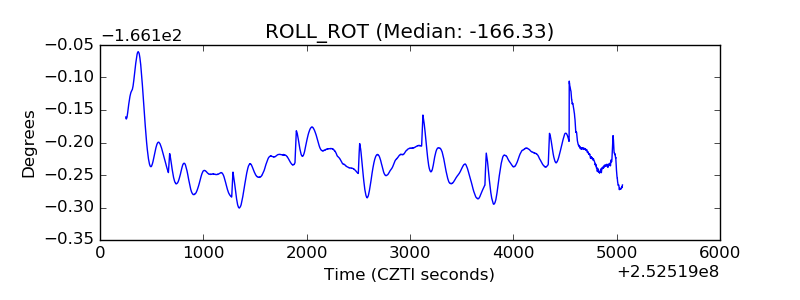 |
| _Roll_DEC | 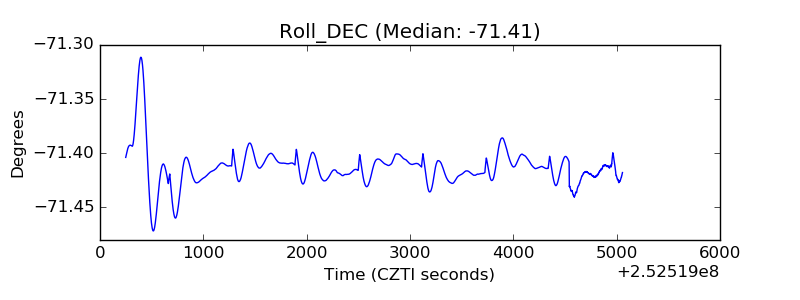 |
| _Roll_RA | 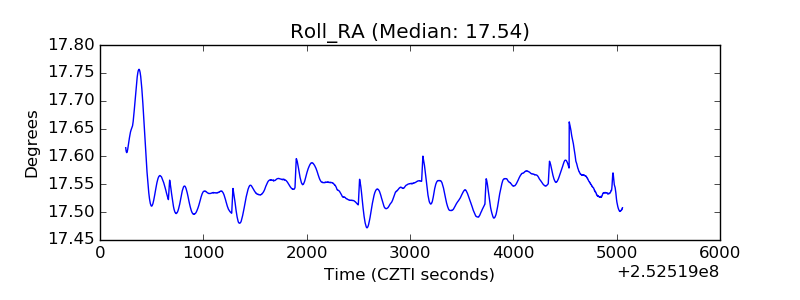 |
| Veto Counter | 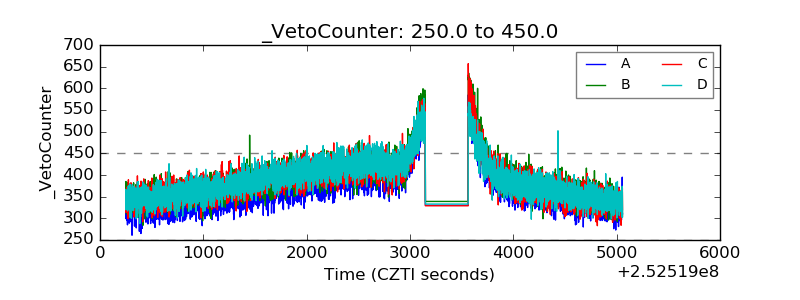 |