| Param | Original file | Final file |
|---|---|---|
| Filename | modeM0/AS1C03_014T03_9000001808_12235cztM0_level2.evt | modeM0/AS1C03_014T03_9000001808_12235cztM0_level2_quad_clean.evt |
| Size (bytes) | 617,857,920 | 129,836,160 |
| Size | 589.2 MB | 123.8 MB |
| Events in quadrant A | 6,146,137 | 857,738 |
| Events in quadrant B | 4,792,341 | 849,449 |
| Events in quadrant C | 3,544,409 | 873,002 |
| Events in quadrant D | 3,733,591 | 842,902 |
| Mode M0 | |||
|---|---|---|---|
| Quadrant | BADHDUFLAG | Total packets | Discarded packets |
| A | 0 | 23261 | 2 |
| B | 0 | 19149 | 1 |
| C | 0 | 15864 | 1 |
| D | 0 | 16442 | 1 |
| Mode M9 | |||
|---|---|---|---|
| Quadrant | BADHDUFLAG | Total packets | Discarded packets |
| A | 0 | 2 | 0 |
| B | 0 | 2 | 0 |
| C | 0 | 2 | 0 |
| D | 0 | 2 | 0 |
| Mode SS | |||
|---|---|---|---|
| Quadrant | BADHDUFLAG | Total packets | Discarded packets |
| A | 0 | 148 | 0 |
| B | 0 | 148 | 0 |
| C | 0 | 148 | 0 |
| D | 0 | 148 | 0 |
| Quadrant | Total seconds | Saturated seconds | Saturation percentage |
|---|---|---|---|
| A | 7310 | 586 | 8.016416% |
| B | 7310 | 623 | 8.522572% |
| C | 7310 | 66 | 0.902873% |
| D | 7310 | 111 | 1.518468% |
Noise dominated data is calculated using 1-second bins in cleaned event files. If a bin has >2000 counts, and if more than 50% of those come from <1% of pixels, then it is considered to be noise-dominated and hence unusable.
| Quadrant | # 1 sec bins | Bins with >0 counts | Bins with >2000 counts | High rate bins dominated by noise | Noise dominated (total time) | Noise dominated (detector-on time) | Marked lightcurve |
|---|---|---|---|---|---|---|---|
| A | 7481 | 7312 | 216 | 216 | 2.89% | 2.95% | 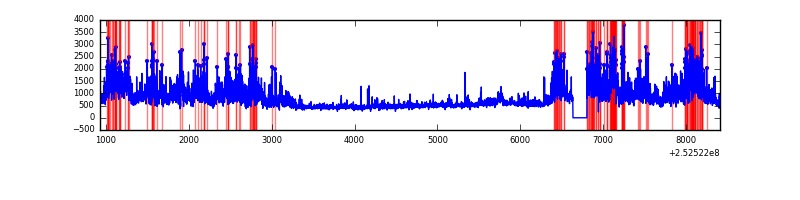 |
| B | 7480 | 7311 | 357 | 357 | 4.77% | 4.88% | 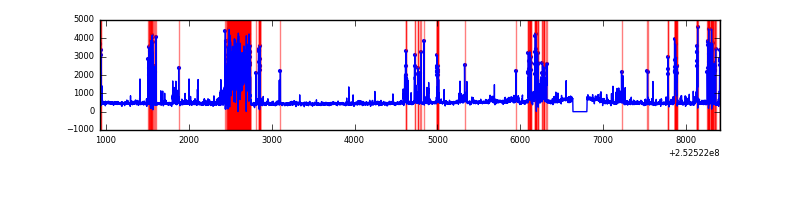 |
| C | 7481 | 7312 | 25 | 25 | 0.33% | 0.34% | 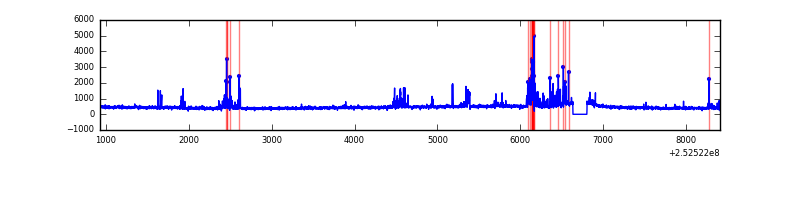 |
| D | 7481 | 7312 | 82 | 82 | 1.10% | 1.12% | 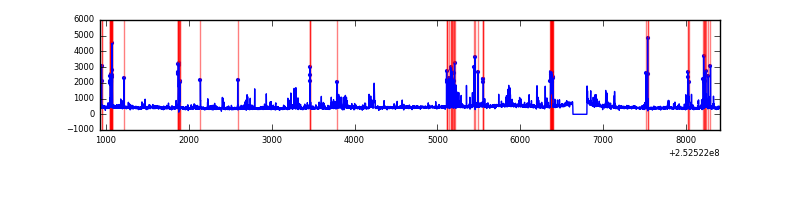 |
Top three noisy pixels from each quadrant. If the there are fewer than three noisy pixels in the level2.evt file, extra rows are filled as -1
| Pixel properties | Quadrant properties | ||||||
|---|---|---|---|---|---|---|---|
| Quadrant | DetID | PixID | Counts | Sigma | Mean | Median | Sigma |
| A | 13 | 251 | 2522803 | 15175.75 | 817 | 799 | 166.2 |
| A | 1 | 162 | 126968 | 759.2 | 817 | 799 | 166.2 |
| A | 8 | 15 | 70621 | 420.14 | 817 | 799 | 166.2 |
| B | 4 | 239 | 1166846 | 7667.15 | 804 | 786 | 152.1 |
| B | 3 | 64 | 200500 | 1313.17 | 804 | 786 | 152.1 |
| B | 10 | 246 | 59713 | 387.46 | 804 | 786 | 152.1 |
| C | 15 | 208 | 353658 | 1905.97 | 801 | 804 | 185.1 |
| C | 4 | 175 | 41646 | 220.61 | 801 | 804 | 185.1 |
| C | 0 | 207 | 10386 | 51.76 | 801 | 804 | 185.1 |
| D | 13 | 104 | 112491 | 579.05 | 799 | 774 | 192.9 |
| D | 10 | 199 | 108709 | 559.45 | 799 | 774 | 192.9 |
| D | 13 | 249 | 89362 | 459.17 | 799 | 774 | 192.9 |
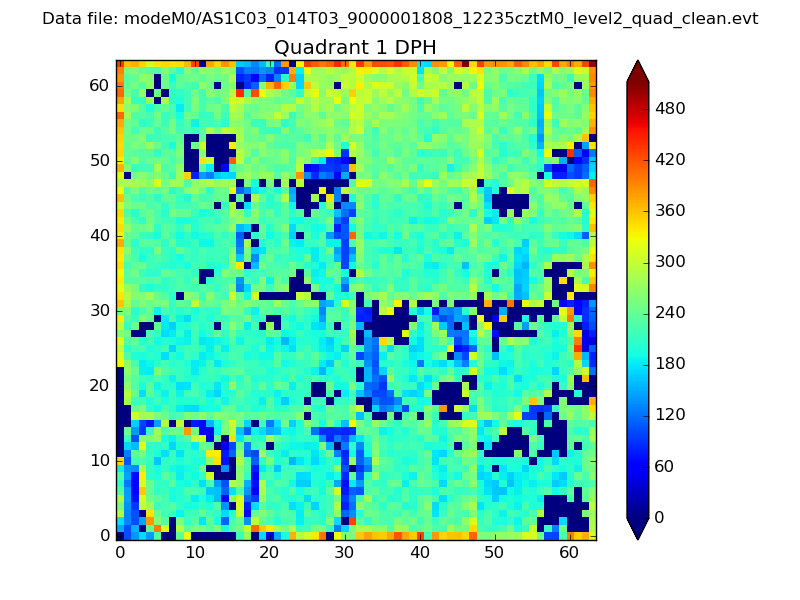
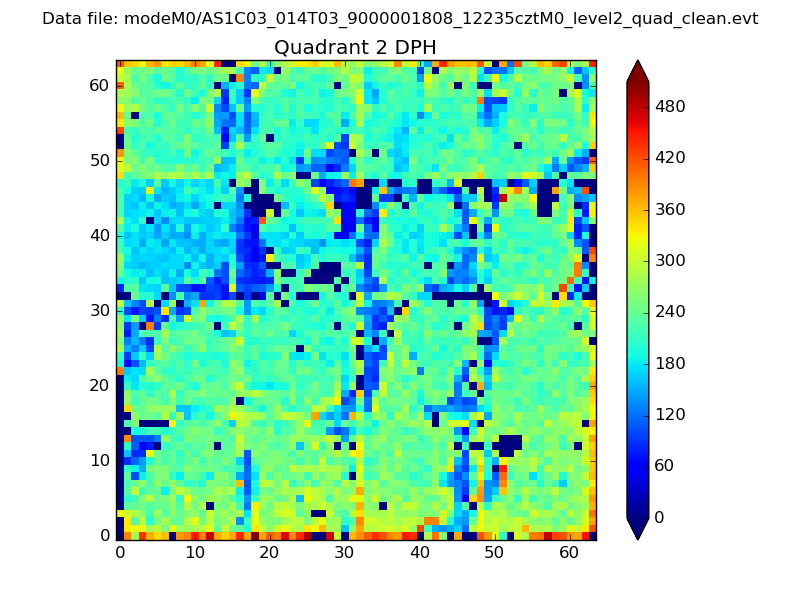
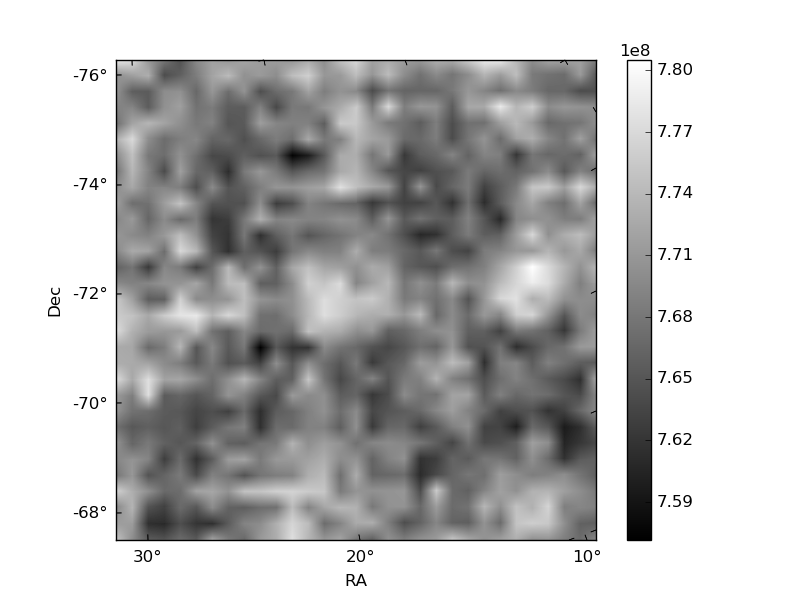
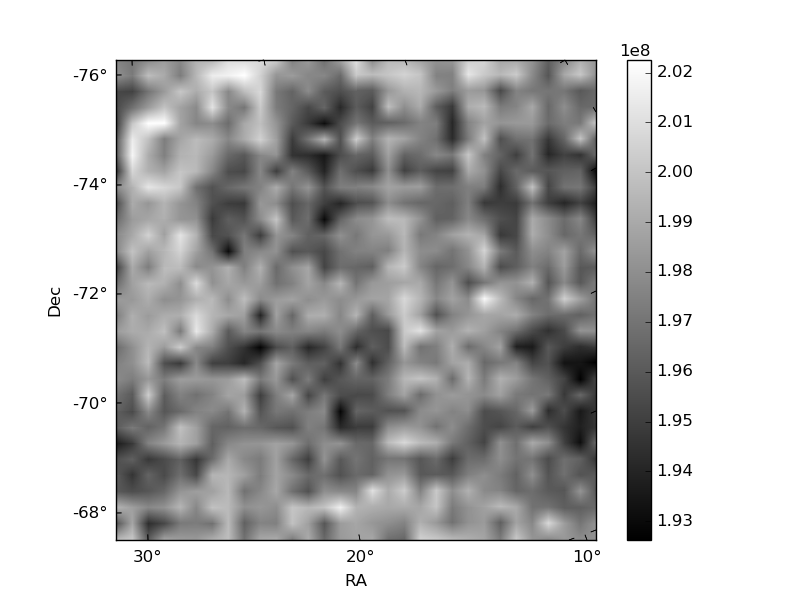
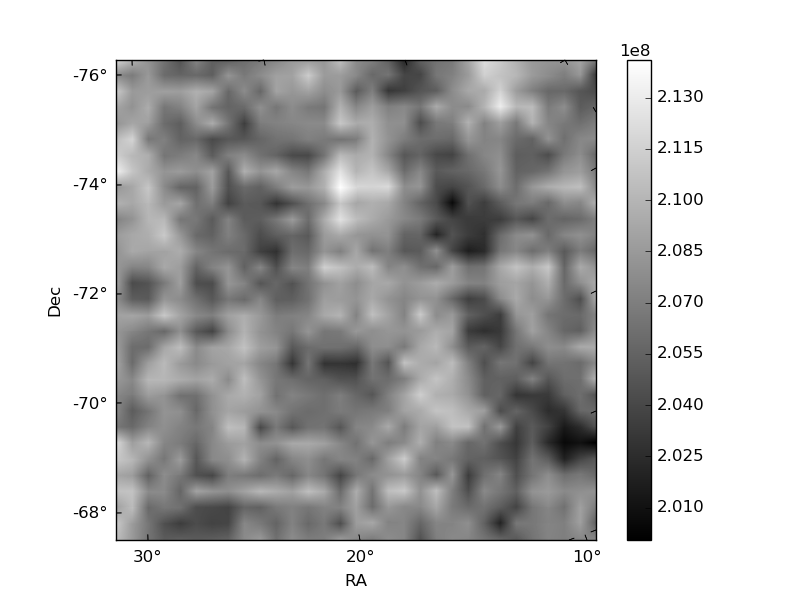
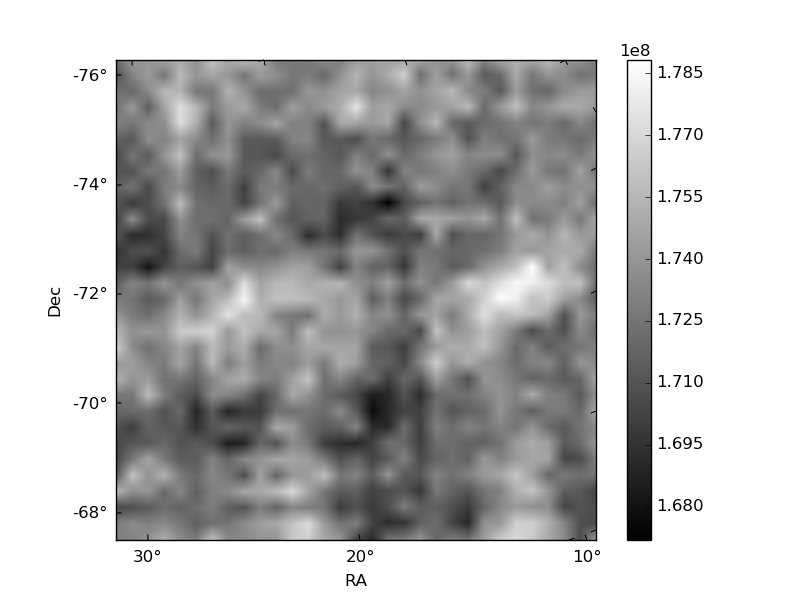
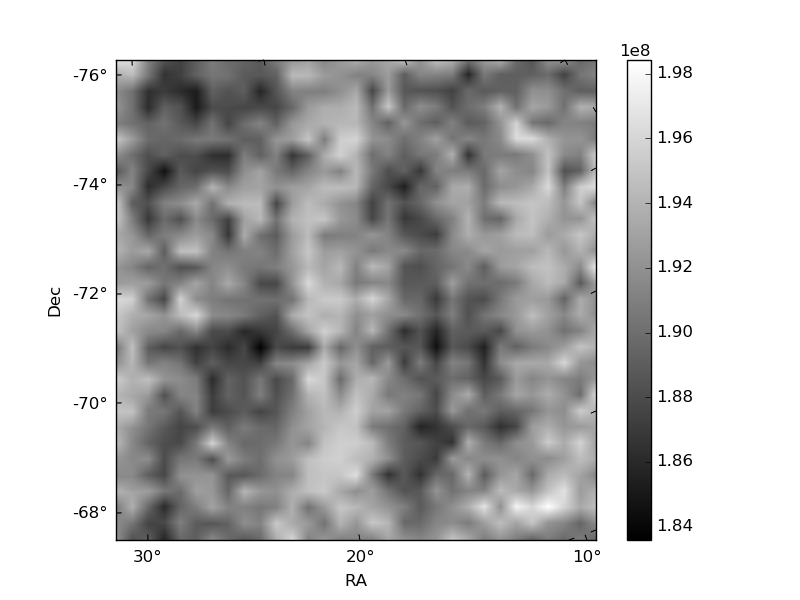
Histogram calculated using DETX and DETY for each event in the final _common_clean file
| Quadrant A |  |
 |
Quadrant B |
|---|---|---|---|
| Quadrant D | 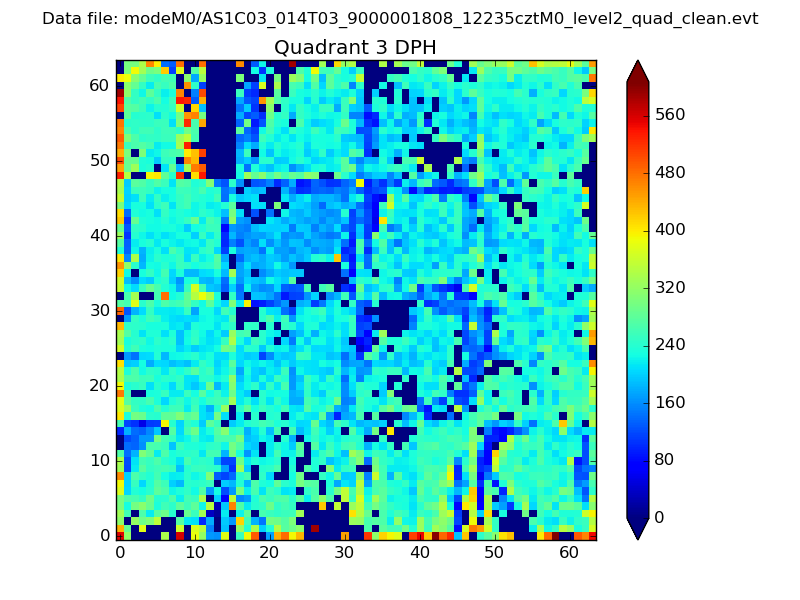 |
 |
Quadrant C |
| Plot type | Count rate plots | Images |
|---|---|---|
| Comparison with Poisson distribution Blue bars denote a histogram of data divided into 1 sec bins. Red curve is a Poisson curve with rate = median count rate of data. |
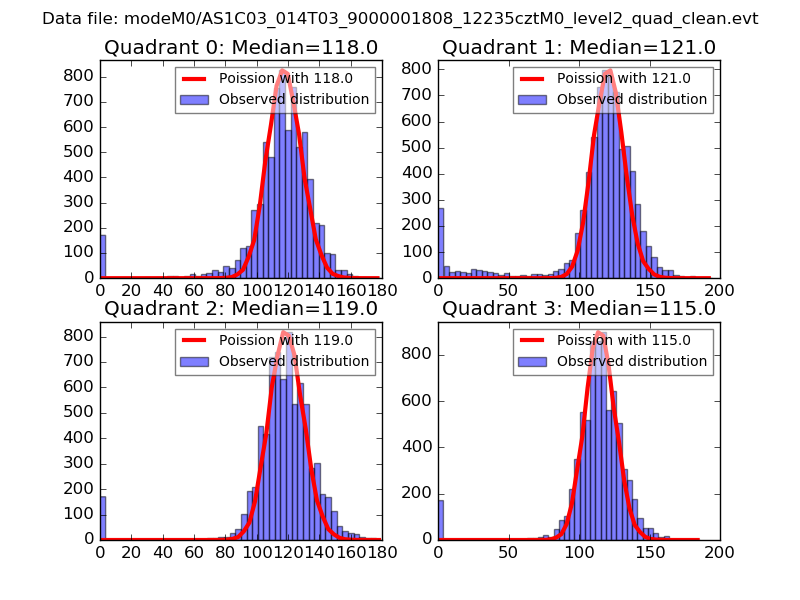 |
 |
| Quadrant-wise count rates Data is divided into 100 sec bins |
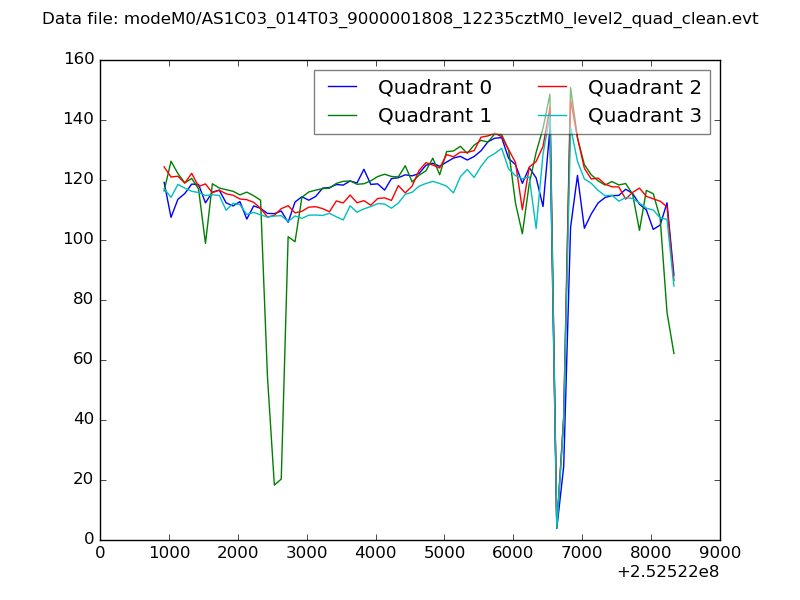 |
|
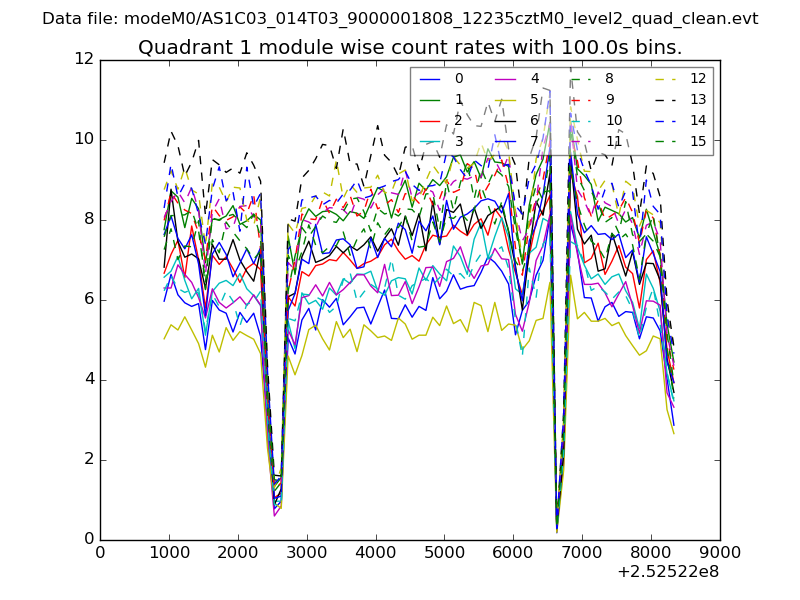
| Module-wise count rates for Quadrant A Data is divided into 100 sec bins |
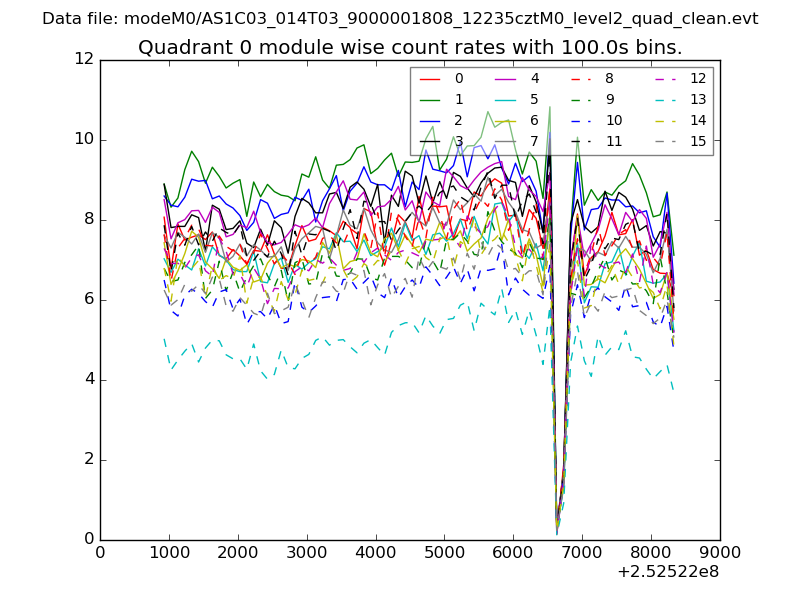 |
 |
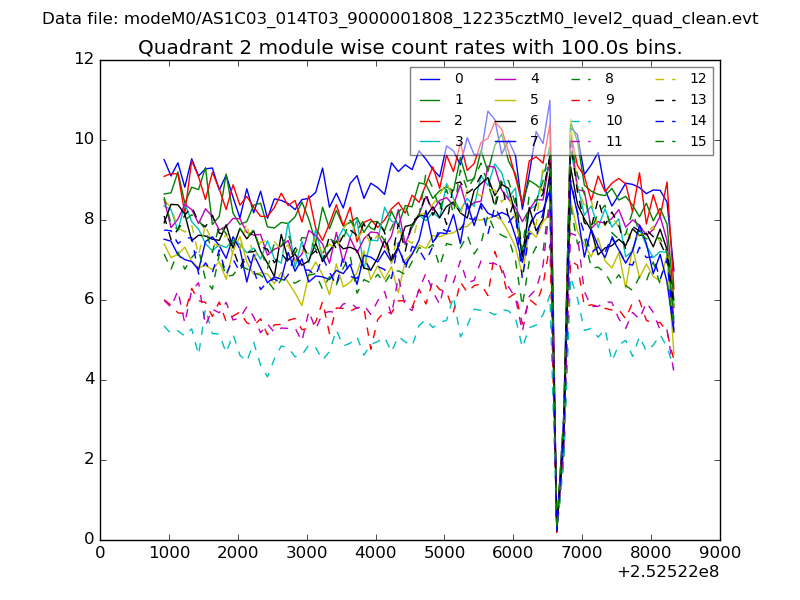
| Module-wise count rates for Quadrant B Data is divided into 100 sec bins |
 |
 |
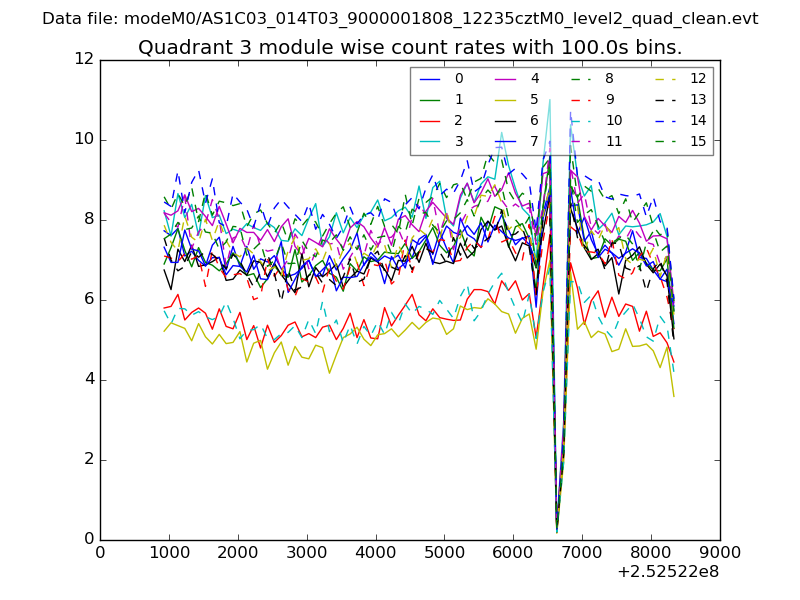
| Module-wise count rates for Quadrant C Data is divided into 100 sec bins |
 |
 |
| Module-wise count rates for Quadrant D Data is divided into 100 sec bins |
 |
 |
| Parameter | Plot |
|---|---|
| CZT HV Monitor | 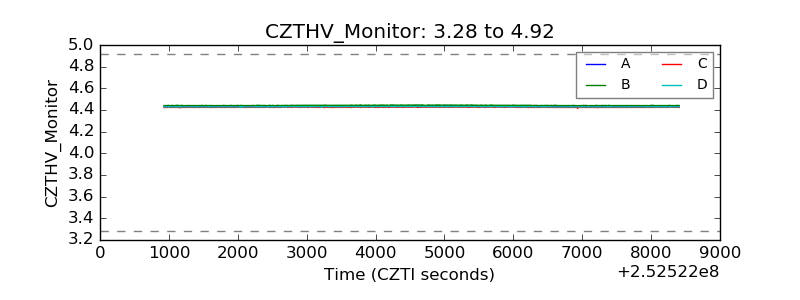 |
| D_VDD | 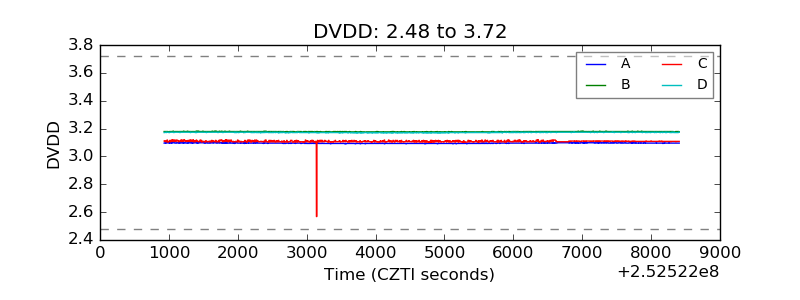 |
| Temperature 1 | 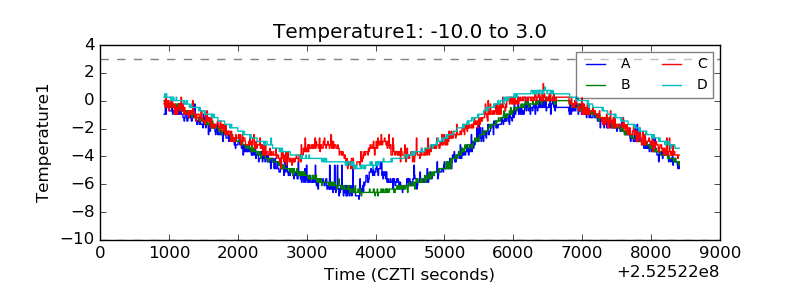 |
| Veto HV Monitor | 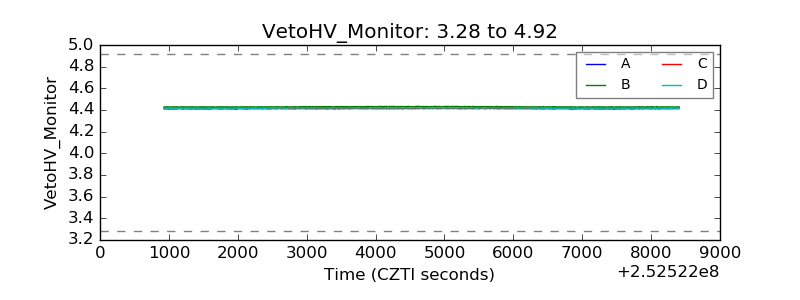 |
| Veto LLD | 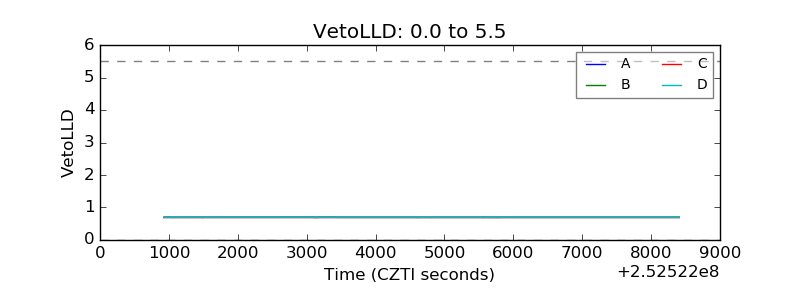 |
| Alpha Counter | 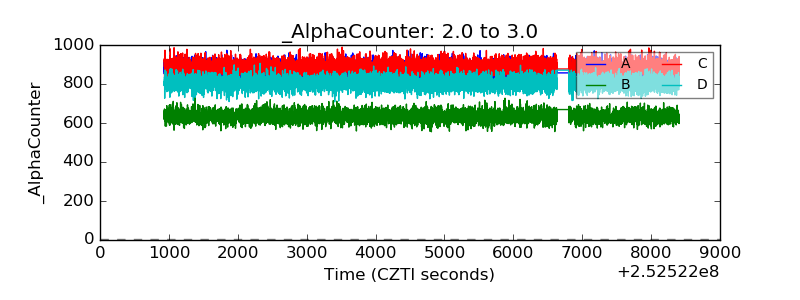 |
| _CPM_Rate | 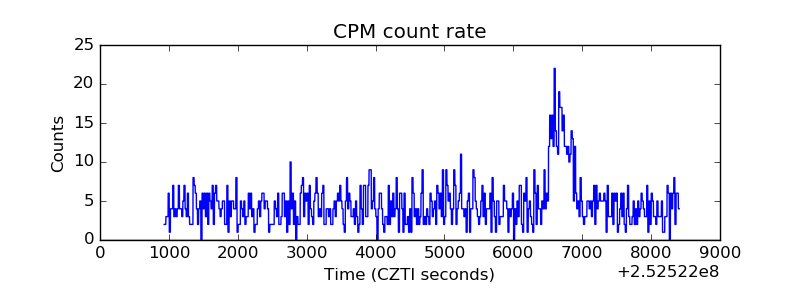 |
| CZT Counter | 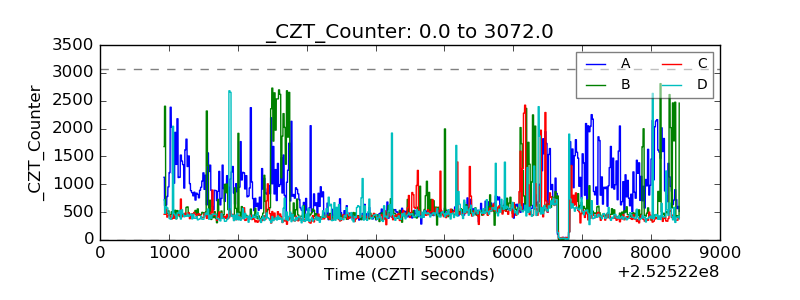 |
| +2.5 Volts monitor |  |
| +5 Volts monitor |  |
| _ROLL_ROT | 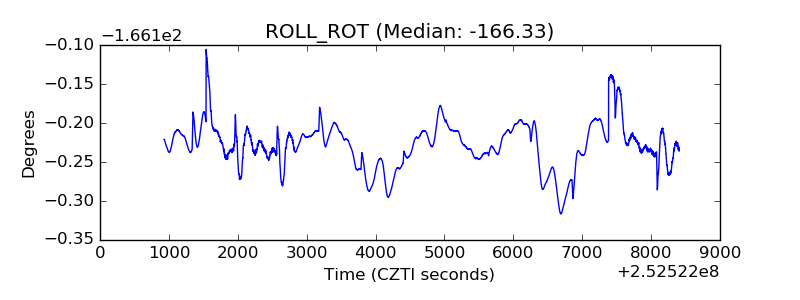 |
| _Roll_DEC | 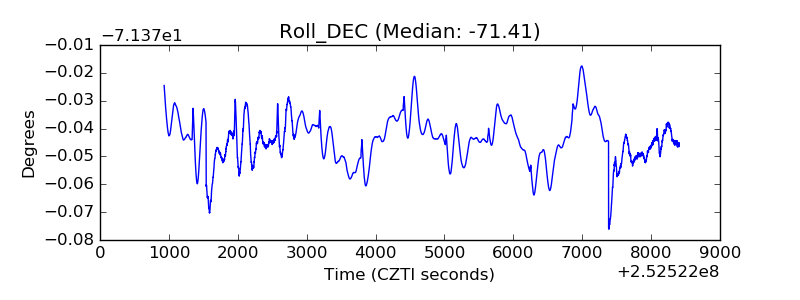 |
| _Roll_RA | 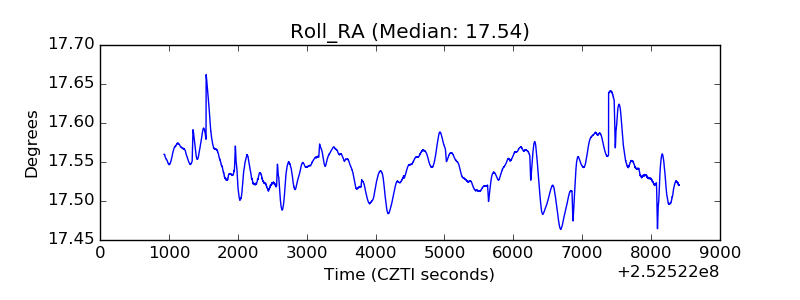 |
| Veto Counter | 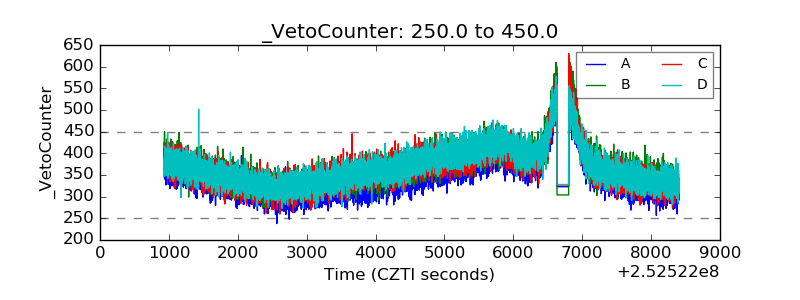 |