| Param | Original file | Final file |
|---|---|---|
| Filename | modeM0/AS1C03_014T03_9000001808_12236cztM0_level2.evt | modeM0/AS1C03_014T03_9000001808_12236cztM0_level2_quad_clean.evt |
| Size (bytes) | 631,123,200 | 123,641,280 |
| Size | 601.9 MB | 117.9 MB |
| Events in quadrant A | 4,786,590 | 837,391 |
| Events in quadrant B | 6,804,435 | 772,327 |
| Events in quadrant C | 3,213,743 | 833,631 |
| Events in quadrant D | 3,828,020 | 806,394 |
| Mode M0 | |||
|---|---|---|---|
| Quadrant | BADHDUFLAG | Total packets | Discarded packets |
| A | 0 | 19054 | 2 |
| B | 0 | 25128 | 1 |
| C | 0 | 14826 | 1 |
| D | 0 | 16508 | 1 |
| Mode M9 | |||
|---|---|---|---|
| Quadrant | BADHDUFLAG | Total packets | Discarded packets |
| A | 0 | 3 | 0 |
| B | 0 | 3 | 0 |
| C | 0 | 3 | 0 |
| D | 0 | 3 | 0 |
| Mode SS | |||
|---|---|---|---|
| Quadrant | BADHDUFLAG | Total packets | Discarded packets |
| A | 0 | 144 | 0 |
| B | 0 | 144 | 0 |
| C | 0 | 144 | 0 |
| D | 0 | 144 | 0 |
| Quadrant | Total seconds | Saturated seconds | Saturation percentage |
|---|---|---|---|
| A | 7101 | 179 | 2.520772% |
| B | 7101 | 1042 | 14.673990% |
| C | 7101 | 45 | 0.633714% |
| D | 7101 | 62 | 0.873116% |
Noise dominated data is calculated using 1-second bins in cleaned event files. If a bin has >2000 counts, and if more than 50% of those come from <1% of pixels, then it is considered to be noise-dominated and hence unusable.
| Quadrant | # 1 sec bins | Bins with >0 counts | Bins with >2000 counts | High rate bins dominated by noise | Noise dominated (total time) | Noise dominated (detector-on time) | Marked lightcurve |
|---|---|---|---|---|---|---|---|
| A | 7437 | 7103 | 60 | 60 | 0.81% | 0.84% | 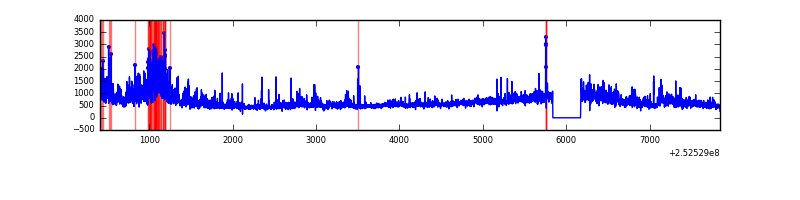 |
| B | 7437 | 7103 | 497 | 497 | 6.68% | 7.00% | 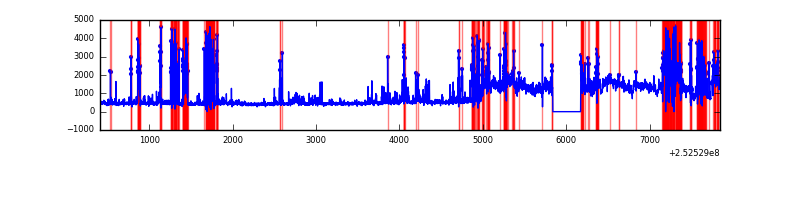 |
| C | 7437 | 7103 | 27 | 27 | 0.36% | 0.38% |  |
| D | 7437 | 7103 | 40 | 40 | 0.54% | 0.56% | 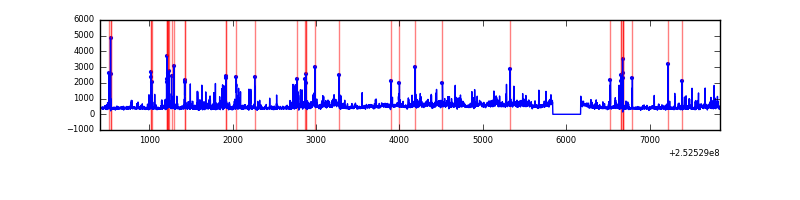 |
Top three noisy pixels from each quadrant. If the there are fewer than three noisy pixels in the level2.evt file, extra rows are filled as -1
| Pixel properties | Quadrant properties | ||||||
|---|---|---|---|---|---|---|---|
| Quadrant | DetID | PixID | Counts | Sigma | Mean | Median | Sigma |
| A | 13 | 251 | 1224241 | 7402.24 | 795 | 777 | 165.3 |
| A | 1 | 162 | 128863 | 774.95 | 795 | 777 | 165.3 |
| A | 8 | 15 | 111947 | 672.6 | 795 | 777 | 165.3 |
| B | 4 | 206 | 1796960 | 12667.18 | 745 | 726 | 141.8 |
| B | 4 | 239 | 1486785 | 10479.8 | 745 | 726 | 141.8 |
| B | 3 | 64 | 250266 | 1759.78 | 745 | 726 | 141.8 |
| C | 15 | 208 | 165443 | 924.84 | 769 | 772 | 178.1 |
| C | 4 | 175 | 27862 | 152.15 | 769 | 772 | 178.1 |
| C | 0 | 207 | 7946 | 40.29 | 769 | 772 | 178.1 |
| D | 1 | 52 | 281700 | 1499.55 | 767 | 744 | 187.4 |
| D | 13 | 104 | 143755 | 763.29 | 767 | 744 | 187.4 |
| D | 5 | 222 | 134224 | 712.42 | 767 | 744 | 187.4 |
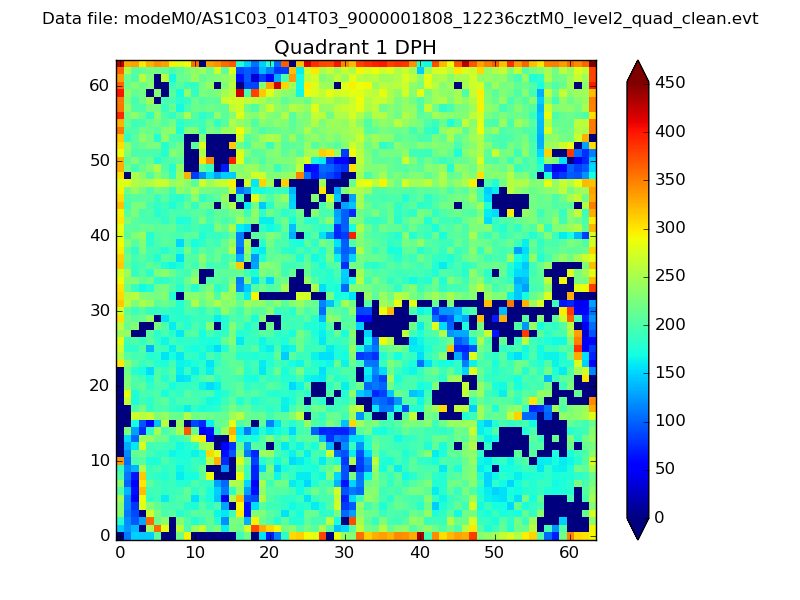
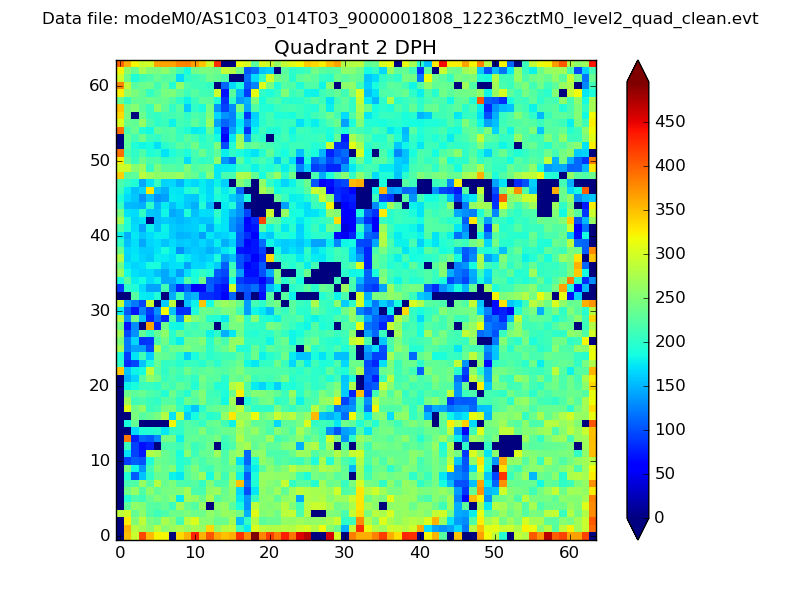
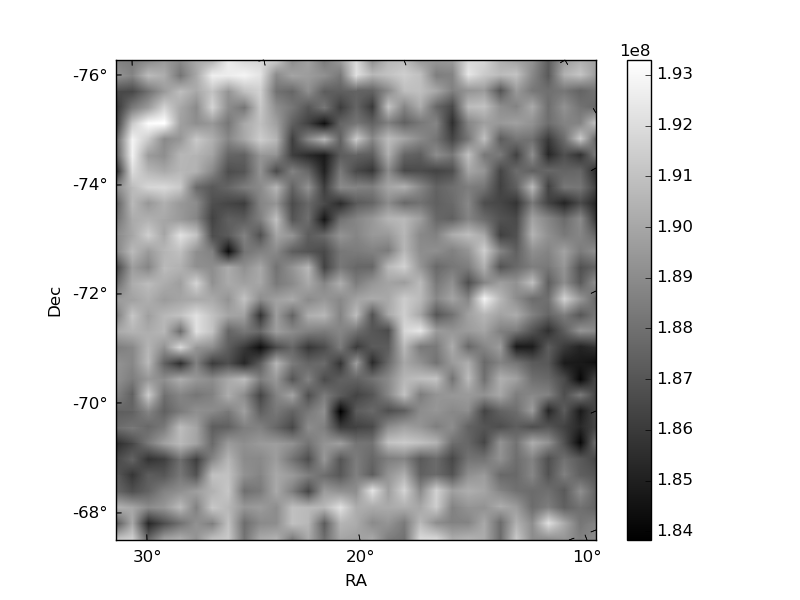
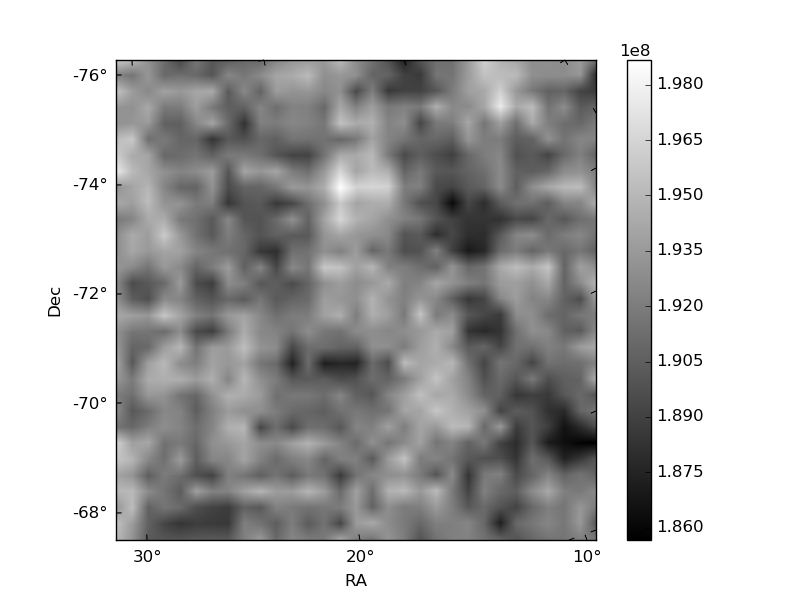
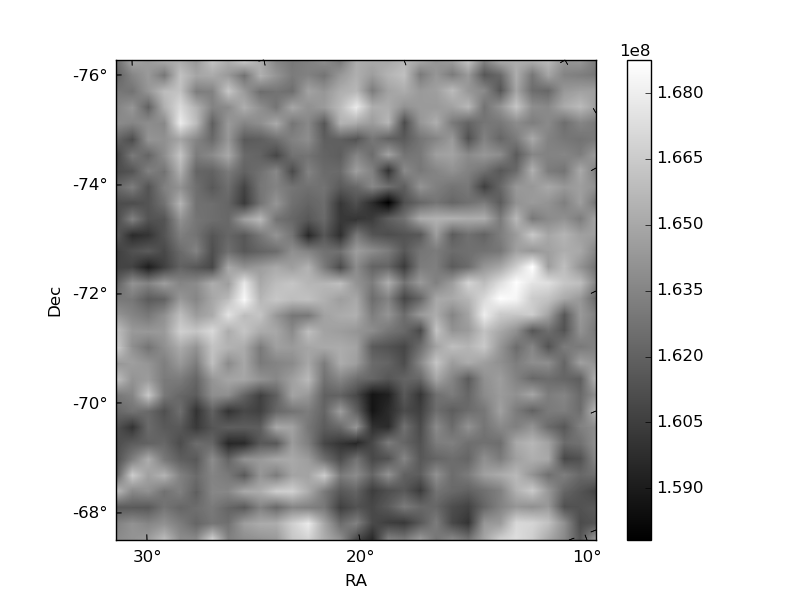
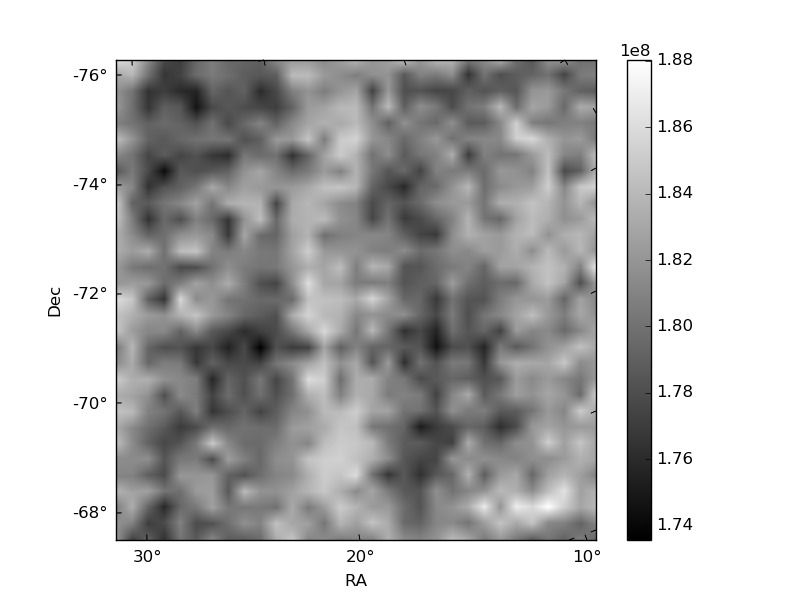
Histogram calculated using DETX and DETY for each event in the final _common_clean file
| Quadrant A | 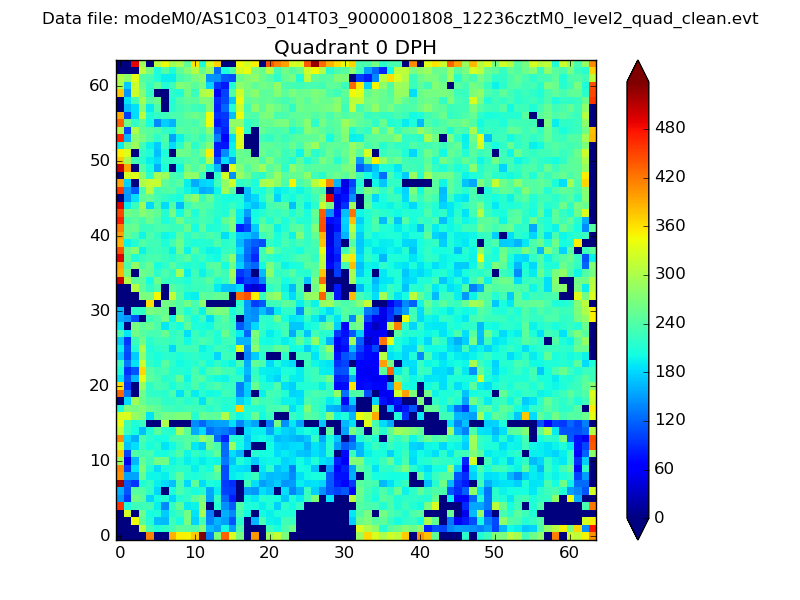 |
 |
Quadrant B |
|---|---|---|---|
| Quadrant D |  |
 |
Quadrant C |
| Plot type | Count rate plots | Images |
|---|---|---|
| Comparison with Poisson distribution Blue bars denote a histogram of data divided into 1 sec bins. Red curve is a Poisson curve with rate = median count rate of data. |
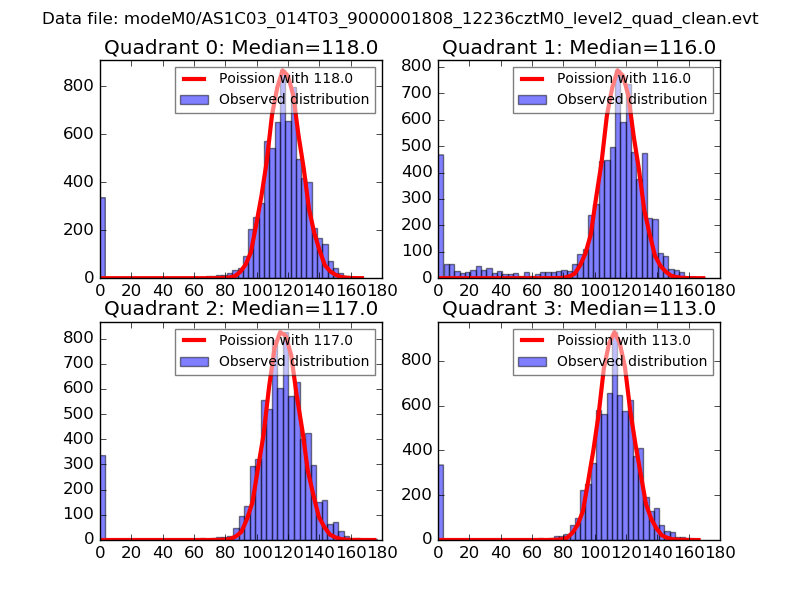 |
 |
| Quadrant-wise count rates Data is divided into 100 sec bins |
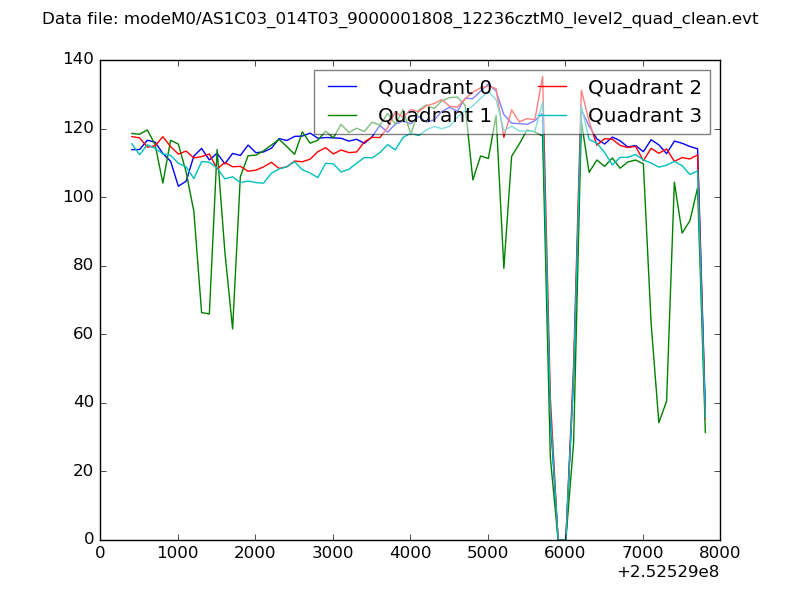 |
|
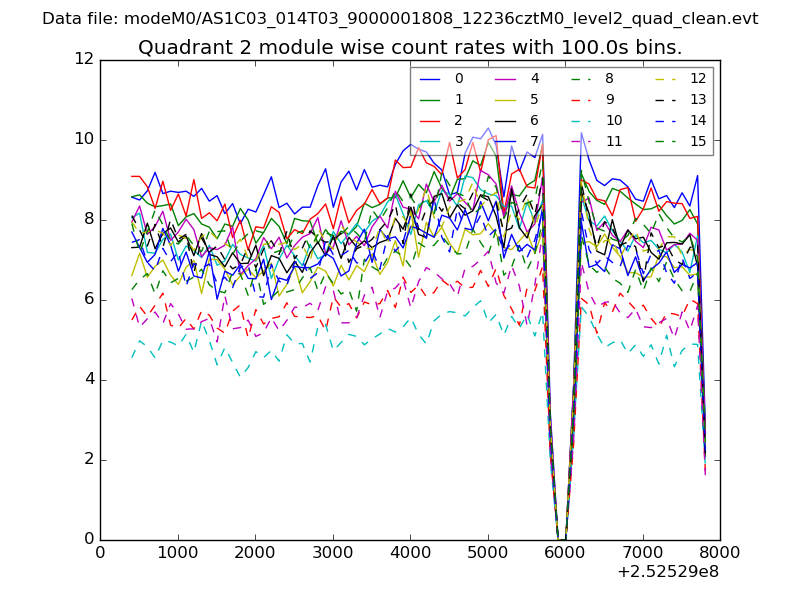
| Module-wise count rates for Quadrant A Data is divided into 100 sec bins |
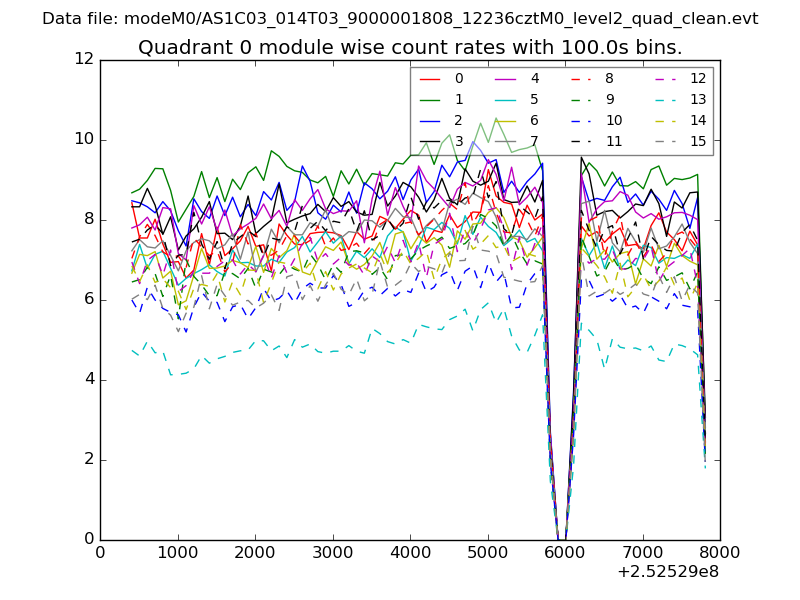 |
 |
| Module-wise count rates for Quadrant B Data is divided into 100 sec bins |
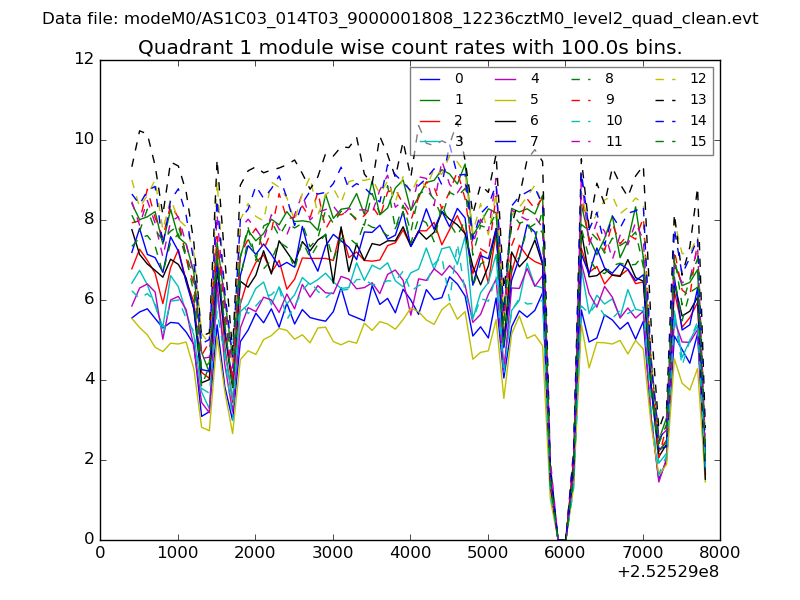 |
 |
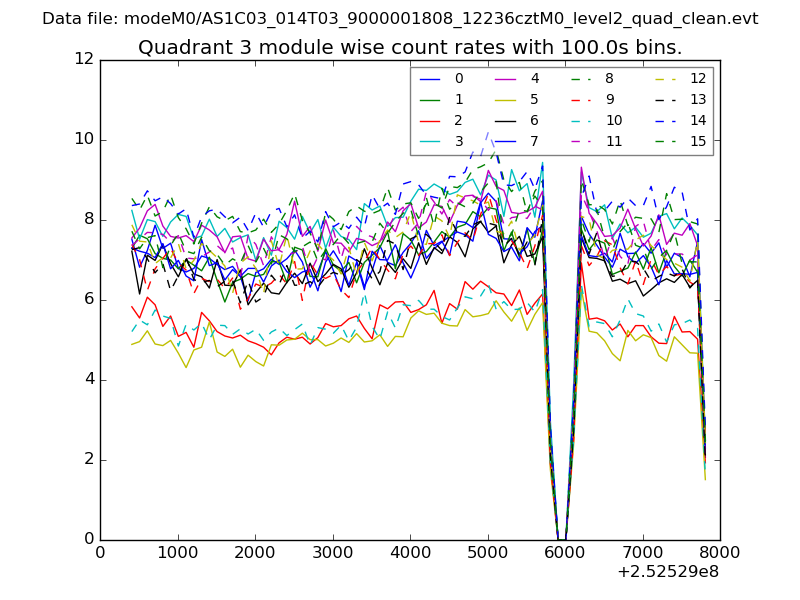
| Module-wise count rates for Quadrant C Data is divided into 100 sec bins |
 |
 |
| Module-wise count rates for Quadrant D Data is divided into 100 sec bins |
 |
 |
| Parameter | Plot |
|---|---|
| CZT HV Monitor |  |
| D_VDD | 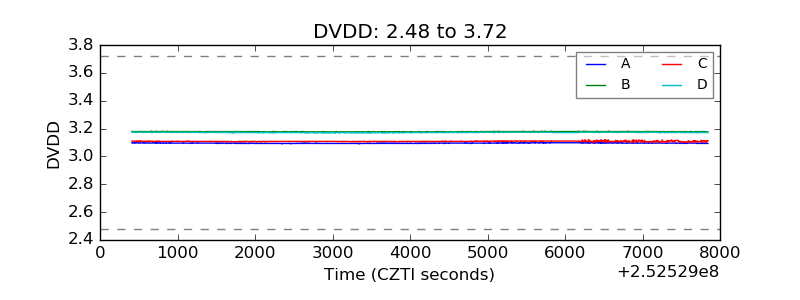 |
| Temperature 1 | 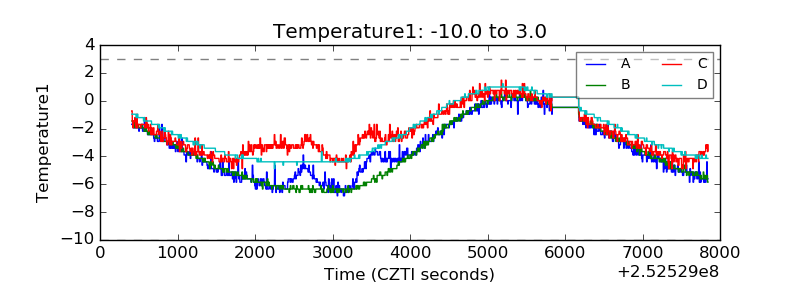 |
| Veto HV Monitor | 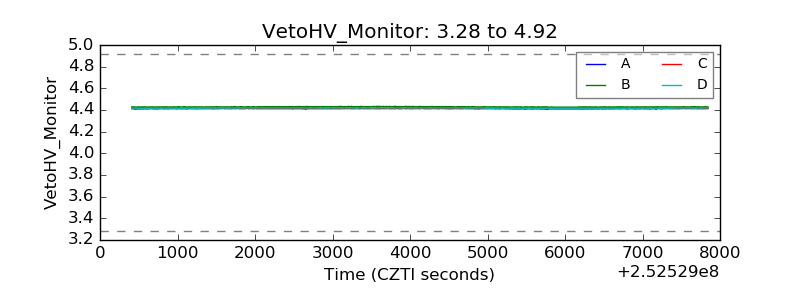 |
| Veto LLD | 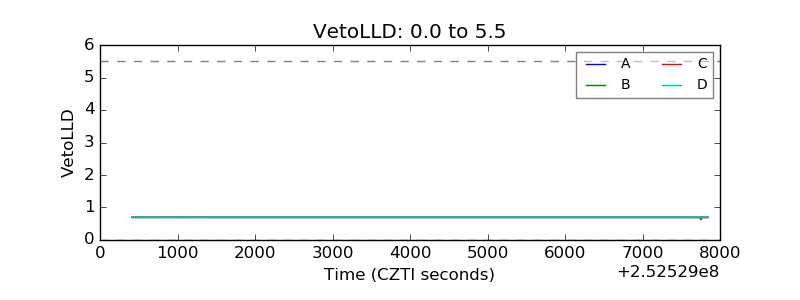 |
| Alpha Counter | 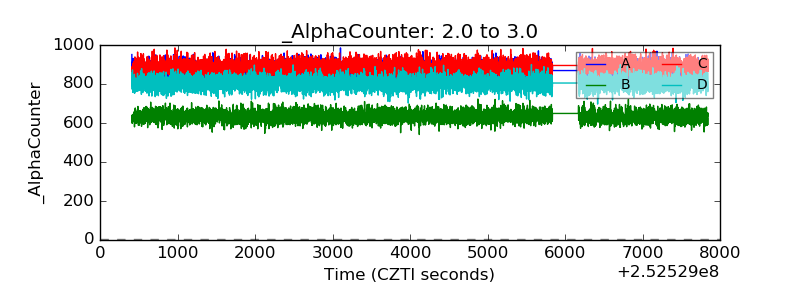 |
| _CPM_Rate | 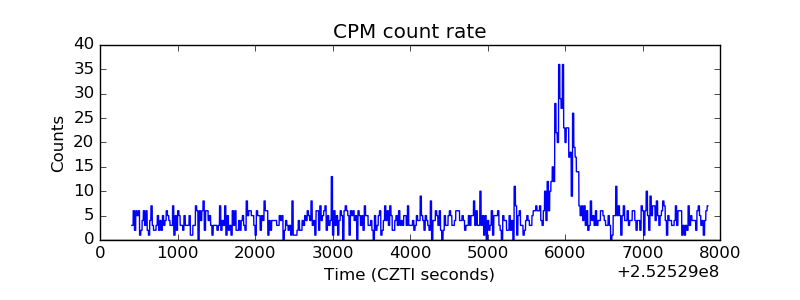 |
| CZT Counter |  |
| +2.5 Volts monitor |  |
| +5 Volts monitor |  |
| _ROLL_ROT | 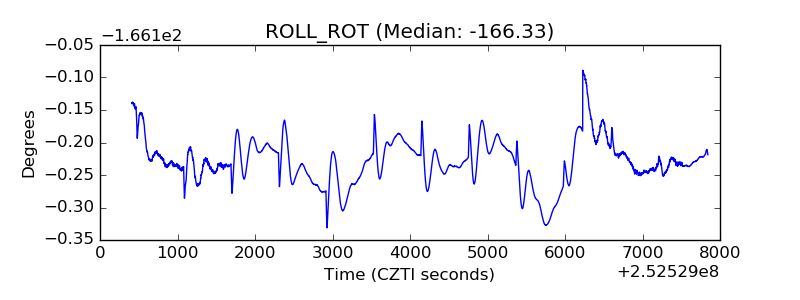 |
| _Roll_DEC | 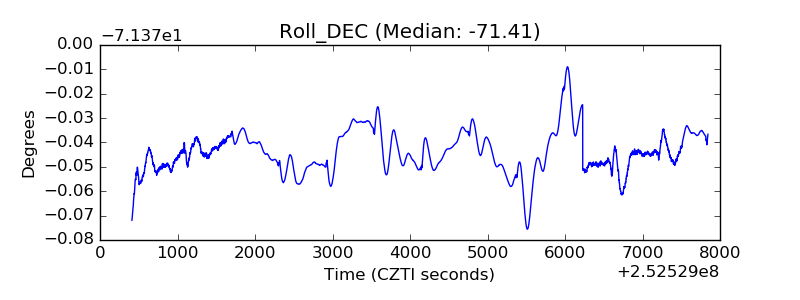 |
| _Roll_RA | 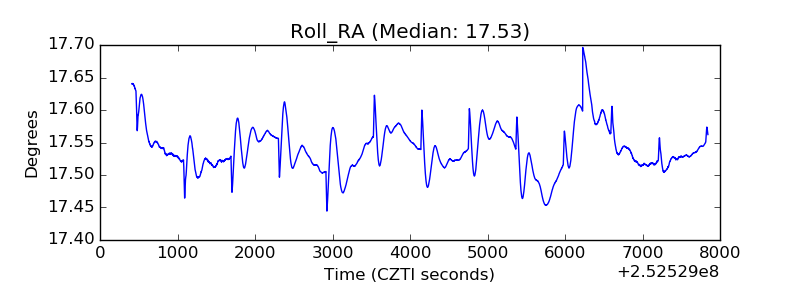 |
| Veto Counter | 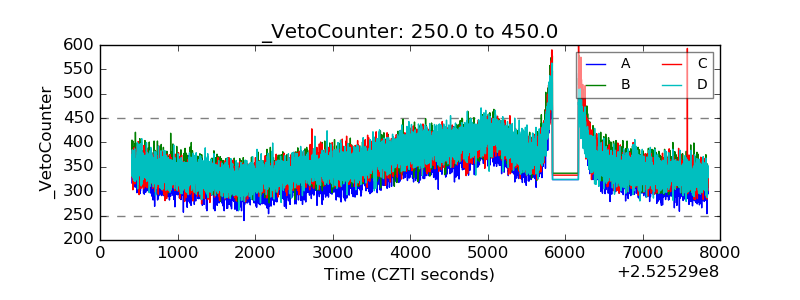 |