| Param | Original file | Final file |
|---|---|---|
| Filename | modeM0/AS1C03_014T03_9000001808_12238cztM0_level2.evt | modeM0/AS1C03_014T03_9000001808_12238cztM0_level2_quad_clean.evt |
| Size (bytes) | 204,825,600 | 38,211,840 |
| Size | 195.3 MB | 36.4 MB |
| Events in quadrant A | 1,323,978 | 261,286 |
| Events in quadrant B | 2,710,215 | 231,081 |
| Events in quadrant C | 949,415 | 252,874 |
| Events in quadrant D | 1,061,918 | 246,123 |
| Mode M0 | |||
|---|---|---|---|
| Quadrant | BADHDUFLAG | Total packets | Discarded packets |
| A | 0 | 5434 | 1 |
| B | 0 | 9703 | 0 |
| C | 0 | 4684 | 0 |
| D | 0 | 4869 | 0 |
| Mode SS | |||
|---|---|---|---|
| Quadrant | BADHDUFLAG | Total packets | Discarded packets |
| A | 0 | 46 | 0 |
| B | 0 | 46 | 0 |
| C | 0 | 46 | 0 |
| D | 0 | 46 | 0 |
| Quadrant | Total seconds | Saturated seconds | Saturation percentage |
|---|---|---|---|
| A | 2292 | 15 | 0.654450% |
| B | 2292 | 336 | 14.659686% |
| C | 2292 | 6 | 0.261780% |
| D | 2292 | 9 | 0.392670% |
Noise dominated data is calculated using 1-second bins in cleaned event files. If a bin has >2000 counts, and if more than 50% of those come from <1% of pixels, then it is considered to be noise-dominated and hence unusable.
| Quadrant | # 1 sec bins | Bins with >0 counts | Bins with >2000 counts | High rate bins dominated by noise | Noise dominated (total time) | Noise dominated (detector-on time) | Marked lightcurve |
|---|---|---|---|---|---|---|---|
| A | 2293 | 2293 | 9 | 9 | 0.39% | 0.39% | 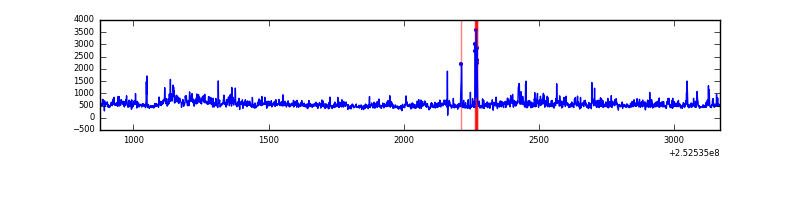 |
| B | 2293 | 2293 | 216 | 216 | 9.42% | 9.42% | 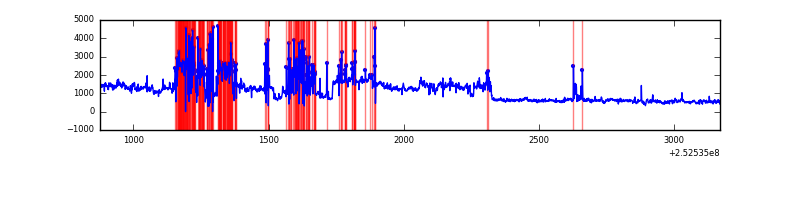 |
| C | 2293 | 2293 | 6 | 6 | 0.26% | 0.26% | 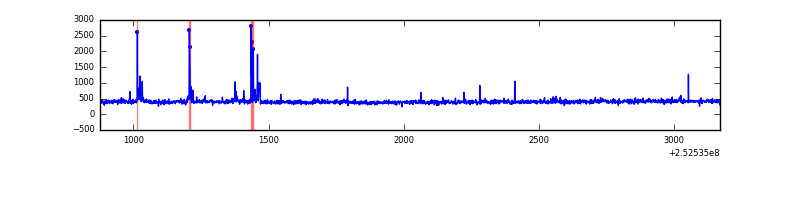 |
| D | 2293 | 2293 | 5 | 5 | 0.22% | 0.22% | 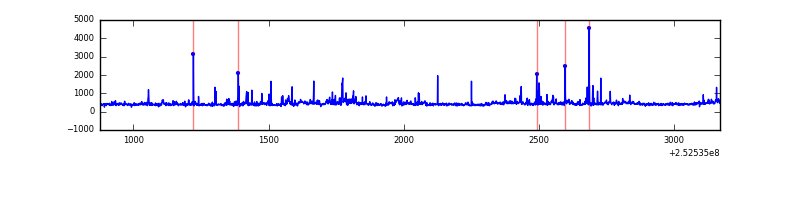 |
Top three noisy pixels from each quadrant. If the there are fewer than three noisy pixels in the level2.evt file, extra rows are filled as -1
| Pixel properties | Quadrant properties | ||||||
|---|---|---|---|---|---|---|---|
| Quadrant | DetID | PixID | Counts | Sigma | Mean | Median | Sigma |
| A | 13 | 251 | 226895 | 4552.87 | 234 | 230 | 49.8 |
| A | 1 | 162 | 48279 | 965.13 | 234 | 230 | 49.8 |
| A | 8 | 15 | 31391 | 625.91 | 234 | 230 | 49.8 |
| B | 4 | 206 | 1188261 | 28034.7 | 217 | 211 | 42.4 |
| B | 4 | 239 | 559926 | 13207.73 | 217 | 211 | 42.4 |
| B | 3 | 64 | 71393 | 1679.7 | 217 | 211 | 42.4 |
| C | 15 | 208 | 38228 | 688.86 | 229 | 229 | 55.2 |
| C | 4 | 175 | 4486 | 77.17 | 229 | 229 | 55.2 |
| C | 12 | 4 | 3734 | 63.54 | 229 | 229 | 55.2 |
| D | 1 | 52 | 80446 | 1445.73 | 225 | 218 | 55.5 |
| D | 13 | 249 | 43293 | 776.22 | 225 | 218 | 55.5 |
| D | 10 | 199 | 23045 | 411.35 | 225 | 218 | 55.5 |
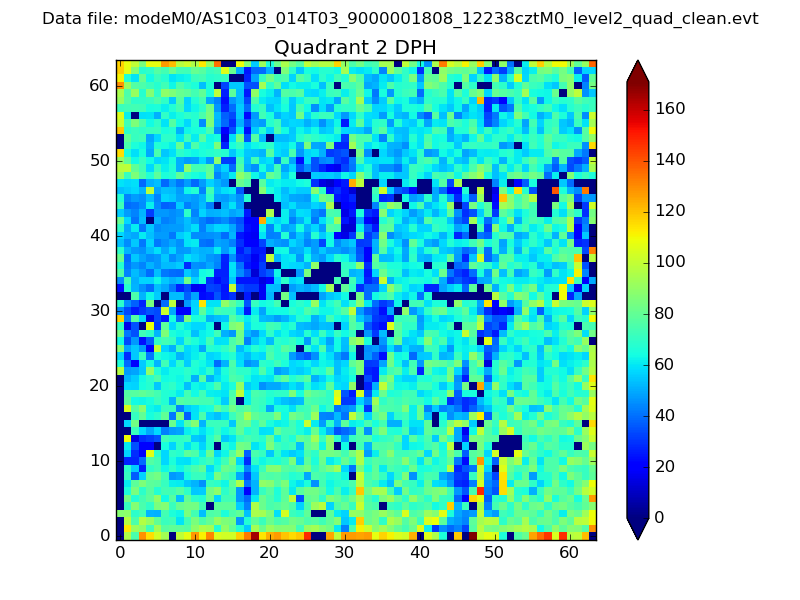
Histogram calculated using DETX and DETY for each event in the final _common_clean file
| Quadrant A |  |
 |
Quadrant B |
|---|---|---|---|
| Quadrant D | 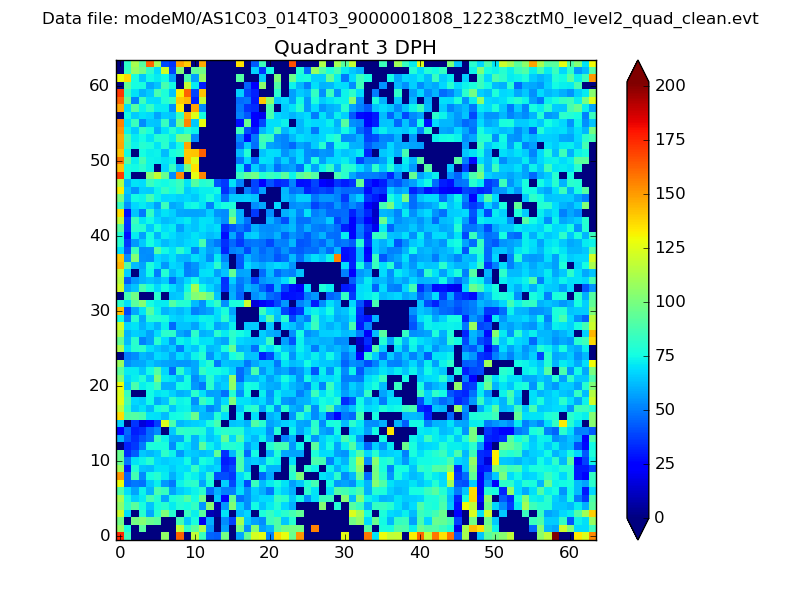 |
 |
Quadrant C |
| Plot type | Count rate plots | Images |
|---|---|---|
| Comparison with Poisson distribution Blue bars denote a histogram of data divided into 1 sec bins. Red curve is a Poisson curve with rate = median count rate of data. |
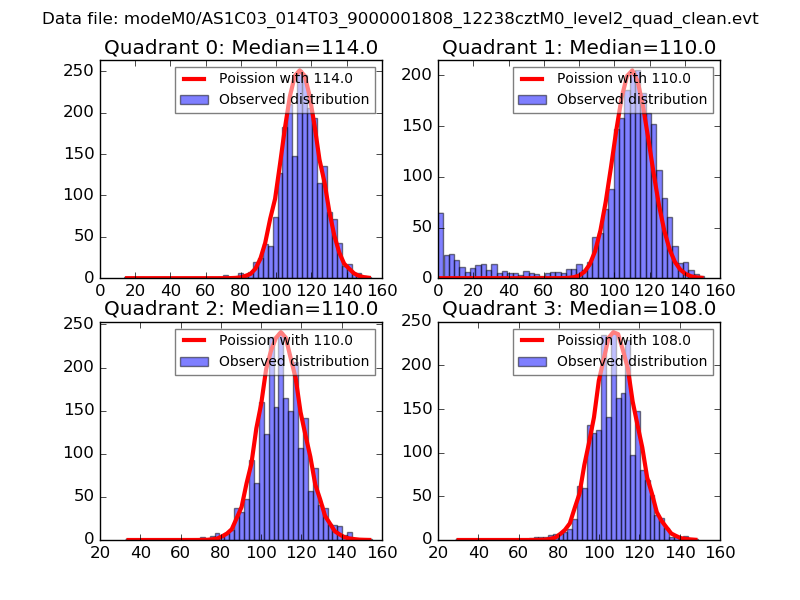 |
 |
| Quadrant-wise count rates Data is divided into 100 sec bins |
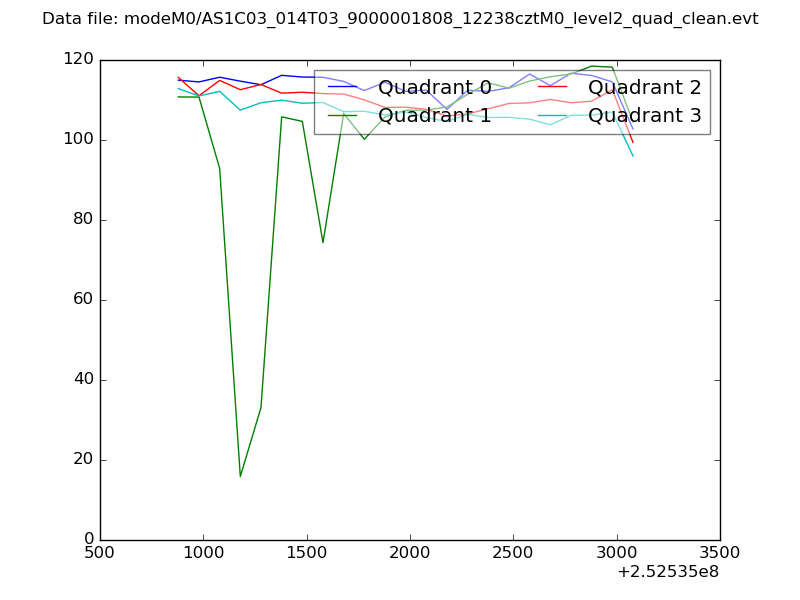 |
|
| Module-wise count rates for Quadrant A Data is divided into 100 sec bins |
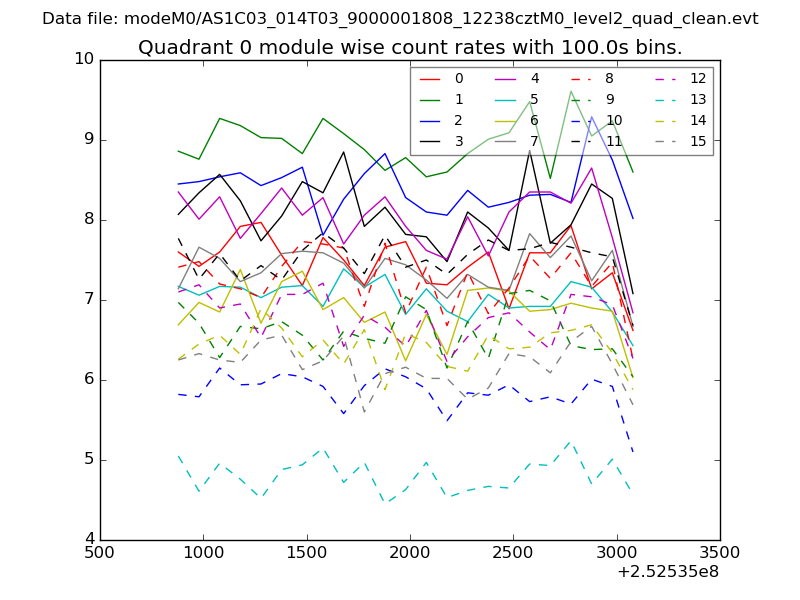 |
 |
| Module-wise count rates for Quadrant B Data is divided into 100 sec bins |
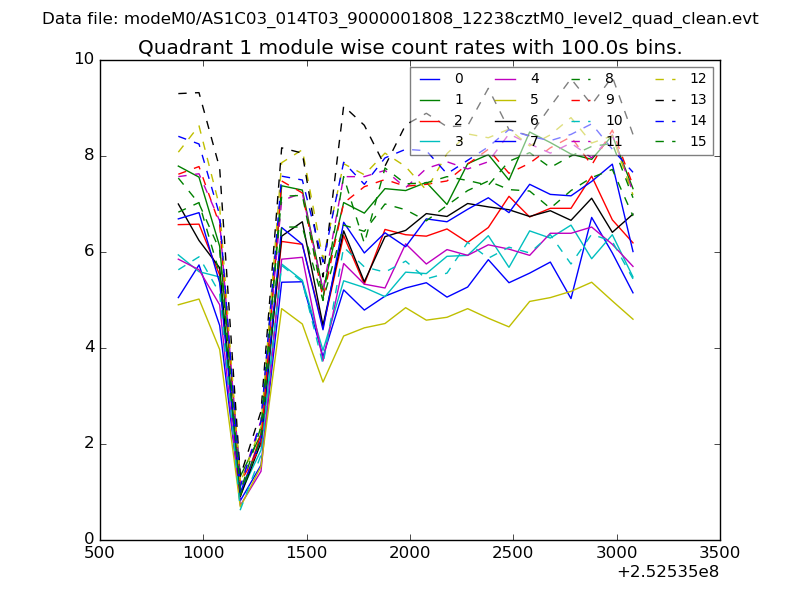 |
 |
| Module-wise count rates for Quadrant C Data is divided into 100 sec bins |
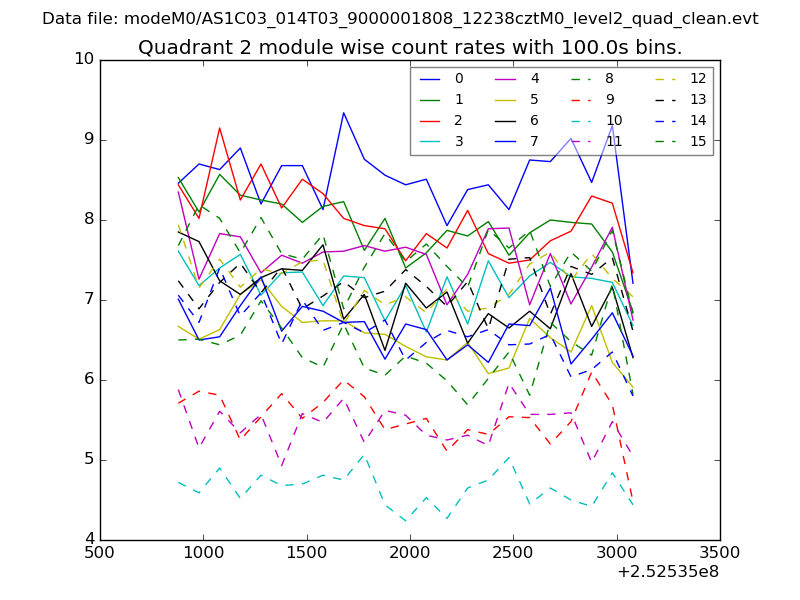 |
 |
| Module-wise count rates for Quadrant D Data is divided into 100 sec bins |
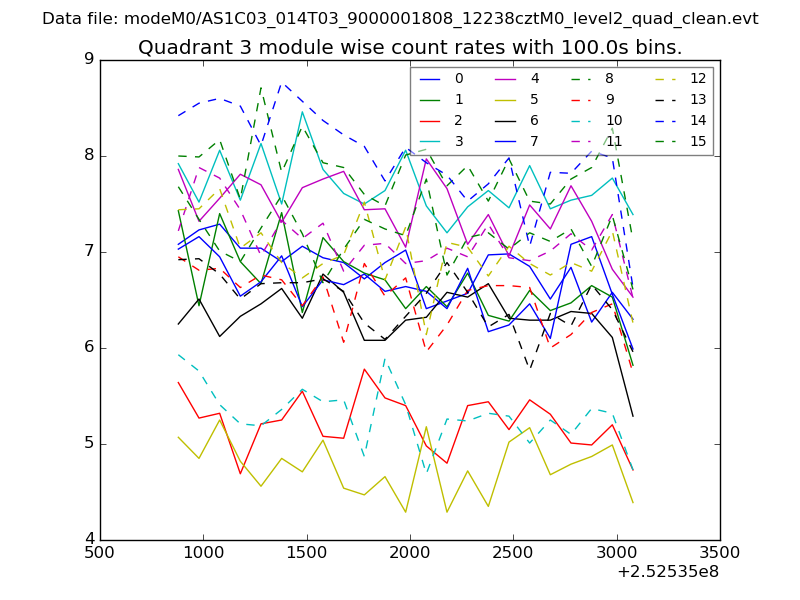 |
 |
| Parameter | Plot |
|---|---|
| CZT HV Monitor | 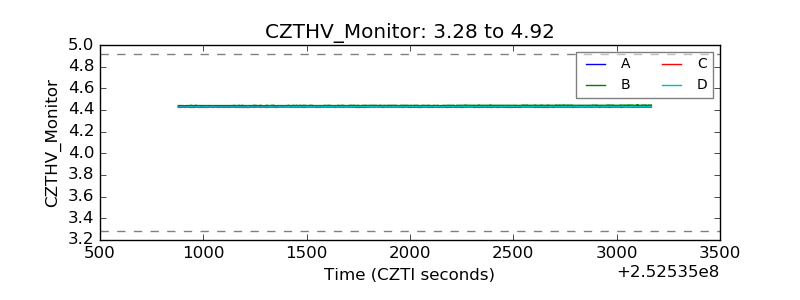 |
| D_VDD | 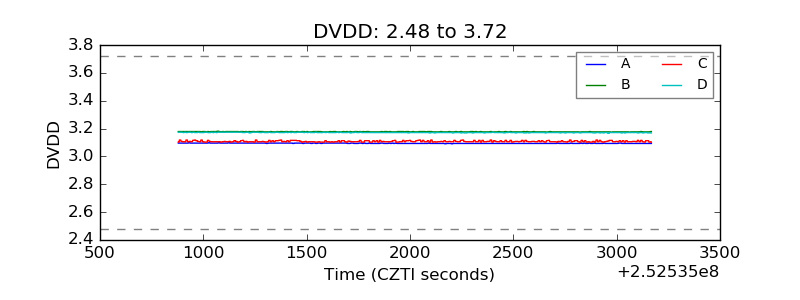 |
| Temperature 1 | 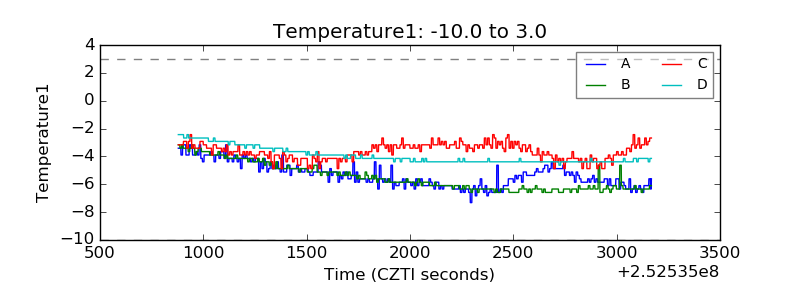 |
| Veto HV Monitor | 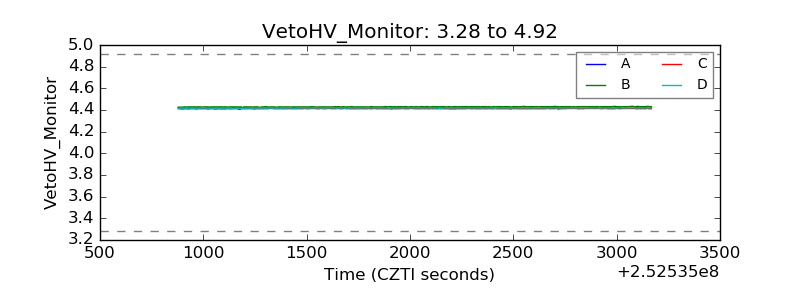 |
| Veto LLD | 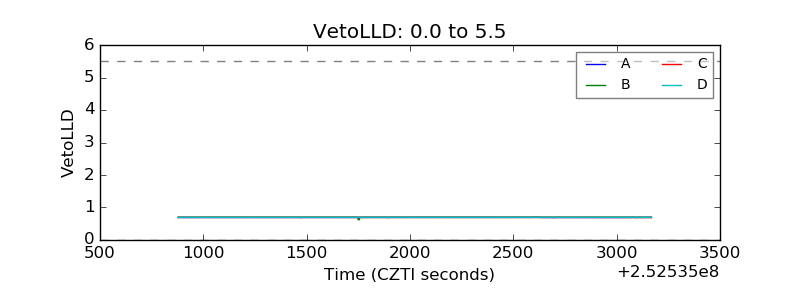 |
| Alpha Counter | 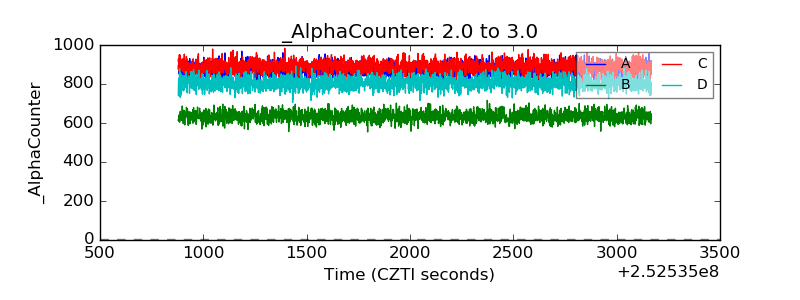 |
| _CPM_Rate | 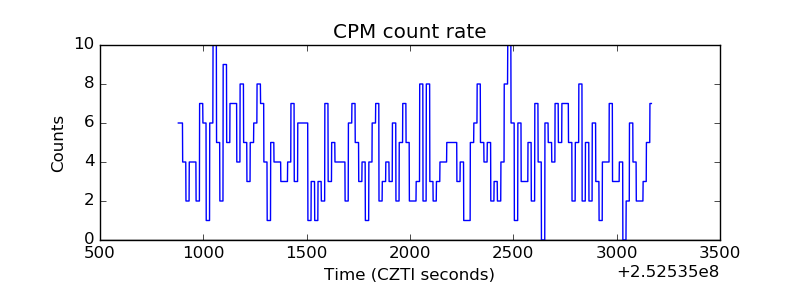 |
| CZT Counter | 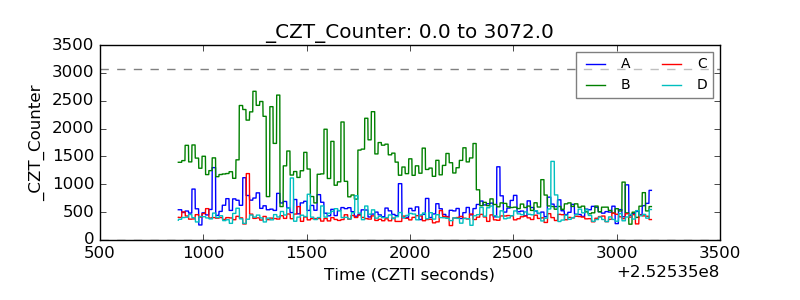 |
| +2.5 Volts monitor |  |
| +5 Volts monitor |  |
| _ROLL_ROT | 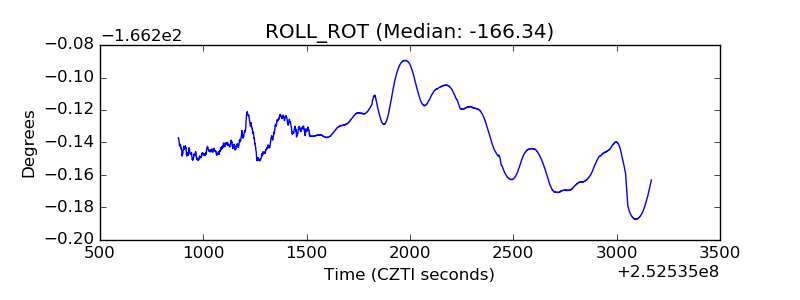 |
| _Roll_DEC | 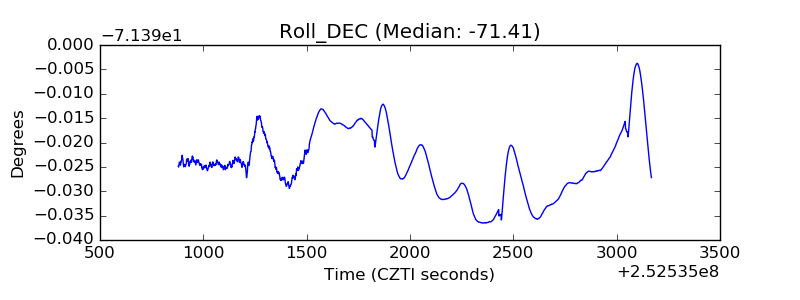 |
| _Roll_RA |  |
| Veto Counter | 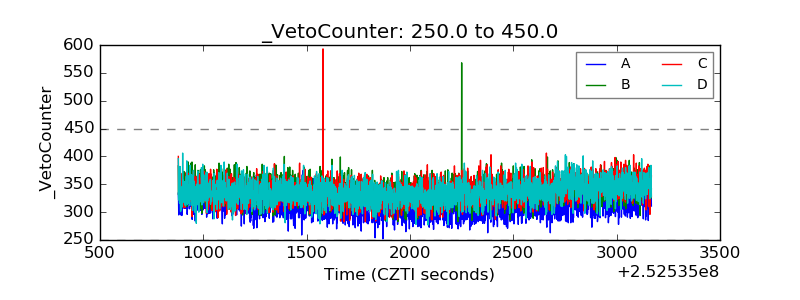 |