| Param | Original file | Final file |
|---|---|---|
| Filename | modeM0/AS1C03_014T03_9000001808_12239cztM0_level2.evt | modeM0/AS1C03_014T03_9000001808_12239cztM0_level2_quad_clean.evt |
| Size (bytes) | 1,407,041,280 | 281,105,280 |
| Size | 1.3 GB | 268.1 MB |
| Events in quadrant A | 10,005,620 | 1,902,010 |
| Events in quadrant B | 13,116,626 | 1,831,544 |
| Events in quadrant C | 7,529,201 | 1,897,039 |
| Events in quadrant D | 10,883,074 | 1,780,634 |
| Mode M0 | |||
|---|---|---|---|
| Quadrant | BADHDUFLAG | Total packets | Discarded packets |
| A | 0 | 40410 | 4 |
| B | 0 | 49755 | 3 |
| C | 0 | 33712 | 3 |
| D | 0 | 43138 | 3 |
| Mode M9 | |||
|---|---|---|---|
| Quadrant | BADHDUFLAG | Total packets | Discarded packets |
| A | 0 | 20 | 0 |
| B | 0 | 20 | 0 |
| C | 0 | 20 | 0 |
| D | 0 | 20 | 0 |
| Mode SS | |||
|---|---|---|---|
| Quadrant | BADHDUFLAG | Total packets | Discarded packets |
| A | 0 | 326 | 0 |
| B | 0 | 326 | 0 |
| C | 0 | 326 | 0 |
| D | 0 | 326 | 0 |
| Quadrant | Total seconds | Saturated seconds | Saturation percentage |
|---|---|---|---|
| A | 15983 | 287 | 1.795658% |
| B | 15983 | 1701 | 10.642558% |
| C | 15983 | 128 | 0.800851% |
| D | 15983 | 927 | 5.799912% |
Noise dominated data is calculated using 1-second bins in cleaned event files. If a bin has >2000 counts, and if more than 50% of those come from <1% of pixels, then it is considered to be noise-dominated and hence unusable.
| Quadrant | # 1 sec bins | Bins with >0 counts | Bins with >2000 counts | High rate bins dominated by noise | Noise dominated (total time) | Noise dominated (detector-on time) | Marked lightcurve |
|---|---|---|---|---|---|---|---|
| A | 18004 | 15985 | 32 | 32 | 0.18% | 0.20% | 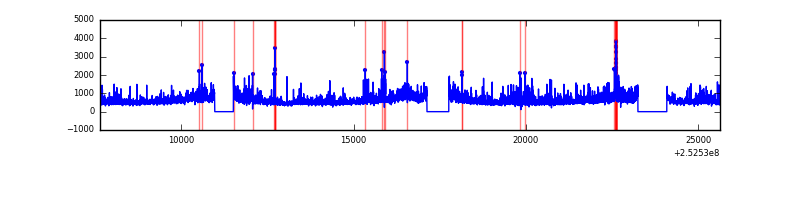 |
| B | 18004 | 15985 | 1010 | 1010 | 5.61% | 6.32% | 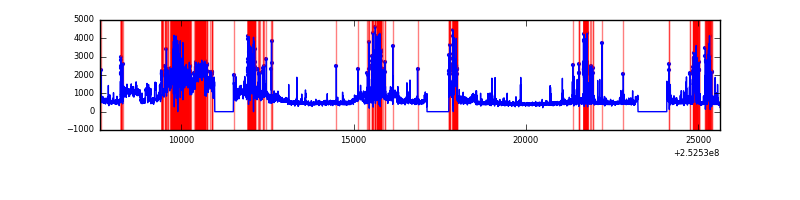 |
| C | 18004 | 15986 | 60 | 60 | 0.33% | 0.38% | 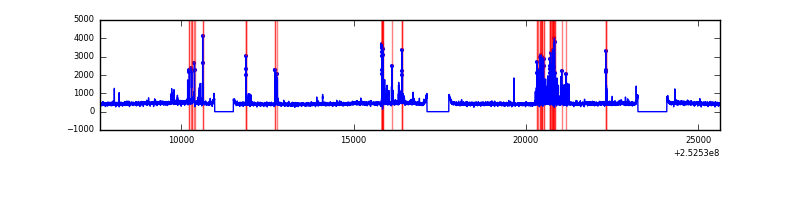 |
| D | 18004 | 15986 | 764 | 764 | 4.24% | 4.78% | 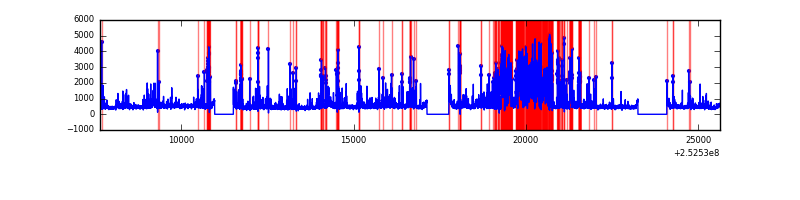 |
Top three noisy pixels from each quadrant. If the there are fewer than three noisy pixels in the level2.evt file, extra rows are filled as -1
| Pixel properties | Quadrant properties | ||||||
|---|---|---|---|---|---|---|---|
| Quadrant | DetID | PixID | Counts | Sigma | Mean | Median | Sigma |
| A | 13 | 251 | 1347379 | 3643.83 | 1828 | 1787 | 369.3 |
| A | 8 | 15 | 460566 | 1242.36 | 1828 | 1787 | 369.3 |
| A | 1 | 162 | 394394 | 1063.17 | 1828 | 1787 | 369.3 |
| B | 4 | 206 | 3742053 | 11358.17 | 1764 | 1720 | 329.3 |
| B | 4 | 239 | 1588517 | 4818.58 | 1764 | 1720 | 329.3 |
| B | 3 | 64 | 483494 | 1462.99 | 1764 | 1720 | 329.3 |
| C | 15 | 208 | 463104 | 1124.66 | 1783 | 1786 | 410.2 |
| C | 5 | 112 | 54446 | 128.38 | 1783 | 1786 | 410.2 |
| C | 4 | 175 | 24536 | 55.46 | 1783 | 1786 | 410.2 |
| D | 10 | 199 | 1917165 | 4580.23 | 1744 | 1691 | 418.2 |
| D | 1 | 52 | 1388672 | 3316.51 | 1744 | 1691 | 418.2 |
| D | 13 | 249 | 278760 | 662.52 | 1744 | 1691 | 418.2 |
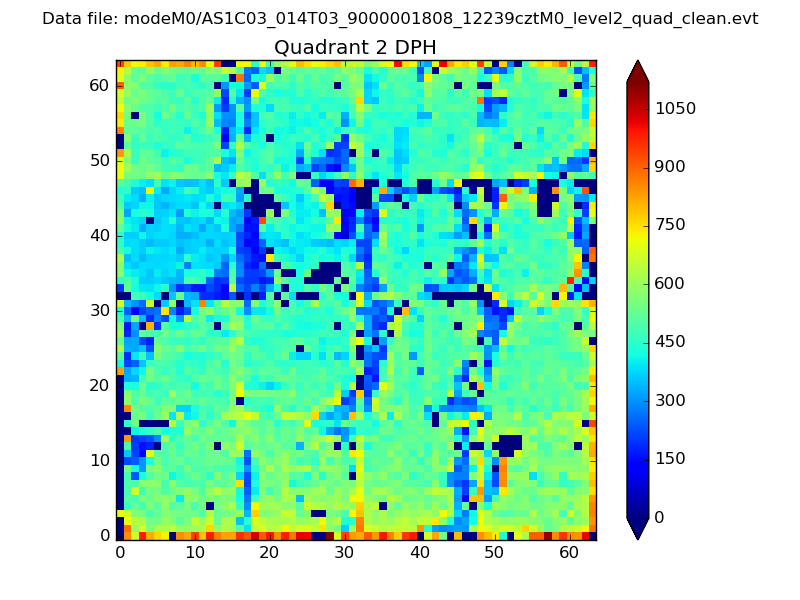
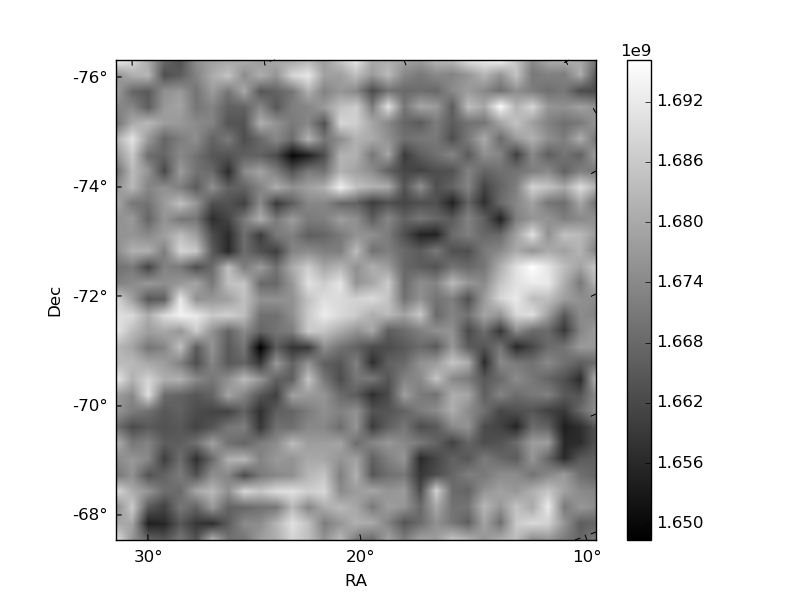
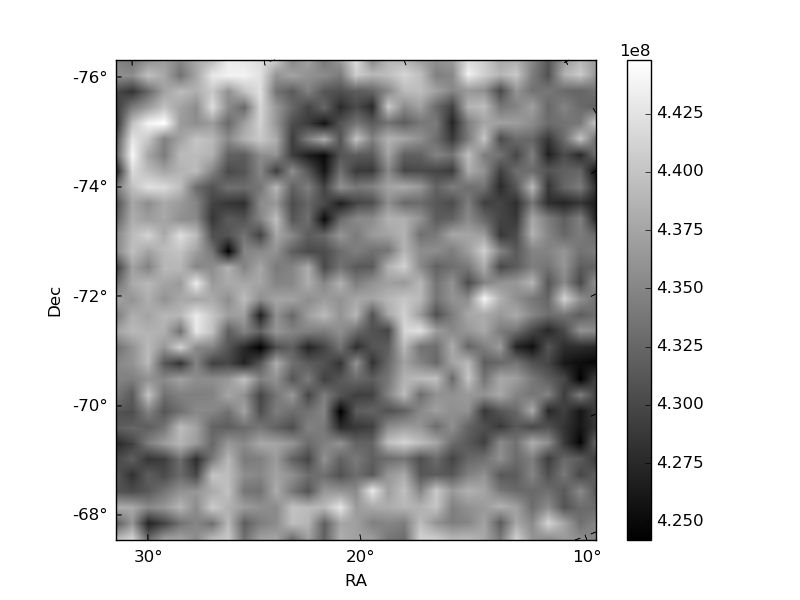
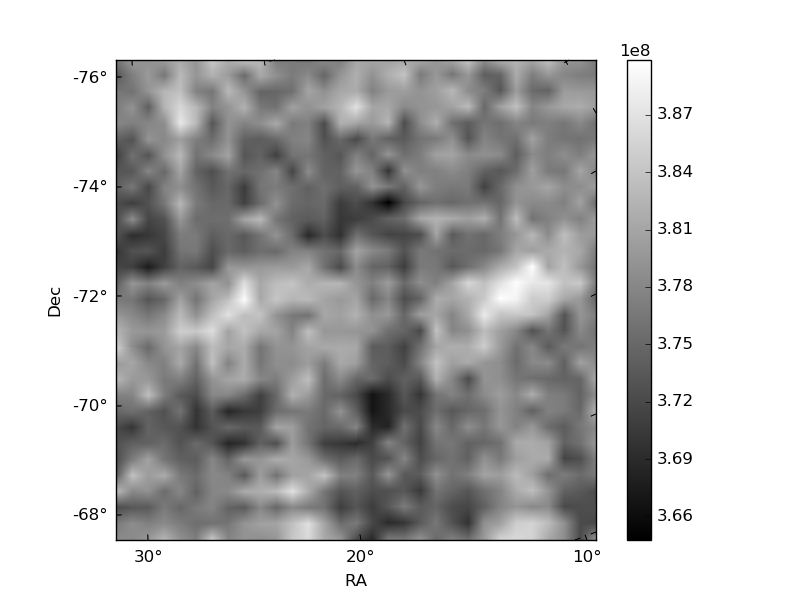
Histogram calculated using DETX and DETY for each event in the final _common_clean file
| Quadrant A | 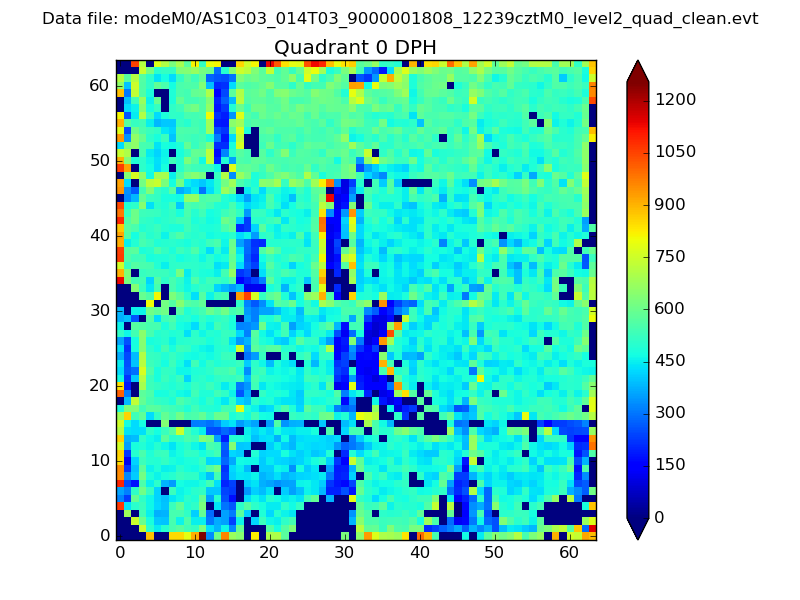 |
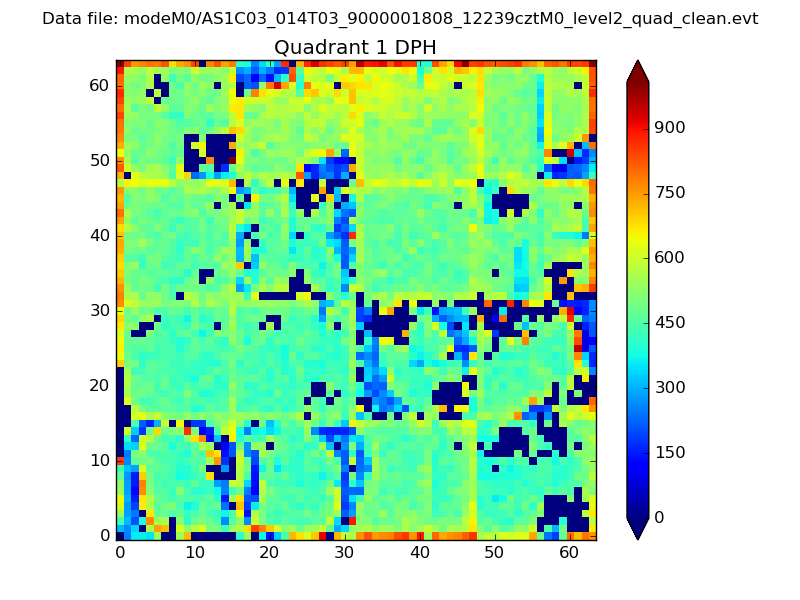 |
Quadrant B |
|---|---|---|---|
| Quadrant D | 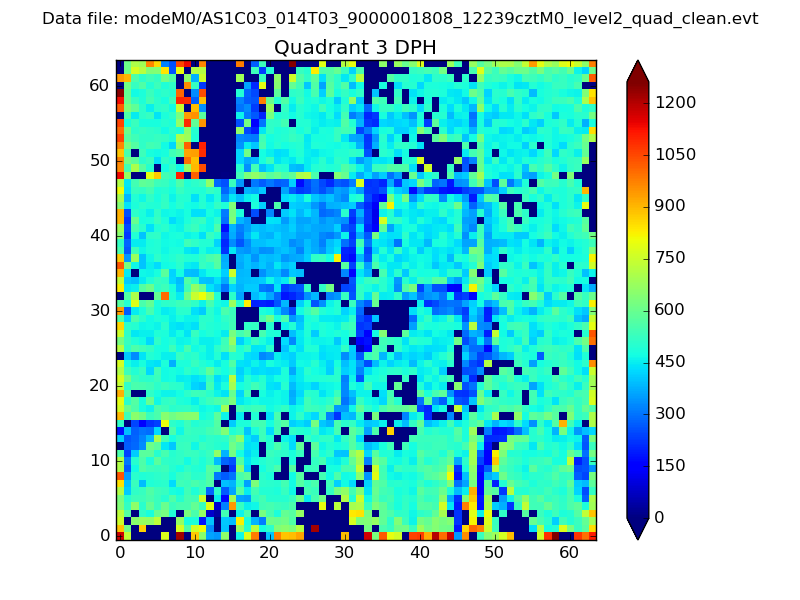 |
 |
Quadrant C |
| Plot type | Count rate plots | Images |
|---|---|---|
| Comparison with Poisson distribution Blue bars denote a histogram of data divided into 1 sec bins. Red curve is a Poisson curve with rate = median count rate of data. |
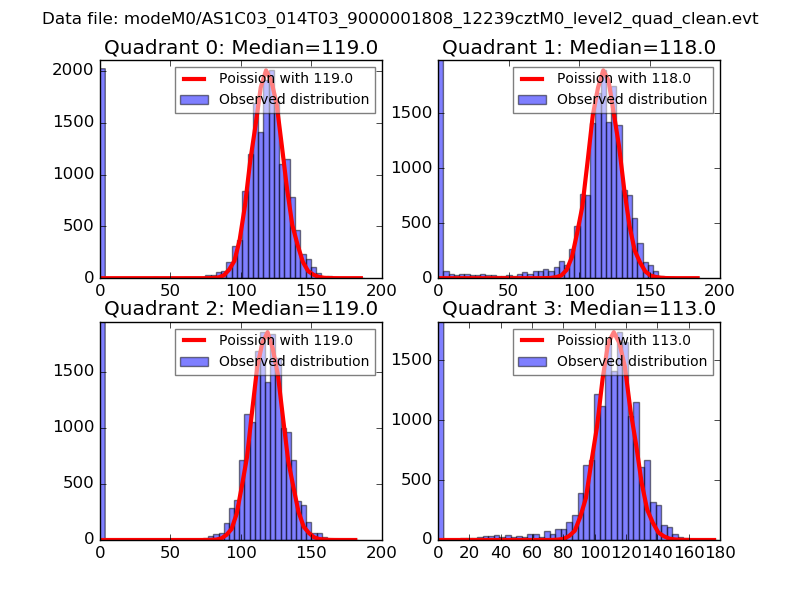 |
 |
| Quadrant-wise count rates Data is divided into 100 sec bins |
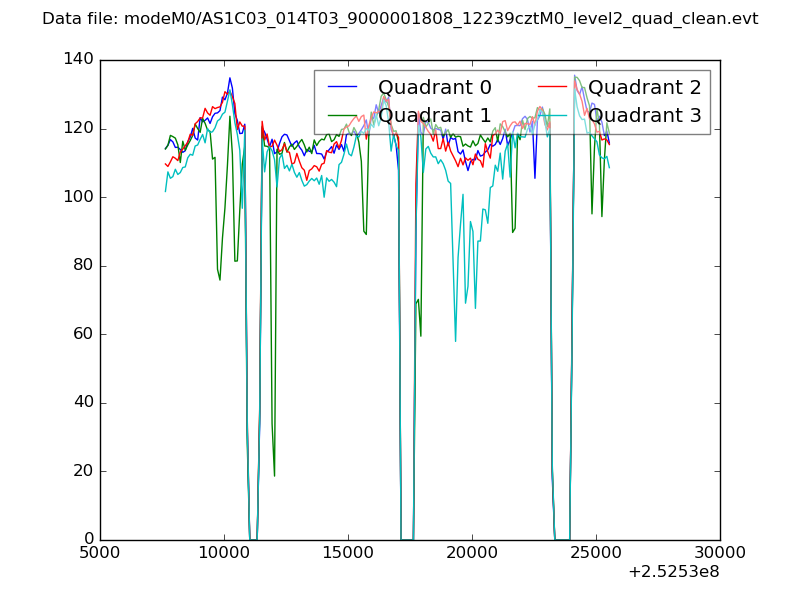 |
|
| Module-wise count rates for Quadrant A Data is divided into 100 sec bins |
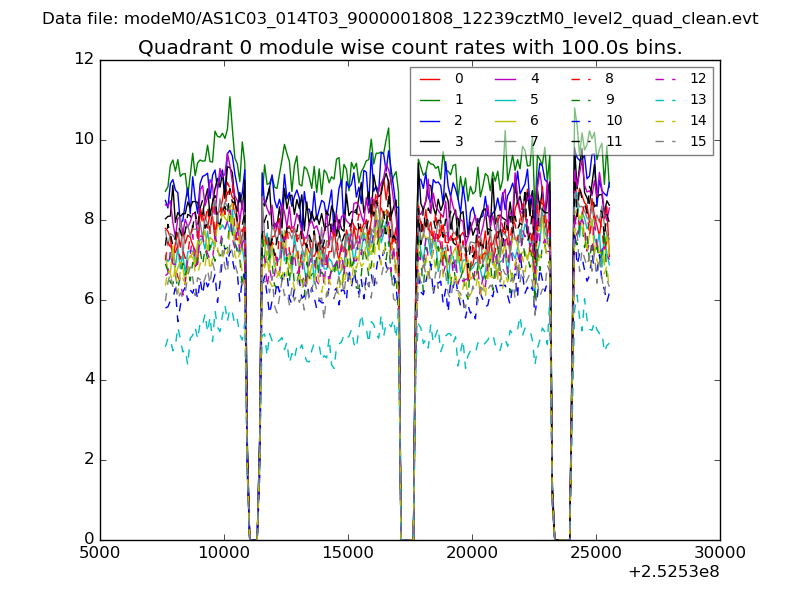 |
 |
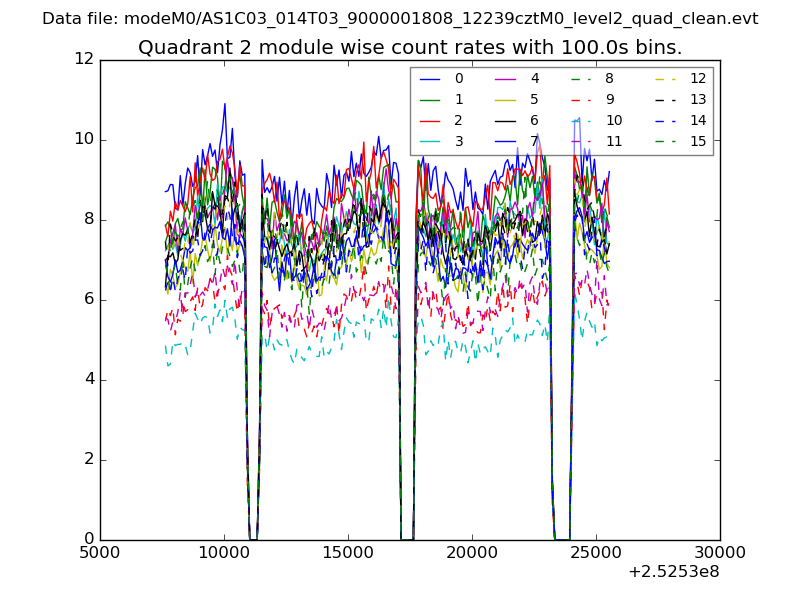
| Module-wise count rates for Quadrant B Data is divided into 100 sec bins |
 |
 |
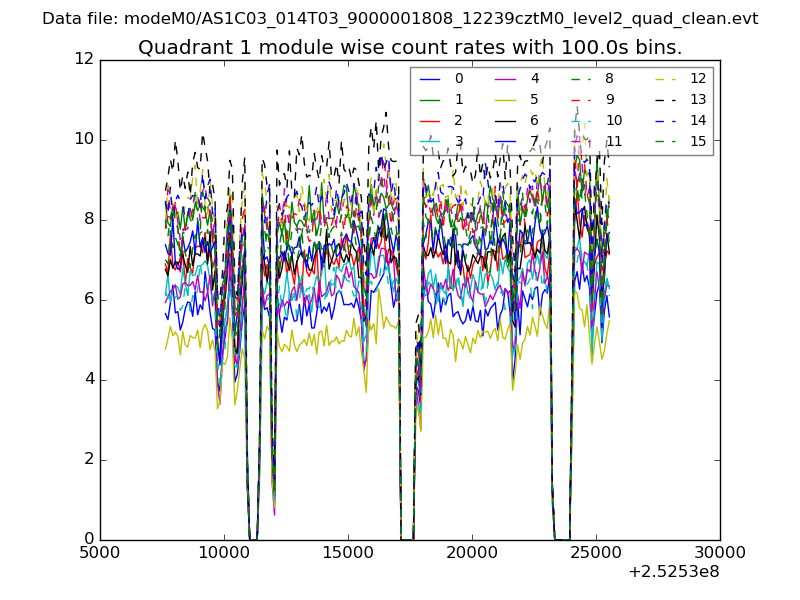
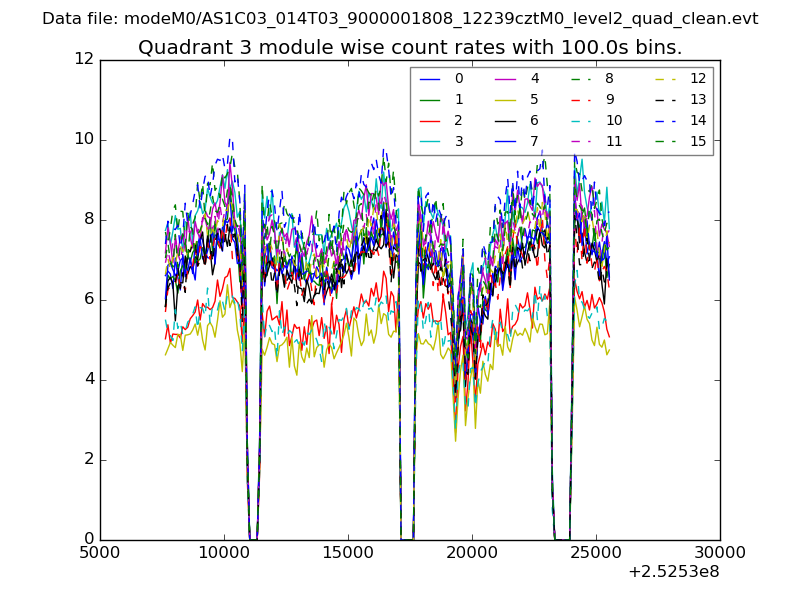
| Module-wise count rates for Quadrant C Data is divided into 100 sec bins |
 |
 |
| Module-wise count rates for Quadrant D Data is divided into 100 sec bins |
 |
 |
| Parameter | Plot |
|---|---|
| CZT HV Monitor | 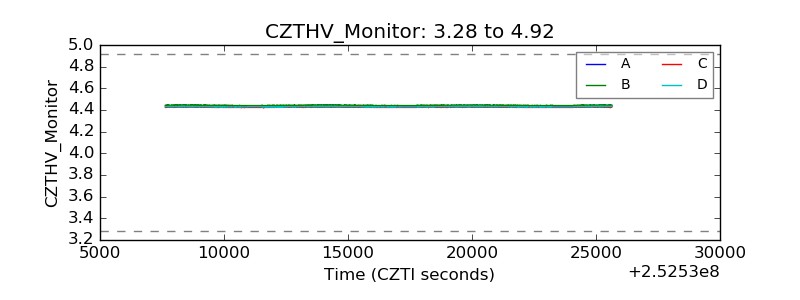 |
| D_VDD | 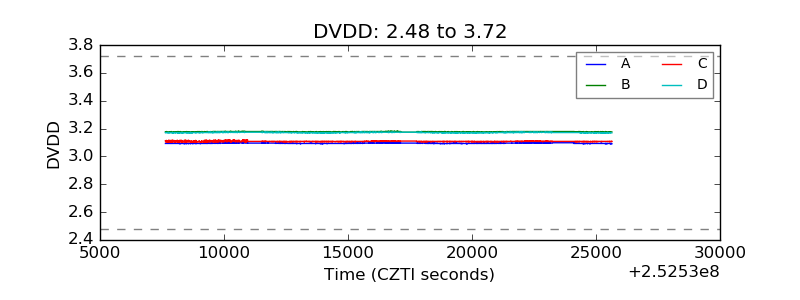 |
| Temperature 1 | 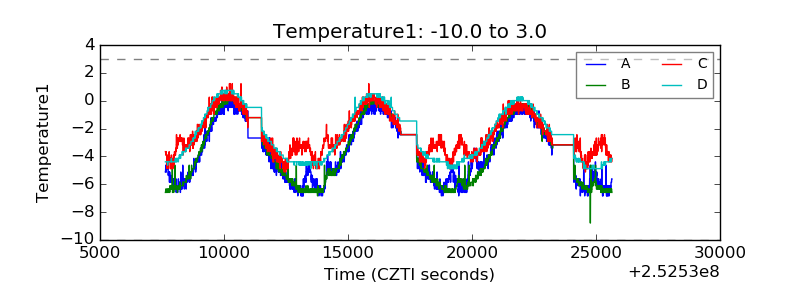 |
| Veto HV Monitor | 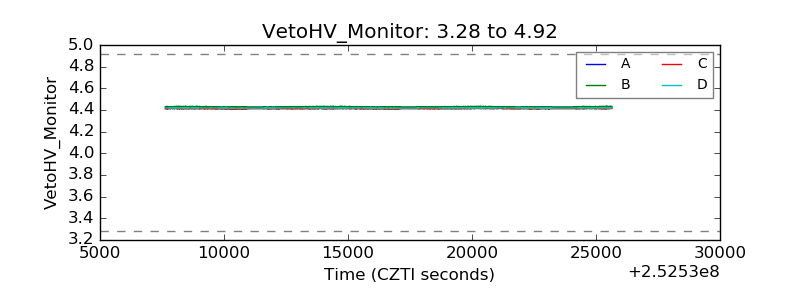 |
| Veto LLD | 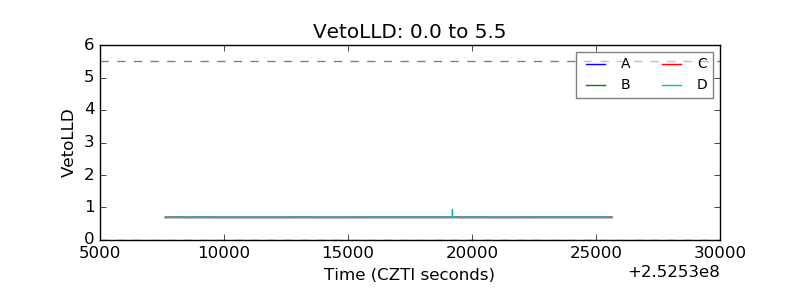 |
| Alpha Counter | 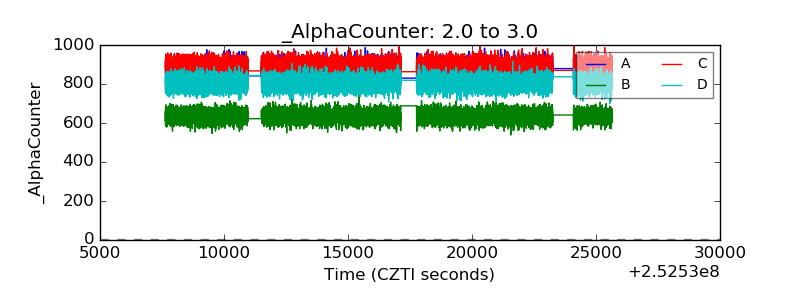 |
| _CPM_Rate | 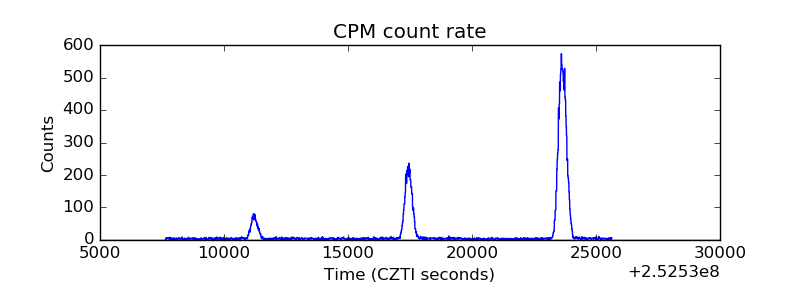 |
| CZT Counter | 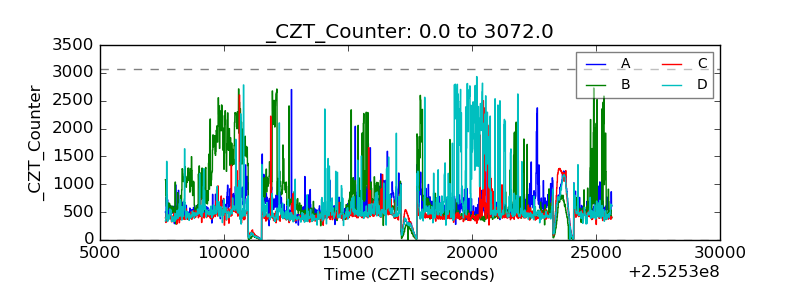 |
| +2.5 Volts monitor | 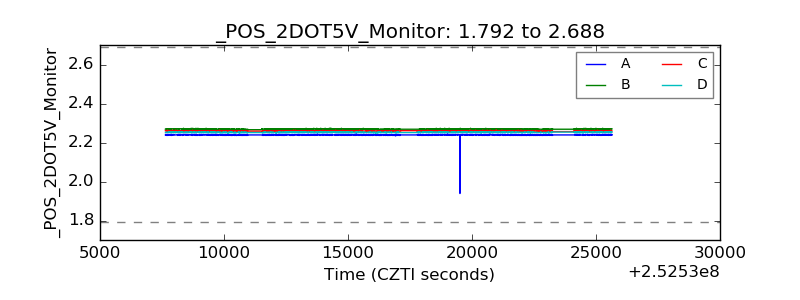 |
| +5 Volts monitor |  |
| _ROLL_ROT | 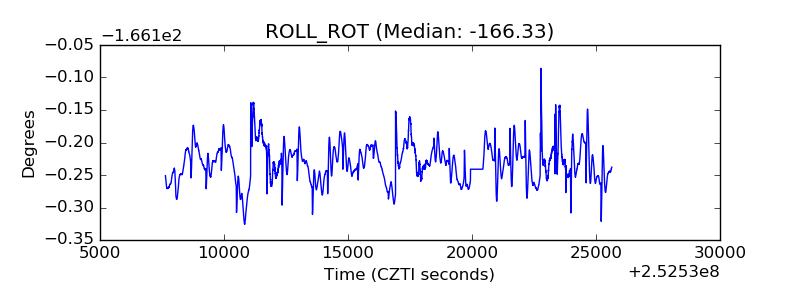 |
| _Roll_DEC | 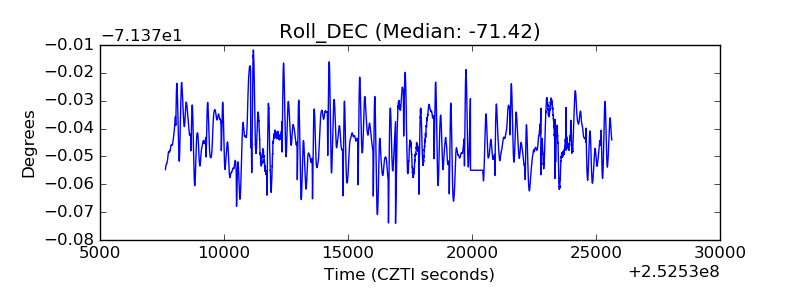 |
| _Roll_RA |  |
| Veto Counter | 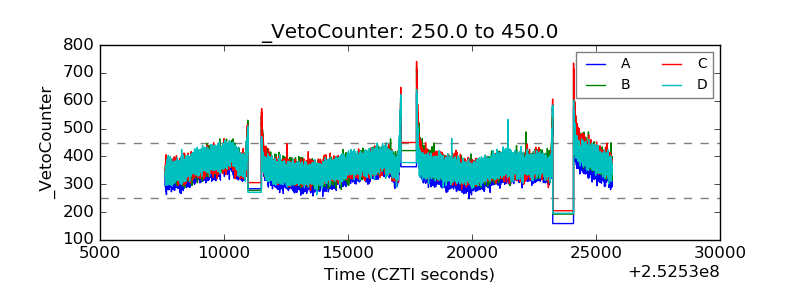 |