| Param | Original file | Final file |
|---|---|---|
| Filename | modeM0/AS1C03_014T03_9000001808_12240cztM0_level2.evt | modeM0/AS1C03_014T03_9000001808_12240cztM0_level2_quad_clean.evt |
| Size (bytes) | 475,718,400 | 114,796,800 |
| Size | 453.7 MB | 109.5 MB |
| Events in quadrant A | 3,896,334 | 765,198 |
| Events in quadrant B | 4,056,293 | 767,232 |
| Events in quadrant C | 2,917,329 | 768,870 |
| Events in quadrant D | 3,113,373 | 739,927 |
| Mode M0 | |||
|---|---|---|---|
| Quadrant | BADHDUFLAG | Total packets | Discarded packets |
| A | 0 | 15676 | 2 |
| B | 0 | 16086 | 1 |
| C | 0 | 13067 | 1 |
| D | 0 | 13585 | 1 |
| Mode M9 | |||
|---|---|---|---|
| Quadrant | BADHDUFLAG | Total packets | Discarded packets |
| A | 0 | 9 | 0 |
| B | 0 | 9 | 0 |
| C | 0 | 9 | 0 |
| D | 0 | 9 | 0 |
| Mode SS | |||
|---|---|---|---|
| Quadrant | BADHDUFLAG | Total packets | Discarded packets |
| A | 0 | 128 | 0 |
| B | 0 | 128 | 0 |
| C | 0 | 128 | 0 |
| D | 0 | 128 | 0 |
| Quadrant | Total seconds | Saturated seconds | Saturation percentage |
|---|---|---|---|
| A | 6234 | 162 | 2.598653% |
| B | 6234 | 370 | 5.935194% |
| C | 6234 | 79 | 1.267244% |
| D | 6234 | 79 | 1.267244% |
Noise dominated data is calculated using 1-second bins in cleaned event files. If a bin has >2000 counts, and if more than 50% of those come from <1% of pixels, then it is considered to be noise-dominated and hence unusable.
| Quadrant | # 1 sec bins | Bins with >0 counts | Bins with >2000 counts | High rate bins dominated by noise | Noise dominated (total time) | Noise dominated (detector-on time) | Marked lightcurve |
|---|---|---|---|---|---|---|---|
| A | 7190 | 6236 | 35 | 35 | 0.49% | 0.56% | 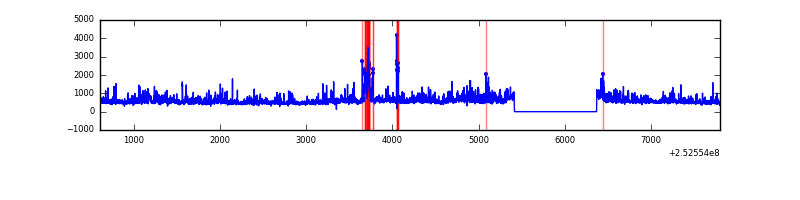 |
| B | 7190 | 6236 | 191 | 191 | 2.66% | 3.06% | 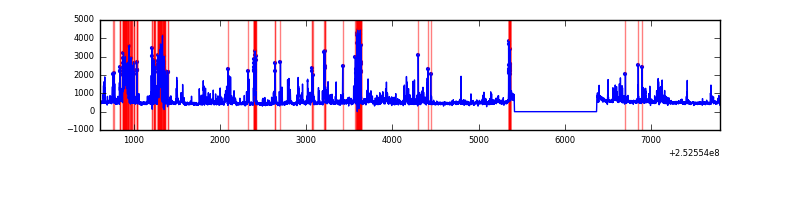 |
| C | 7190 | 6236 | 19 | 19 | 0.26% | 0.30% | 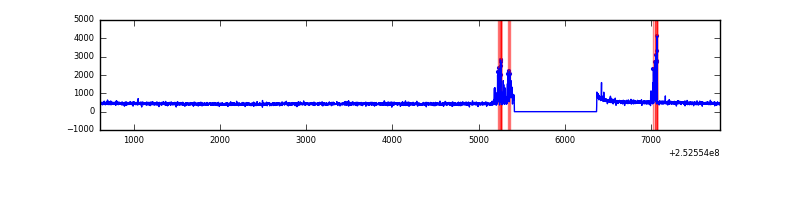 |
| D | 7190 | 6236 | 23 | 23 | 0.32% | 0.37% | 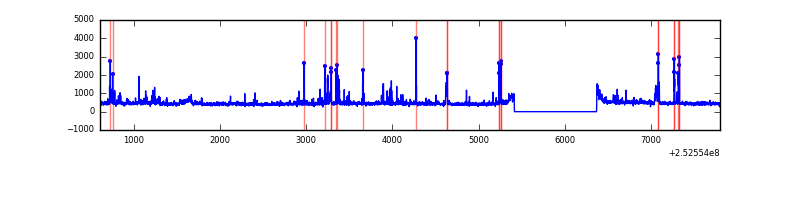 |
Top three noisy pixels from each quadrant. If the there are fewer than three noisy pixels in the level2.evt file, extra rows are filled as -1
| Pixel properties | Quadrant properties | ||||||
|---|---|---|---|---|---|---|---|
| Quadrant | DetID | PixID | Counts | Sigma | Mean | Median | Sigma |
| A | 13 | 251 | 527698 | 3585.88 | 722 | 707 | 147.0 |
| A | 1 | 162 | 150983 | 1022.54 | 722 | 707 | 147.0 |
| A | 5 | 16 | 134431 | 909.92 | 722 | 707 | 147.0 |
| B | 4 | 239 | 622101 | 4619.79 | 716 | 698 | 134.5 |
| B | 3 | 64 | 484048 | 3593.44 | 716 | 698 | 134.5 |
| B | 11 | 51 | 70823 | 521.34 | 716 | 698 | 134.5 |
| C | 15 | 208 | 139098 | 845.17 | 710 | 713 | 163.7 |
| C | 13 | 61 | 5142 | 27.05 | 710 | 713 | 163.7 |
| C | 4 | 175 | 4885 | 25.48 | 710 | 713 | 163.7 |
| D | 10 | 199 | 112838 | 669.23 | 705 | 683 | 167.6 |
| D | 2 | 33 | 88675 | 525.05 | 705 | 683 | 167.6 |
| D | 13 | 249 | 53985 | 318.05 | 705 | 683 | 167.6 |
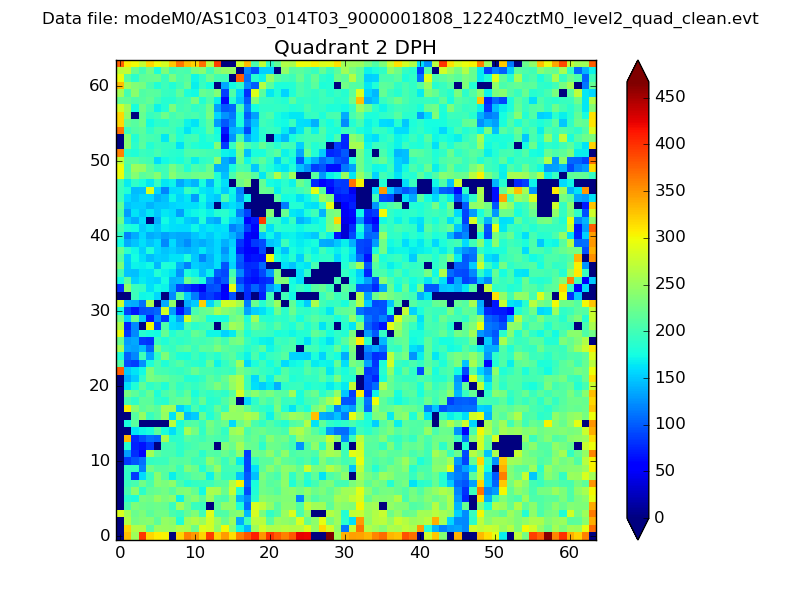
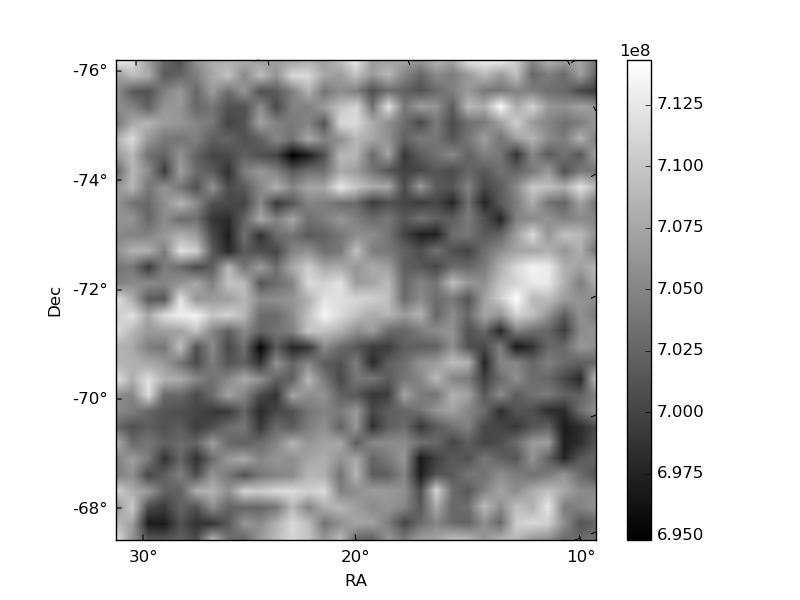
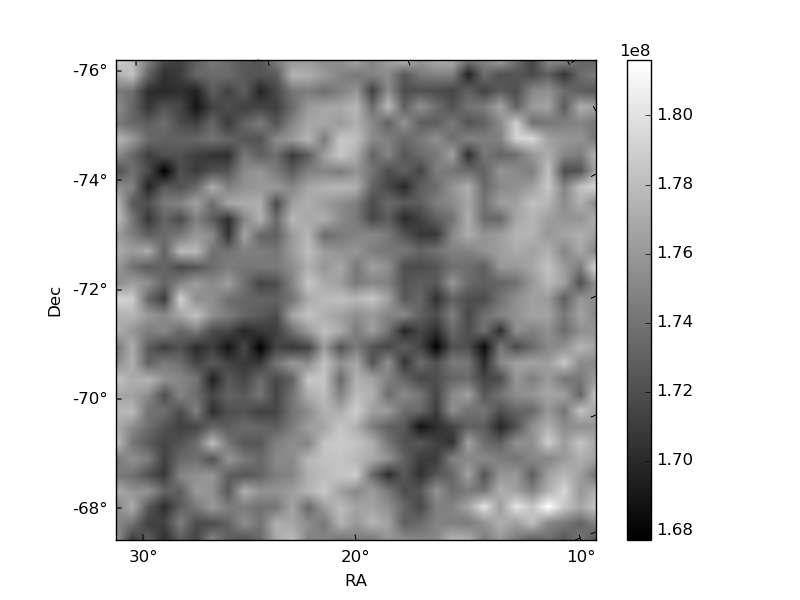
Histogram calculated using DETX and DETY for each event in the final _common_clean file
| Quadrant A | 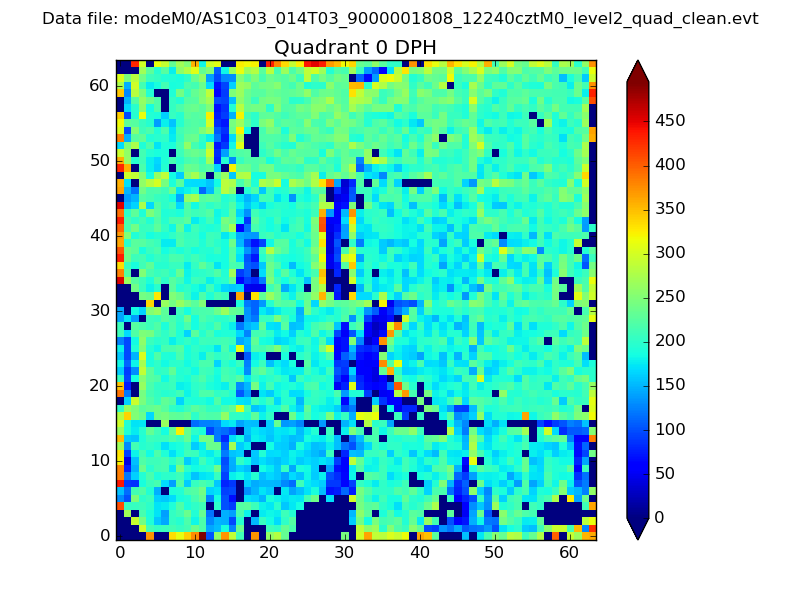 |
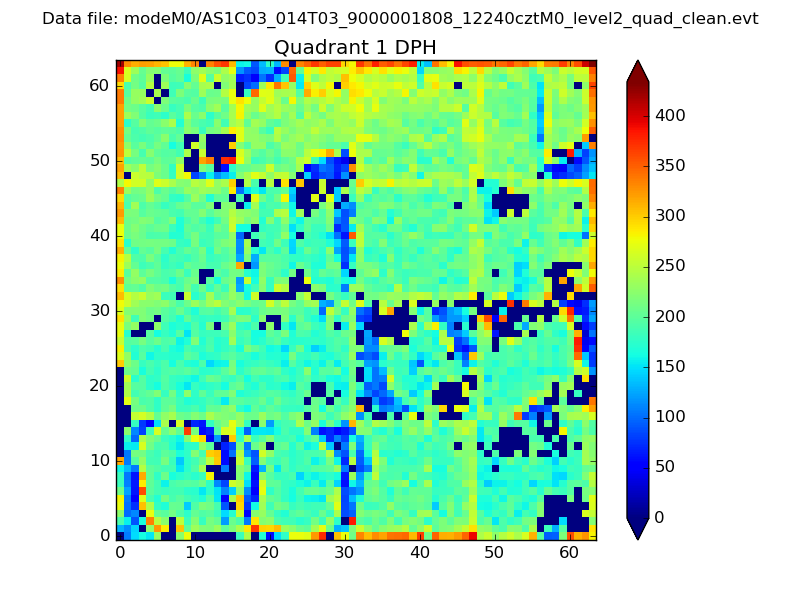 |
Quadrant B |
|---|---|---|---|
| Quadrant D | 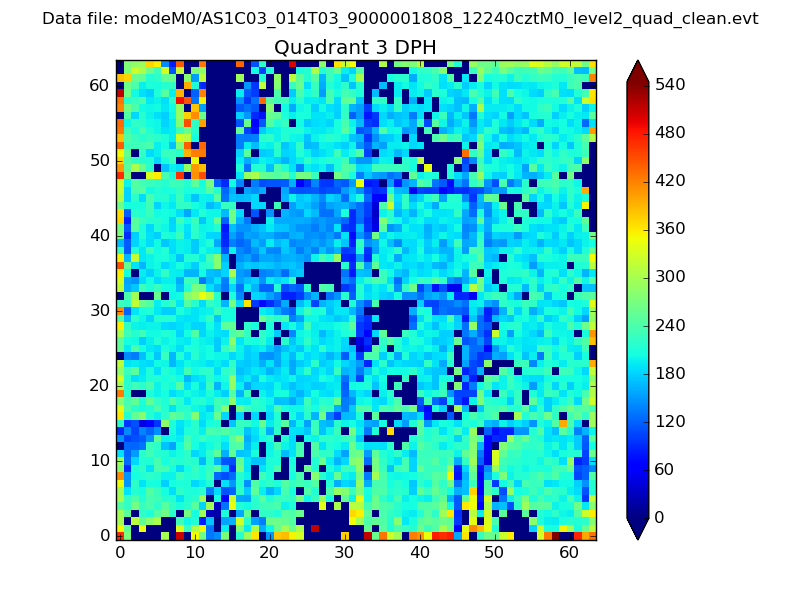 |
 |
Quadrant C |
| Plot type | Count rate plots | Images |
|---|---|---|
| Comparison with Poisson distribution Blue bars denote a histogram of data divided into 1 sec bins. Red curve is a Poisson curve with rate = median count rate of data. |
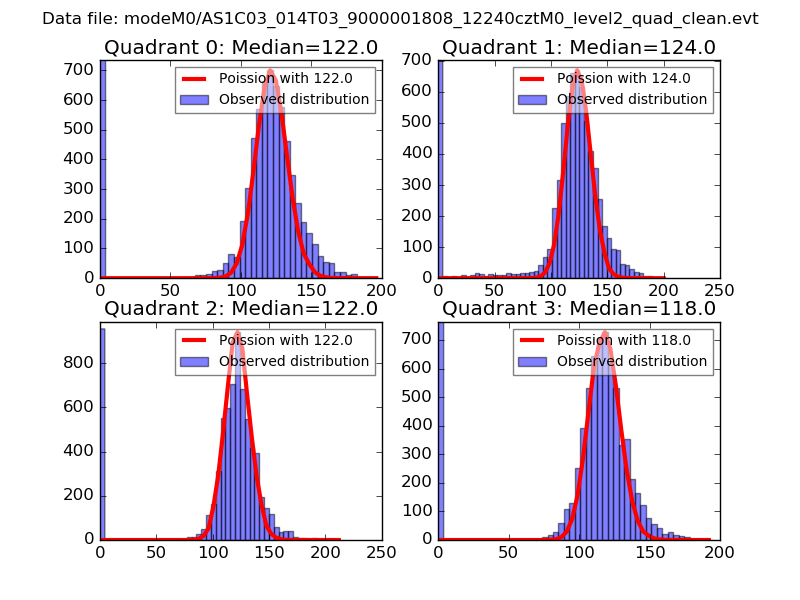 |
 |
| Quadrant-wise count rates Data is divided into 100 sec bins |
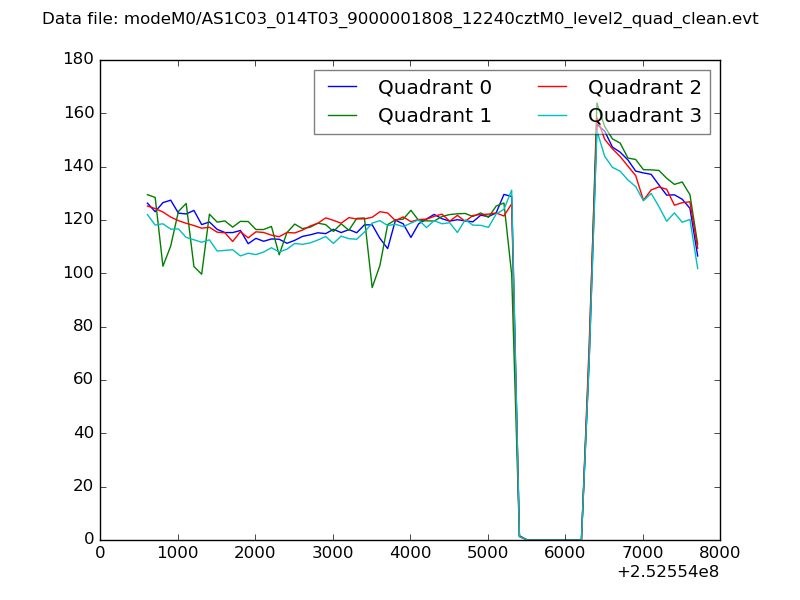 |
|
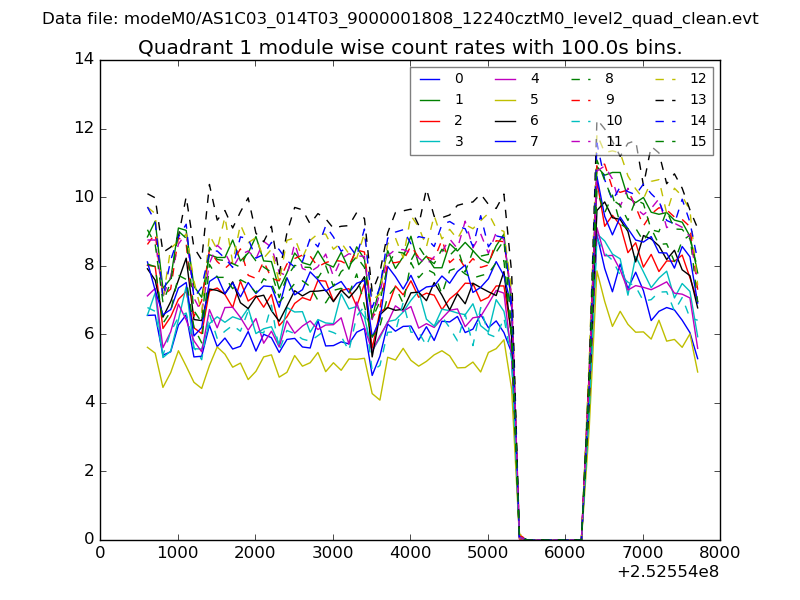
| Module-wise count rates for Quadrant A Data is divided into 100 sec bins |
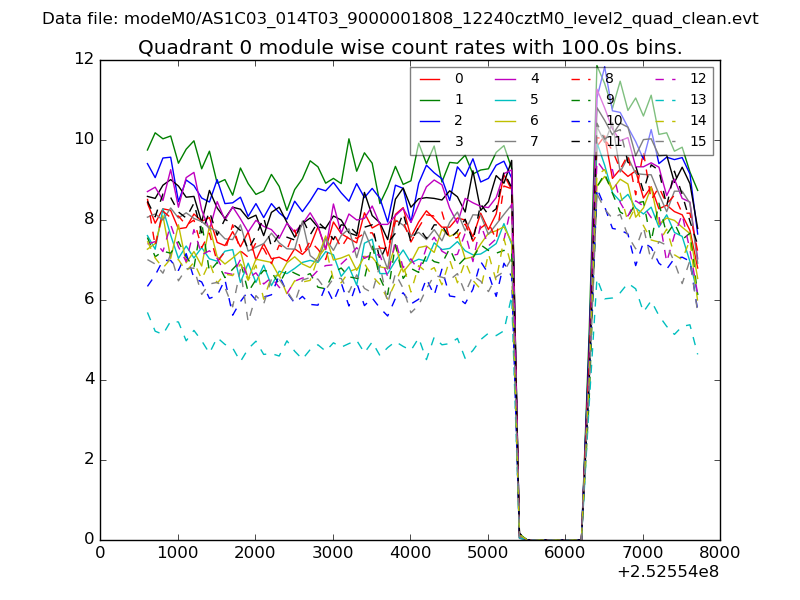 |
 |
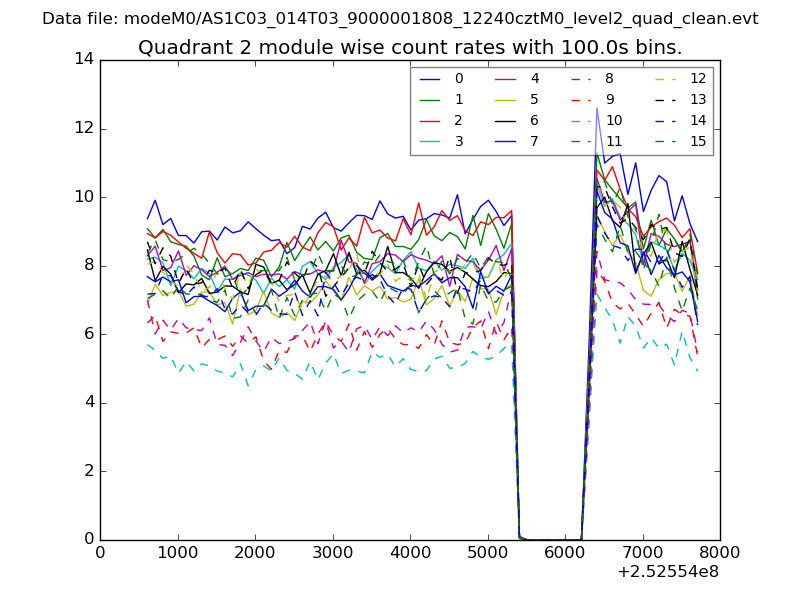
| Module-wise count rates for Quadrant B Data is divided into 100 sec bins |
 |
 |
| Module-wise count rates for Quadrant C Data is divided into 100 sec bins |
 |
 |
| Module-wise count rates for Quadrant D Data is divided into 100 sec bins |
 |
 |
| Parameter | Plot |
|---|---|
| CZT HV Monitor | 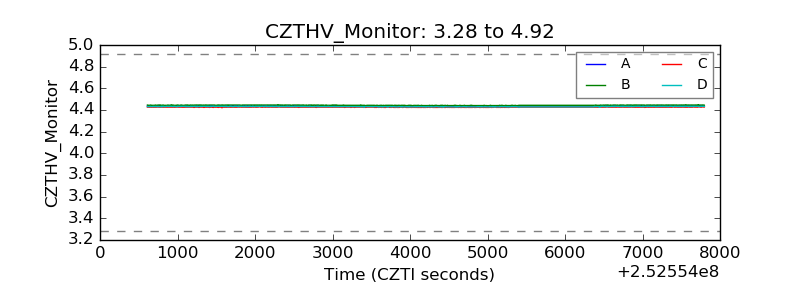 |
| D_VDD | 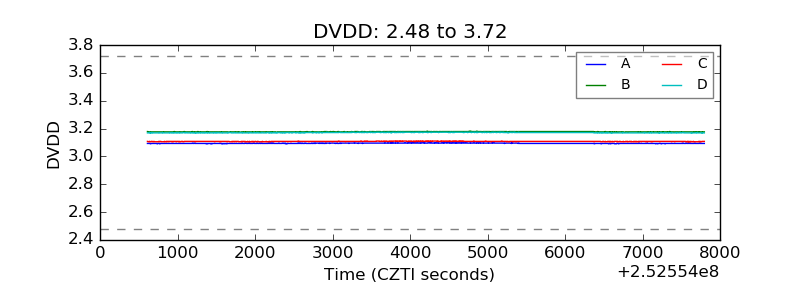 |
| Temperature 1 | 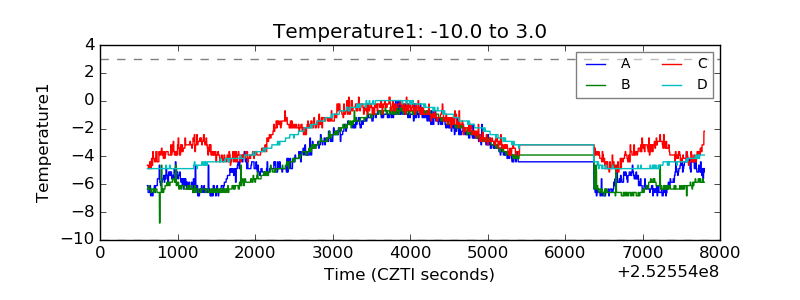 |
| Veto HV Monitor | 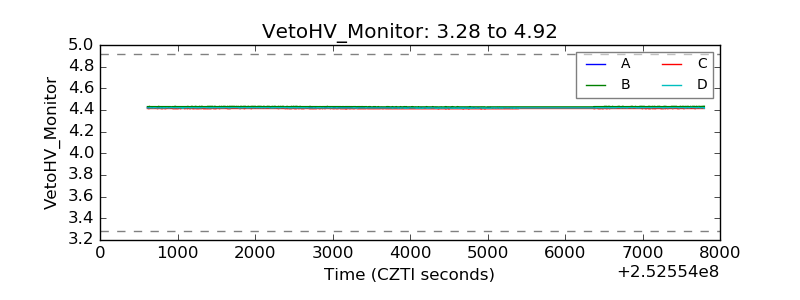 |
| Veto LLD | 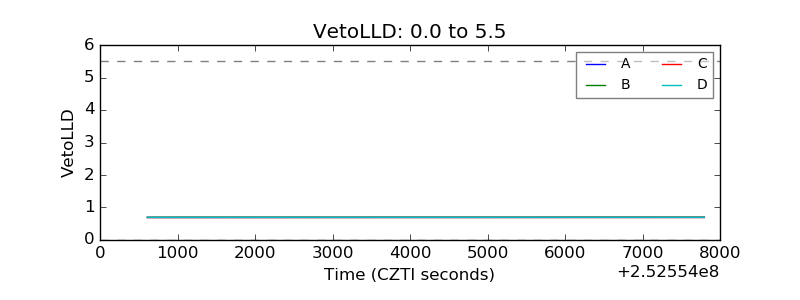 |
| Alpha Counter | 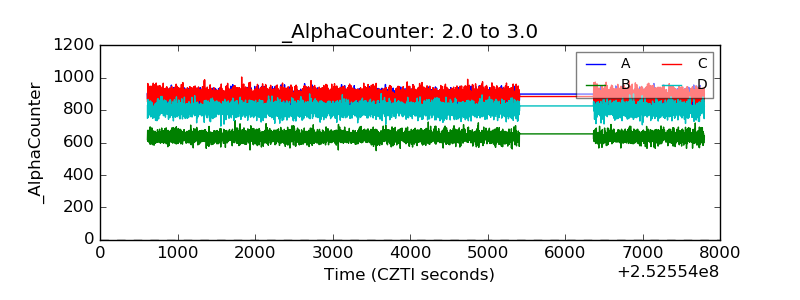 |
| _CPM_Rate | 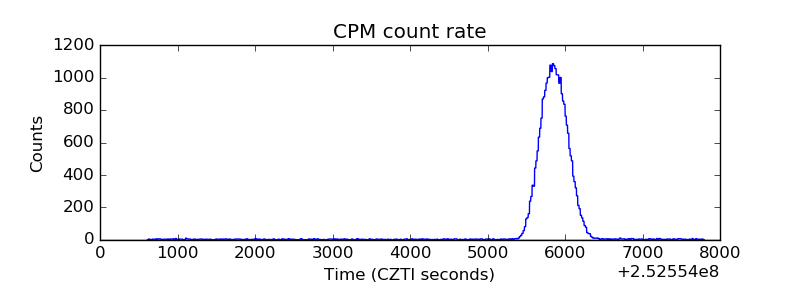 |
| CZT Counter | 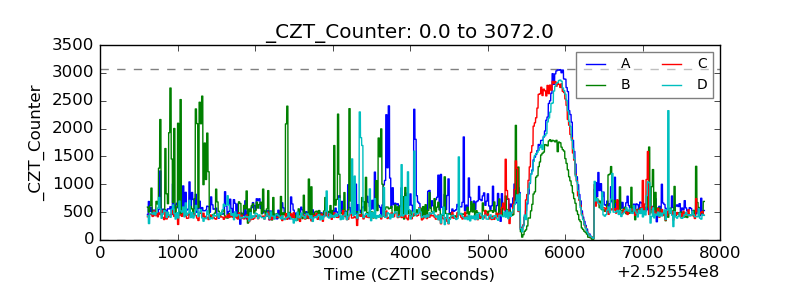 |
| +2.5 Volts monitor |  |
| +5 Volts monitor |  |
| _ROLL_ROT | 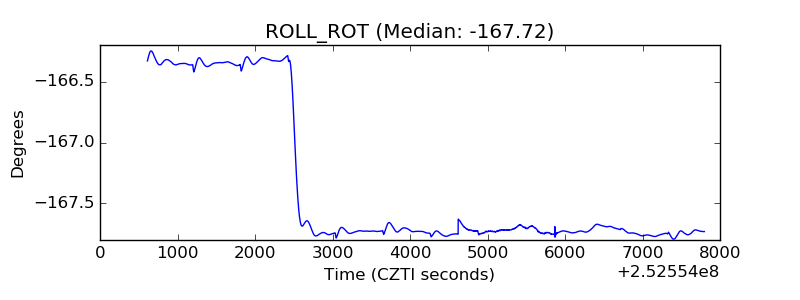 |
| _Roll_DEC | 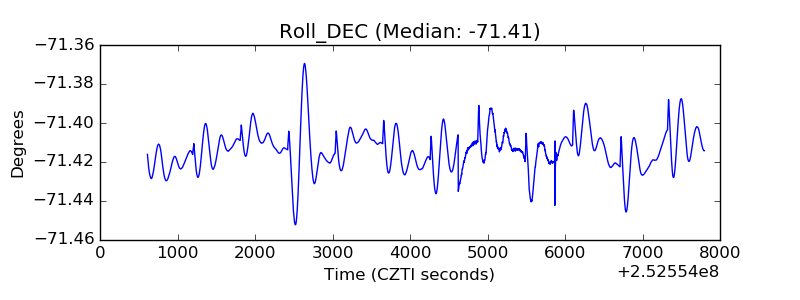 |
| _Roll_RA | 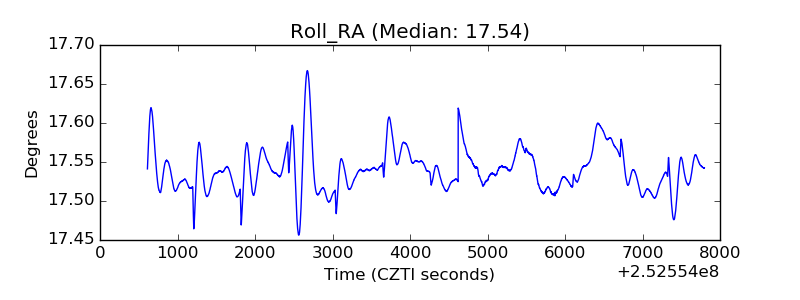 |
| Veto Counter | 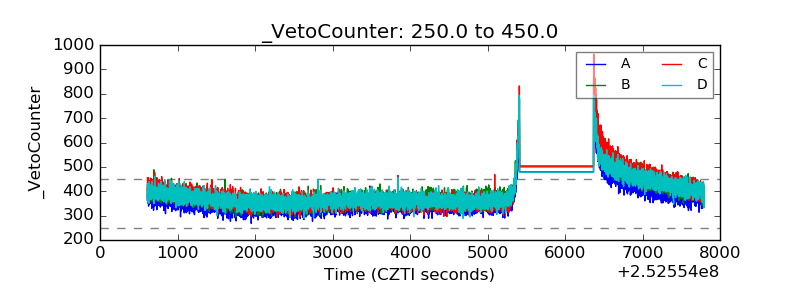 |