| Param | Original file | Final file |
|---|---|---|
| Filename | modeM0/AS1C03_014T03_9000001808_12242cztM0_level2.evt | modeM0/AS1C03_014T03_9000001808_12242cztM0_level2_quad_clean.evt |
| Size (bytes) | 491,630,400 | 124,257,600 |
| Size | 468.9 MB | 118.5 MB |
| Events in quadrant A | 3,863,189 | 832,981 |
| Events in quadrant B | 3,877,710 | 845,740 |
| Events in quadrant C | 3,159,676 | 842,388 |
| Events in quadrant D | 3,555,076 | 796,838 |
| Mode M0 | |||
|---|---|---|---|
| Quadrant | BADHDUFLAG | Total packets | Discarded packets |
| A | 0 | 15707 | 2 |
| B | 0 | 15661 | 1 |
| C | 0 | 13666 | 1 |
| D | 0 | 14832 | 1 |
| Mode M9 | |||
|---|---|---|---|
| Quadrant | BADHDUFLAG | Total packets | Discarded packets |
| A | 0 | 11 | 0 |
| B | 0 | 11 | 0 |
| C | 0 | 11 | 0 |
| D | 0 | 11 | 0 |
| Mode SS | |||
|---|---|---|---|
| Quadrant | BADHDUFLAG | Total packets | Discarded packets |
| A | 0 | 128 | 0 |
| B | 0 | 128 | 0 |
| C | 0 | 128 | 0 |
| D | 0 | 128 | 0 |
| Quadrant | Total seconds | Saturated seconds | Saturation percentage |
|---|---|---|---|
| A | 6390 | 124 | 1.940532% |
| B | 6390 | 259 | 4.053208% |
| C | 6390 | 92 | 1.439750% |
| D | 6390 | 215 | 3.364632% |
Noise dominated data is calculated using 1-second bins in cleaned event files. If a bin has >2000 counts, and if more than 50% of those come from <1% of pixels, then it is considered to be noise-dominated and hence unusable.
| Quadrant | # 1 sec bins | Bins with >0 counts | Bins with >2000 counts | High rate bins dominated by noise | Noise dominated (total time) | Noise dominated (detector-on time) | Marked lightcurve |
|---|---|---|---|---|---|---|---|
| A | 7471 | 6392 | 3 | 3 | 0.04% | 0.05% | 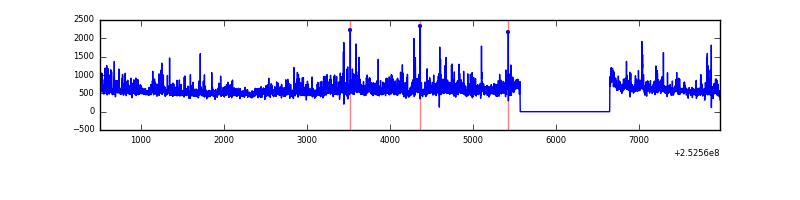 |
| B | 7471 | 6392 | 106 | 106 | 1.42% | 1.66% | 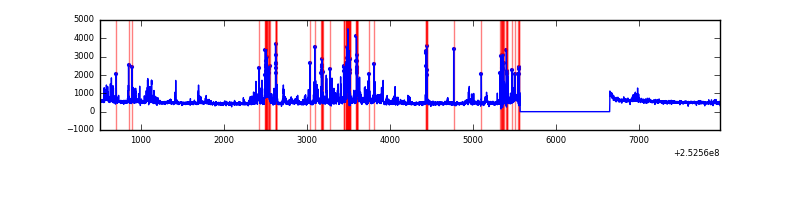 |
| C | 7471 | 6392 | 15 | 15 | 0.20% | 0.23% | 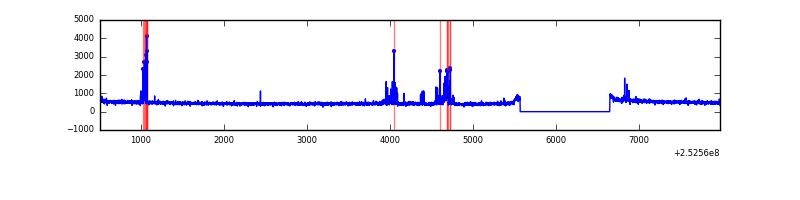 |
| D | 7471 | 6392 | 76 | 76 | 1.02% | 1.19% | 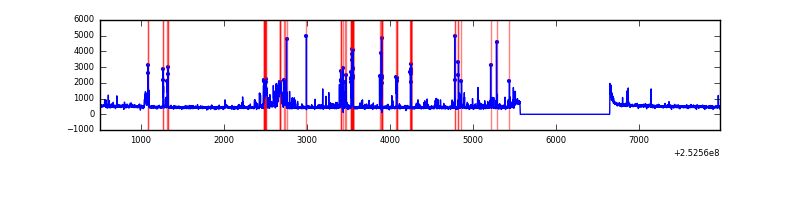 |
Top three noisy pixels from each quadrant. If the there are fewer than three noisy pixels in the level2.evt file, extra rows are filled as -1
| Pixel properties | Quadrant properties | ||||||
|---|---|---|---|---|---|---|---|
| Quadrant | DetID | PixID | Counts | Sigma | Mean | Median | Sigma |
| A | 13 | 251 | 419682 | 2684.25 | 771 | 756 | 156.1 |
| A | 1 | 162 | 165888 | 1058.07 | 771 | 756 | 156.1 |
| A | 1 | 178 | 93388 | 593.53 | 771 | 756 | 156.1 |
| B | 4 | 239 | 543005 | 3791.2 | 767 | 750 | 143.0 |
| B | 3 | 64 | 176123 | 1226.13 | 767 | 750 | 143.0 |
| B | 11 | 51 | 84324 | 584.31 | 767 | 750 | 143.0 |
| C | 15 | 208 | 184964 | 1062.63 | 759 | 762 | 173.3 |
| C | 4 | 175 | 14509 | 79.3 | 759 | 762 | 173.3 |
| C | 13 | 61 | 5530 | 27.51 | 759 | 762 | 173.3 |
| D | 10 | 199 | 359836 | 2019.77 | 749 | 729 | 177.8 |
| D | 13 | 104 | 92228 | 514.63 | 749 | 729 | 177.8 |
| D | 2 | 14 | 57237 | 317.82 | 749 | 729 | 177.8 |
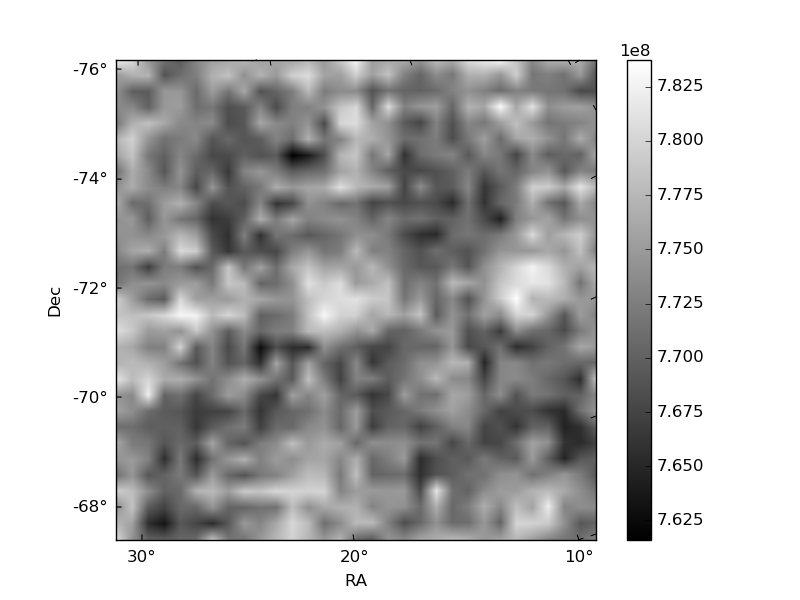
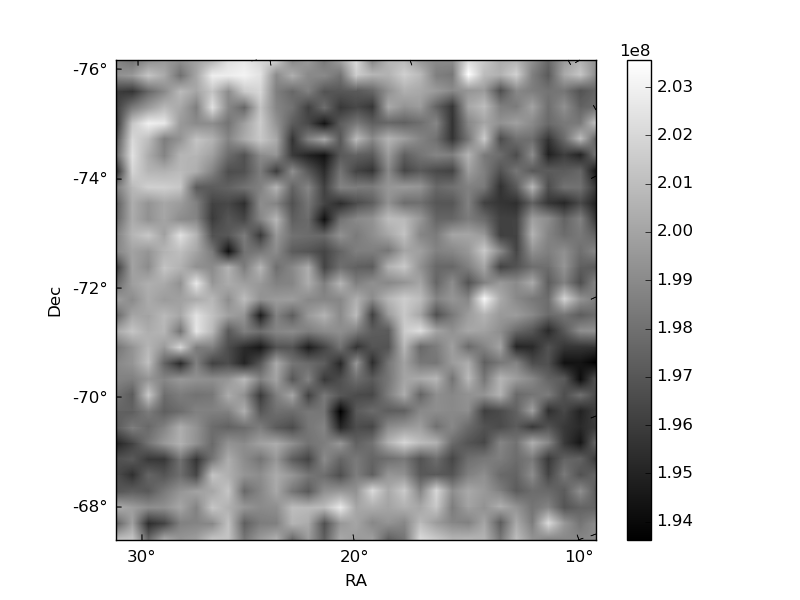
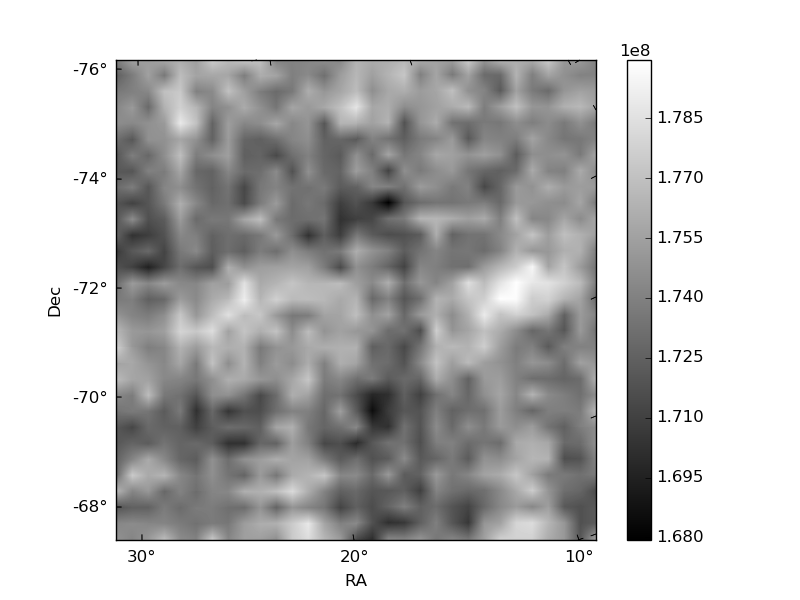
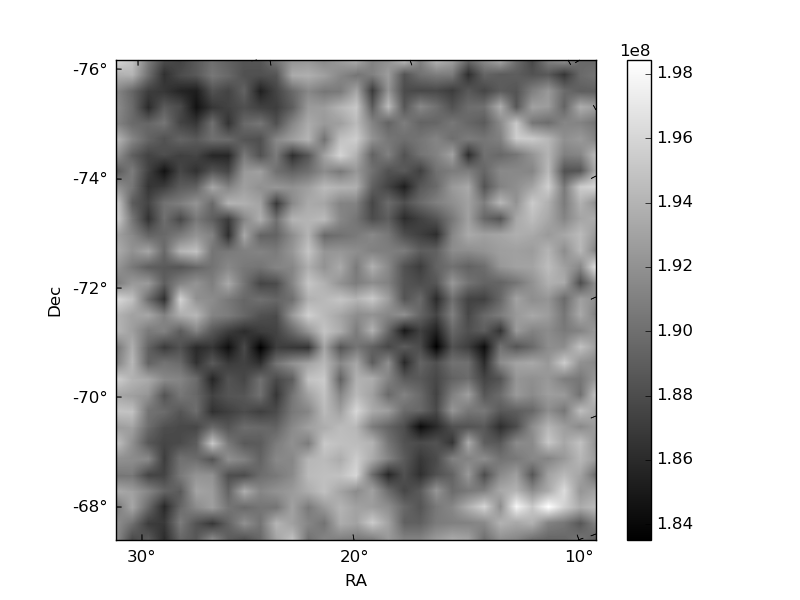
Histogram calculated using DETX and DETY for each event in the final _common_clean file
| Quadrant A | 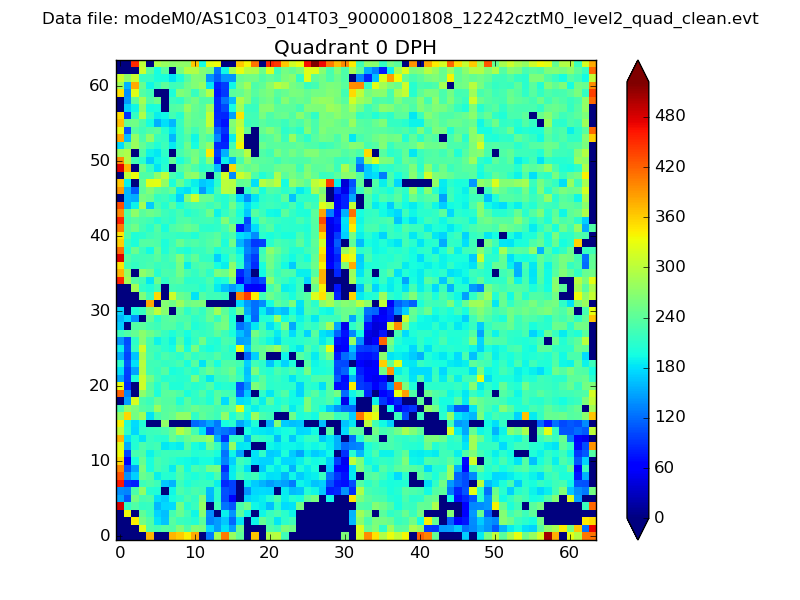 |
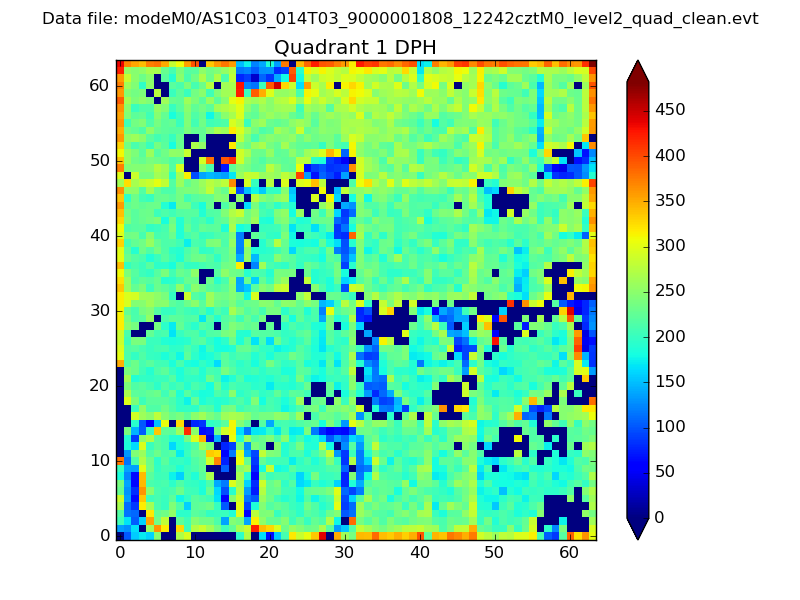 |
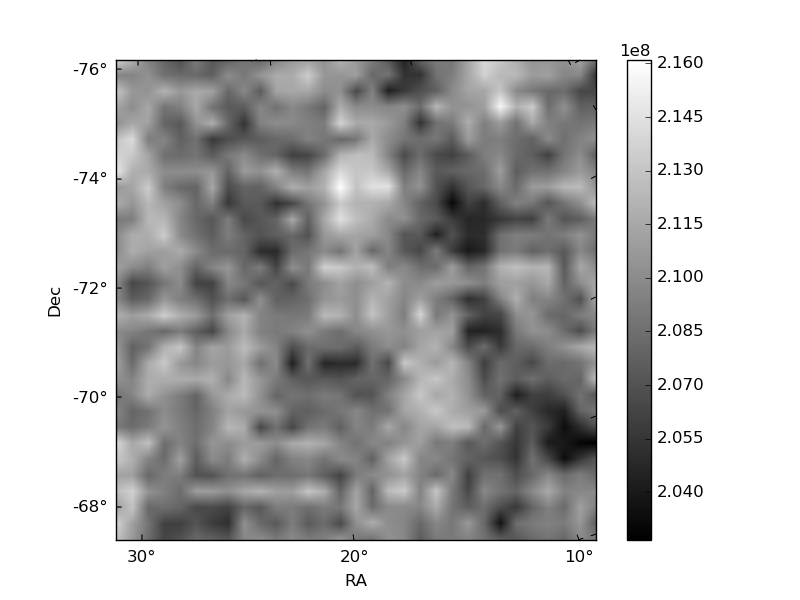
Quadrant B |
|---|---|---|---|
| Quadrant D | 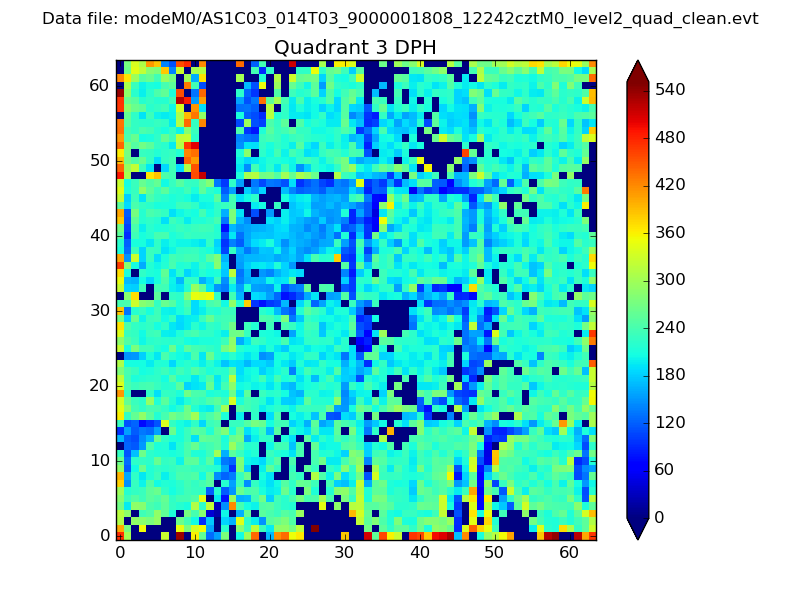 |
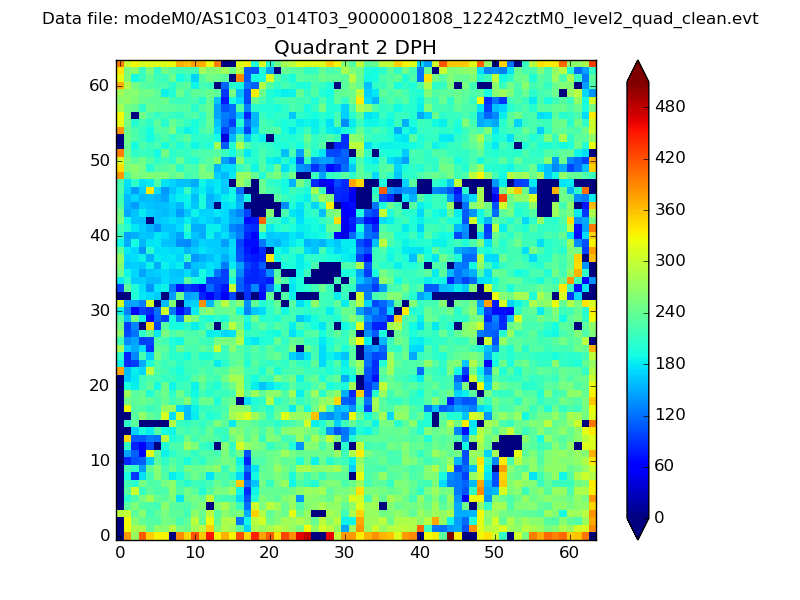 |
Quadrant C |
| Plot type | Count rate plots | Images |
|---|---|---|
| Comparison with Poisson distribution Blue bars denote a histogram of data divided into 1 sec bins. Red curve is a Poisson curve with rate = median count rate of data. |
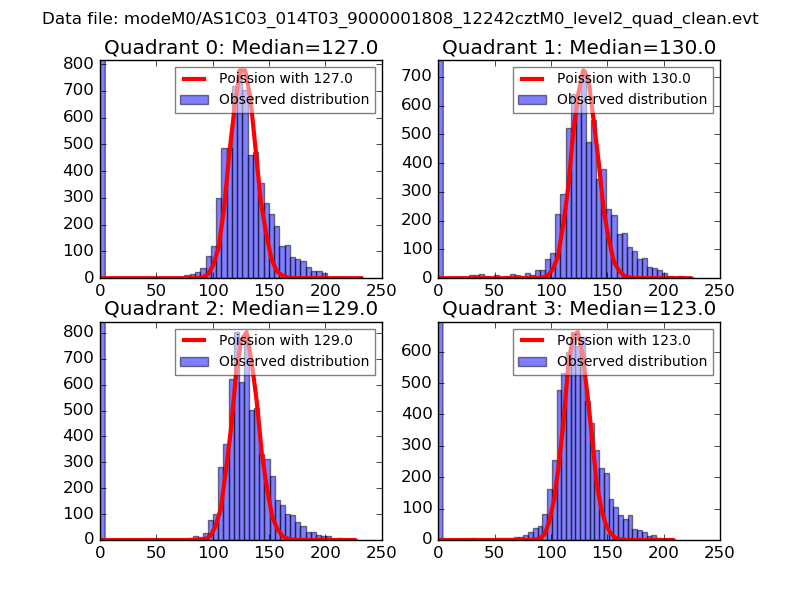 |
 |
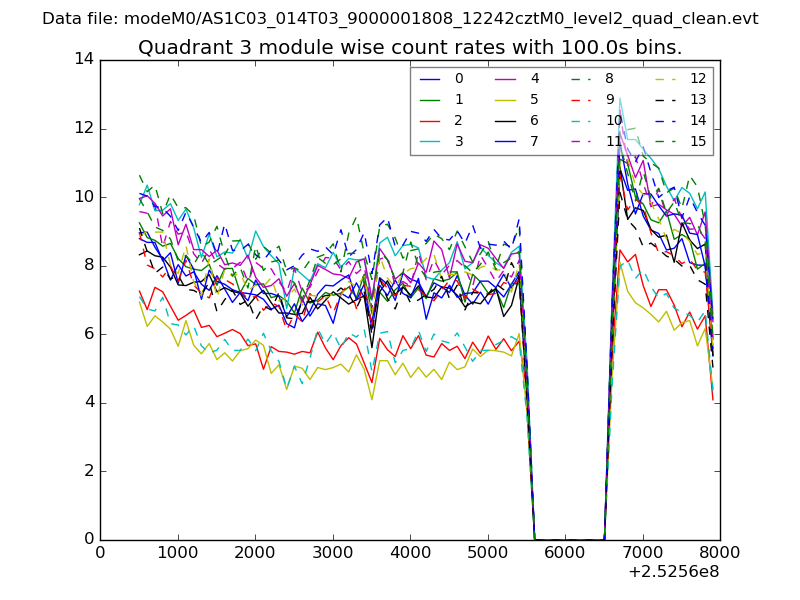
| Quadrant-wise count rates Data is divided into 100 sec bins |
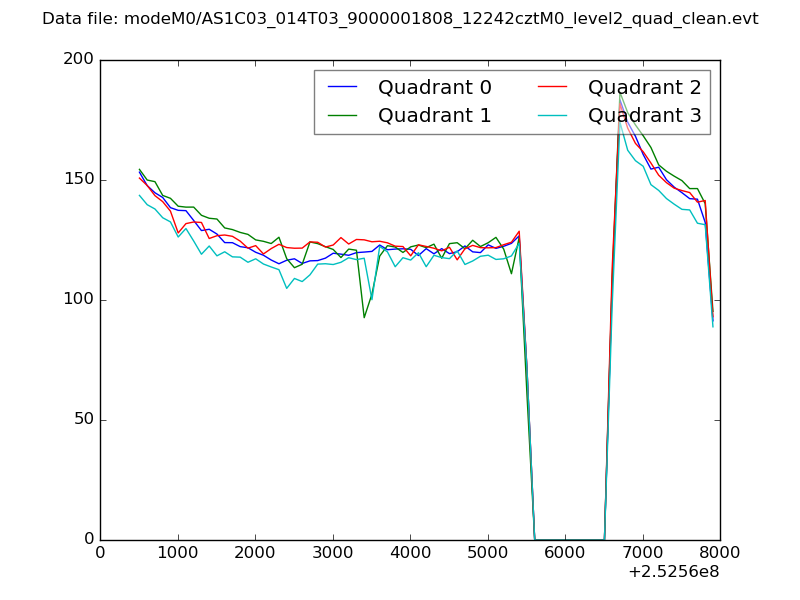 |
|
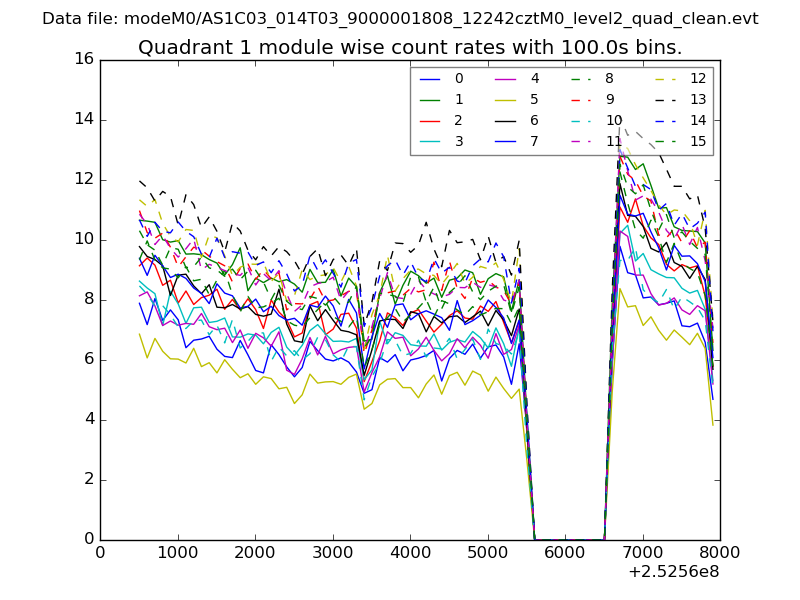
| Module-wise count rates for Quadrant A Data is divided into 100 sec bins |
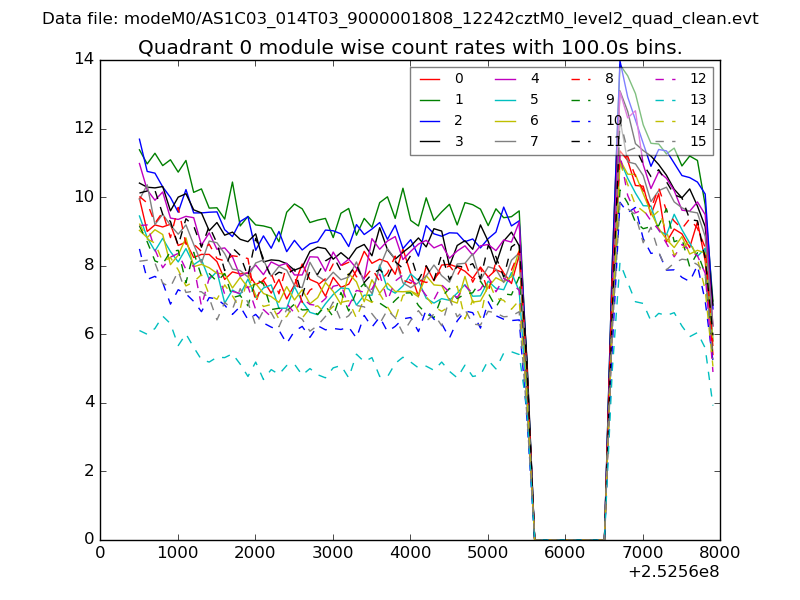 |
 |
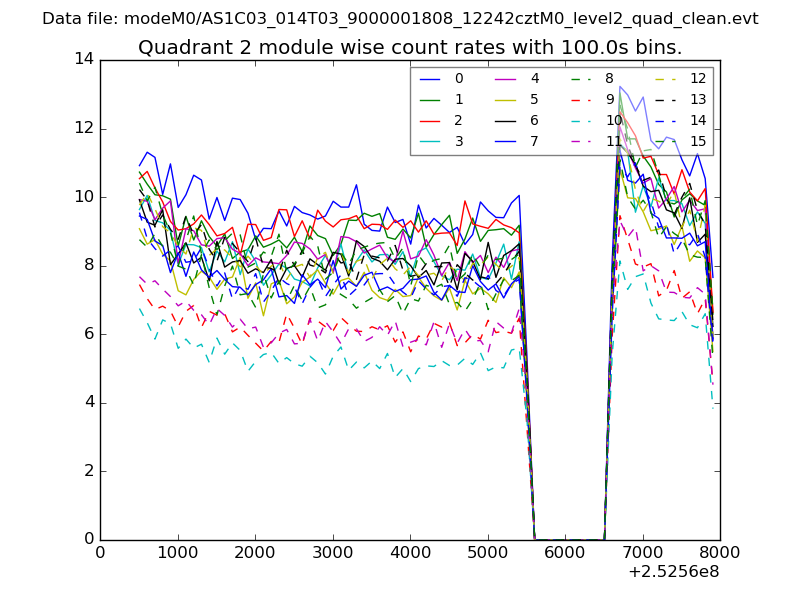
| Module-wise count rates for Quadrant B Data is divided into 100 sec bins |
 |
 |
| Module-wise count rates for Quadrant C Data is divided into 100 sec bins |
 |
 |
| Module-wise count rates for Quadrant D Data is divided into 100 sec bins |
 |
 |
| Parameter | Plot |
|---|---|
| CZT HV Monitor | 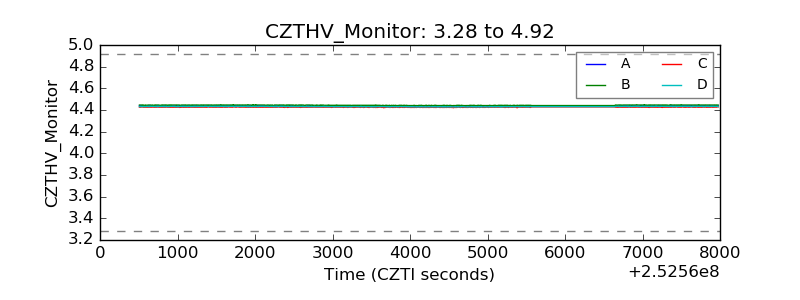 |
| D_VDD | 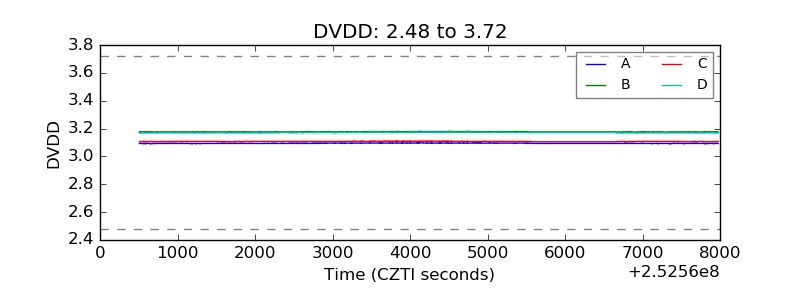 |
| Temperature 1 | 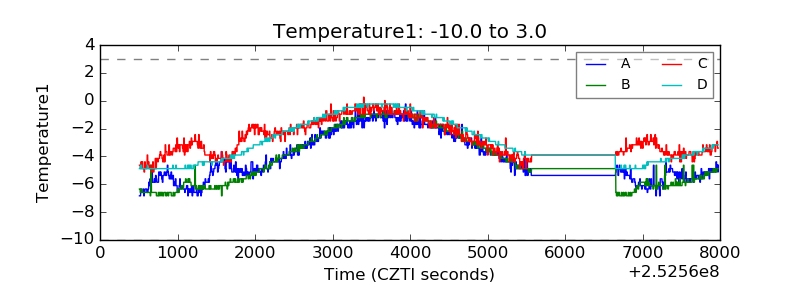 |
| Veto HV Monitor | 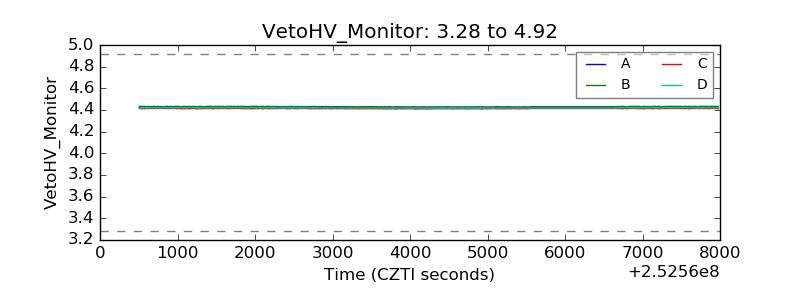 |
| Veto LLD | 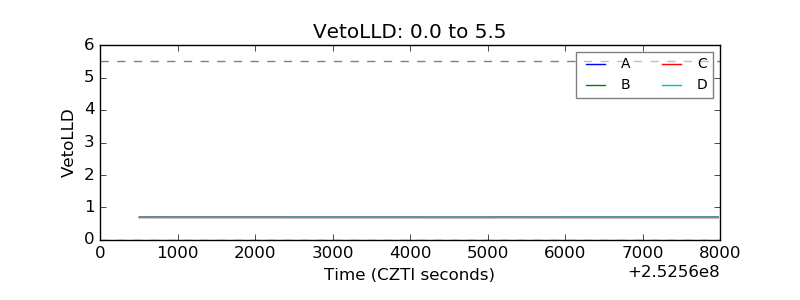 |
| Alpha Counter | 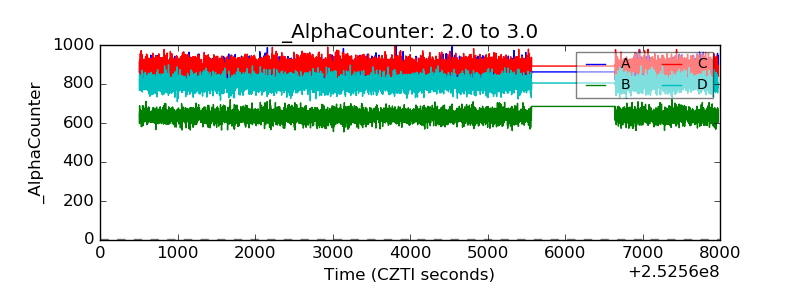 |
| _CPM_Rate | 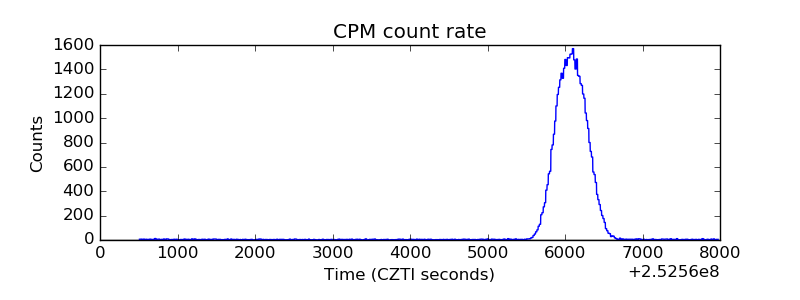 |
| CZT Counter | 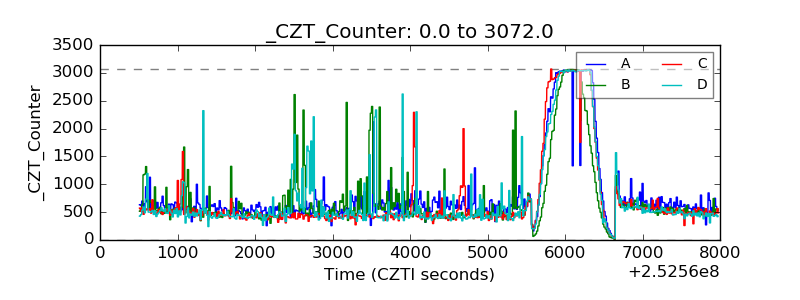 |
| +2.5 Volts monitor | 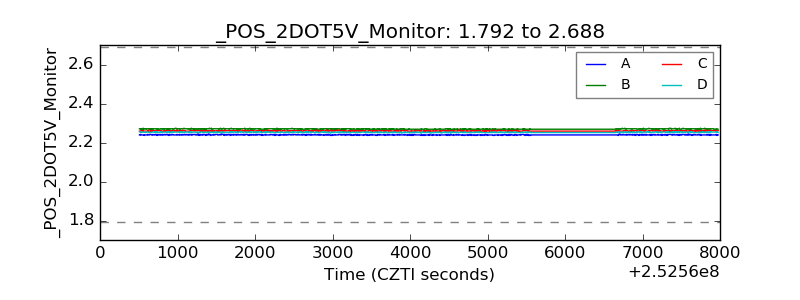 |
| +5 Volts monitor | 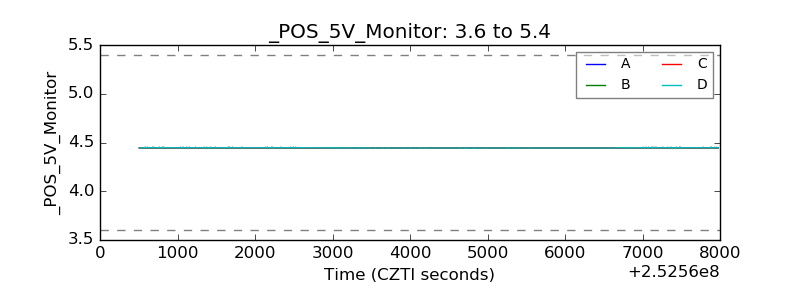 |
| _ROLL_ROT | 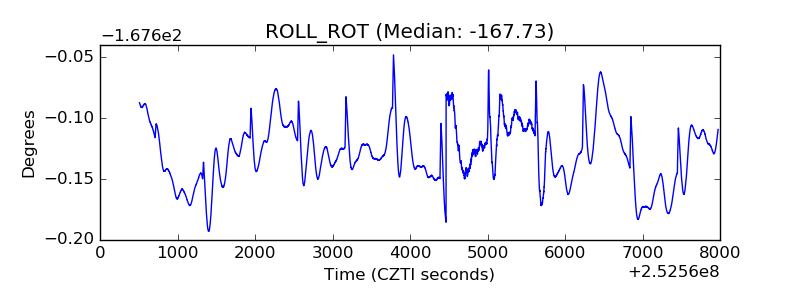 |
| _Roll_DEC | 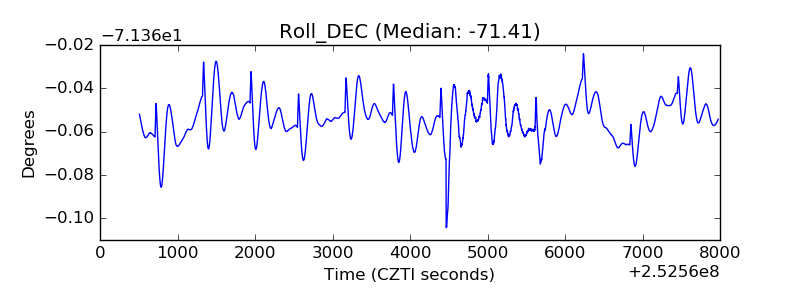 |
| _Roll_RA | 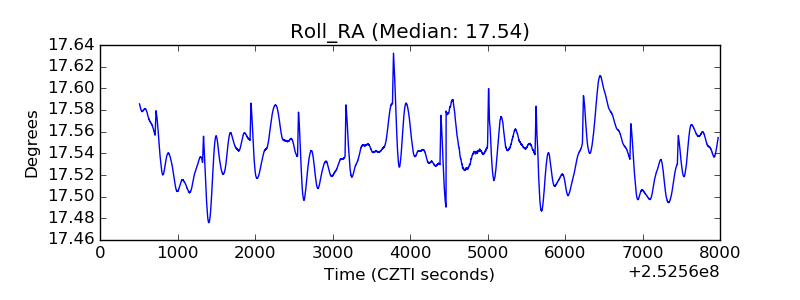 |
| Veto Counter | 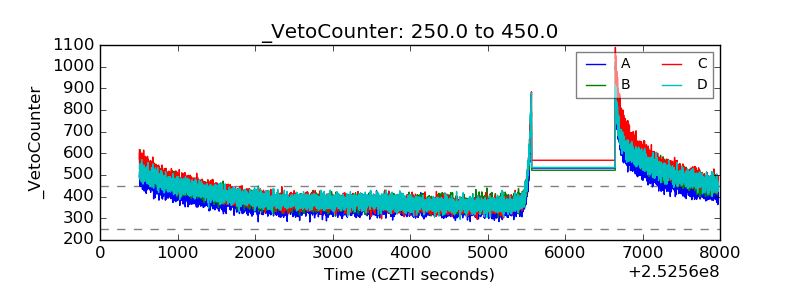 |