| Param | Original file | Final file |
|---|---|---|
| Filename | modeM0/AS1C03_014T03_9000001808_12243cztM0_level2.evt | modeM0/AS1C03_014T03_9000001808_12243cztM0_level2_quad_clean.evt |
| Size (bytes) | 485,262,720 | 132,310,080 |
| Size | 462.8 MB | 126.2 MB |
| Events in quadrant A | 3,736,368 | 896,858 |
| Events in quadrant B | 3,660,187 | 911,085 |
| Events in quadrant C | 3,353,407 | 901,498 |
| Events in quadrant D | 3,515,178 | 854,934 |
| Mode M0 | |||
|---|---|---|---|
| Quadrant | BADHDUFLAG | Total packets | Discarded packets |
| A | 0 | 15307 | 3 |
| B | 0 | 14925 | 2 |
| C | 0 | 14258 | 2 |
| D | 0 | 14591 | 2 |
| Mode M9 | |||
|---|---|---|---|
| Quadrant | BADHDUFLAG | Total packets | Discarded packets |
| A | 0 | 14 | 0 |
| B | 0 | 14 | 0 |
| C | 0 | 14 | 0 |
| D | 0 | 15 | 0 |
| Mode SS | |||
|---|---|---|---|
| Quadrant | BADHDUFLAG | Total packets | Discarded packets |
| A | 0 | 130 | 0 |
| B | 0 | 130 | 0 |
| C | 0 | 130 | 0 |
| D | 0 | 130 | 0 |
| Quadrant | Total seconds | Saturated seconds | Saturation percentage |
|---|---|---|---|
| A | 6344 | 123 | 1.938840% |
| B | 6344 | 171 | 2.695460% |
| C | 6344 | 107 | 1.686633% |
| D | 6344 | 171 | 2.695460% |
Noise dominated data is calculated using 1-second bins in cleaned event files. If a bin has >2000 counts, and if more than 50% of those come from <1% of pixels, then it is considered to be noise-dominated and hence unusable.
| Quadrant | # 1 sec bins | Bins with >0 counts | Bins with >2000 counts | High rate bins dominated by noise | Noise dominated (total time) | Noise dominated (detector-on time) | Marked lightcurve |
|---|---|---|---|---|---|---|---|
| A | 7550 | 6346 | 5 | 5 | 0.07% | 0.08% |  |
| B | 7550 | 6346 | 52 | 52 | 0.69% | 0.82% |  |
| C | 7550 | 6346 | 21 | 21 | 0.28% | 0.33% | 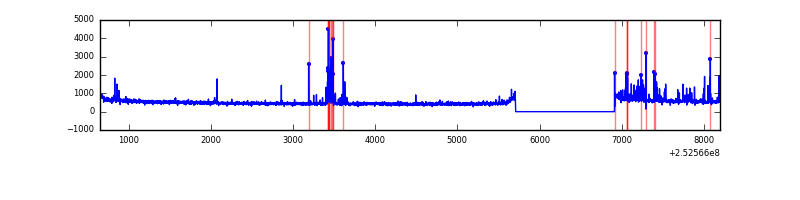 |
| D | 7550 | 6346 | 39 | 39 | 0.52% | 0.61% | 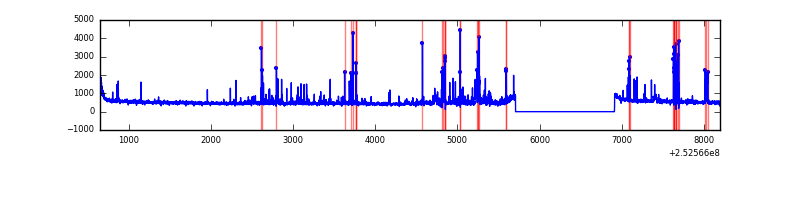 |
Top three noisy pixels from each quadrant. If the there are fewer than three noisy pixels in the level2.evt file, extra rows are filled as -1
| Pixel properties | Quadrant properties | ||||||
|---|---|---|---|---|---|---|---|
| Quadrant | DetID | PixID | Counts | Sigma | Mean | Median | Sigma |
| A | 13 | 251 | 238079 | 1476.48 | 805 | 791 | 160.7 |
| A | 1 | 162 | 138266 | 855.41 | 805 | 791 | 160.7 |
| A | 1 | 178 | 76394 | 470.42 | 805 | 791 | 160.7 |
| B | 4 | 239 | 261674 | 1762.4 | 804 | 787 | 148.0 |
| B | 11 | 51 | 103263 | 692.27 | 804 | 787 | 148.0 |
| B | 0 | 85 | 47422 | 315.04 | 804 | 787 | 148.0 |
| C | 15 | 208 | 246895 | 1374.64 | 789 | 795 | 179.0 |
| C | 14 | 234 | 16328 | 86.76 | 789 | 795 | 179.0 |
| C | 4 | 175 | 14203 | 74.89 | 789 | 795 | 179.0 |
| D | 1 | 52 | 224458 | 1208.85 | 781 | 757 | 185.1 |
| D | 10 | 199 | 119957 | 644.14 | 781 | 757 | 185.1 |
| D | 13 | 104 | 43475 | 230.84 | 781 | 757 | 185.1 |
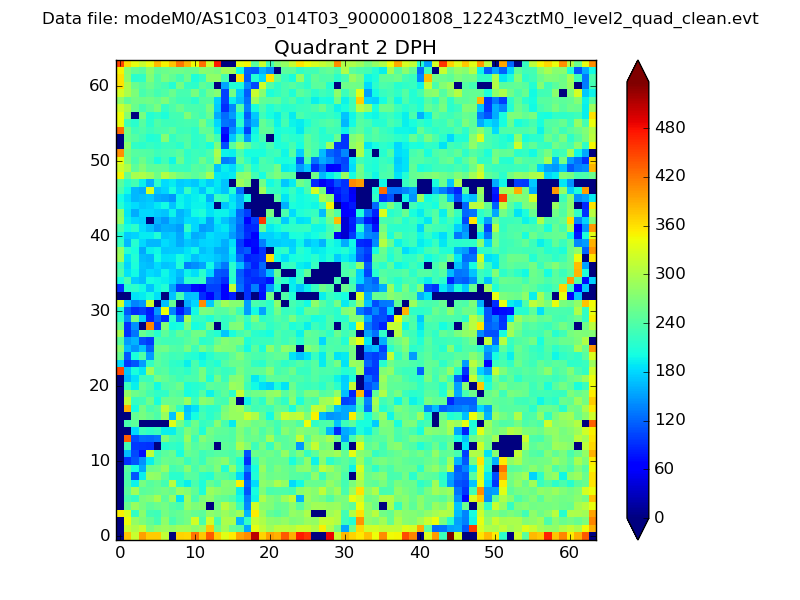
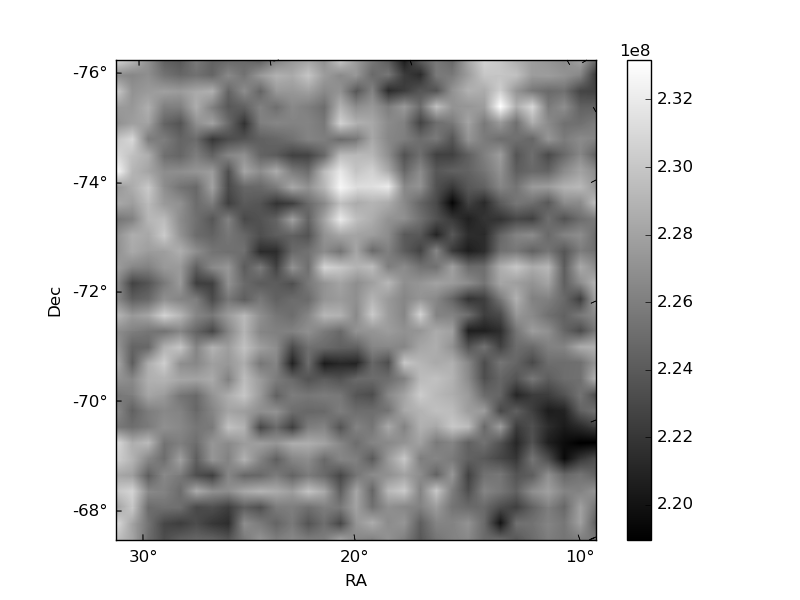
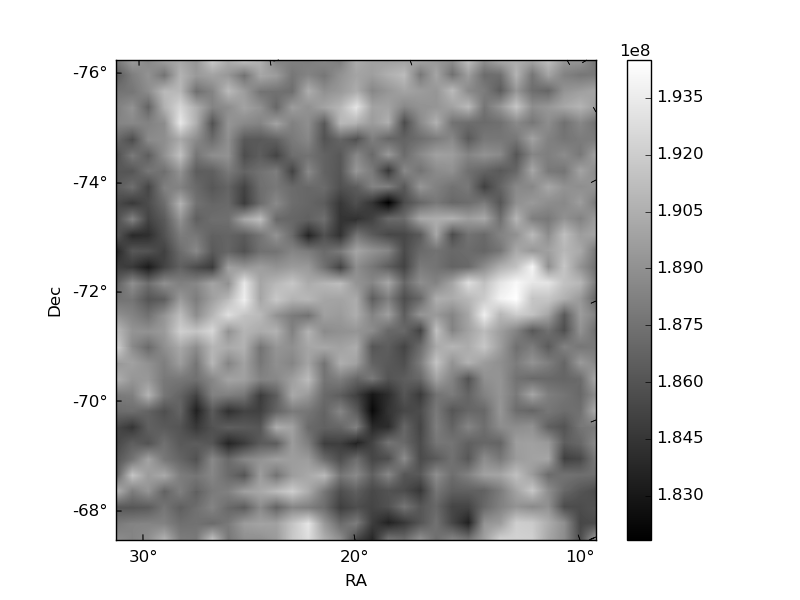
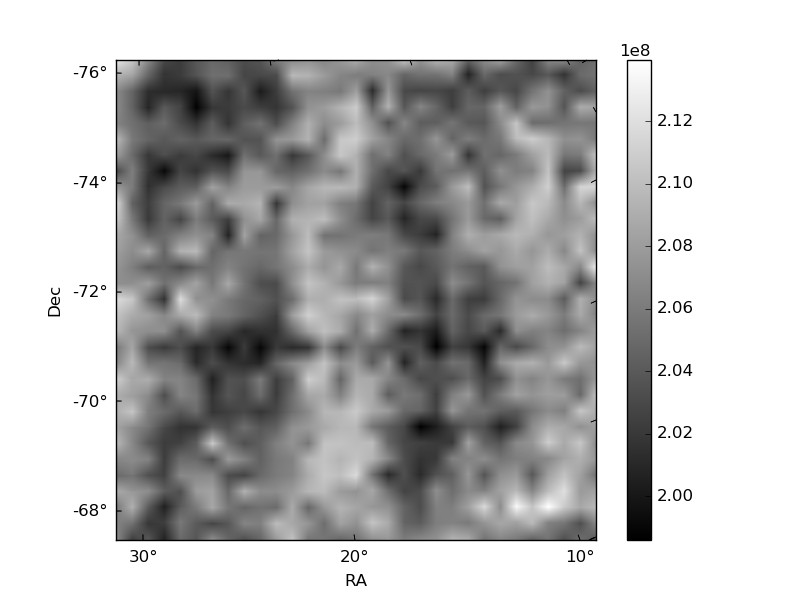
Histogram calculated using DETX and DETY for each event in the final _common_clean file
| Quadrant A | 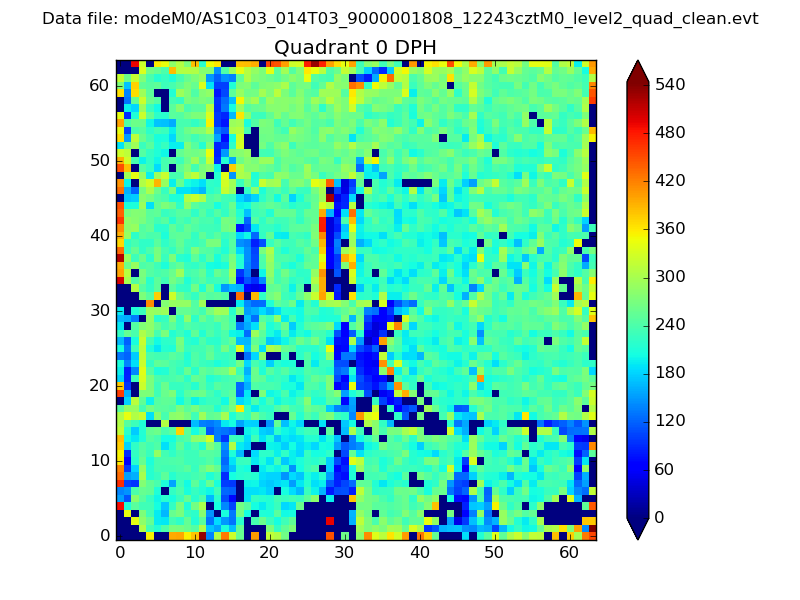 |
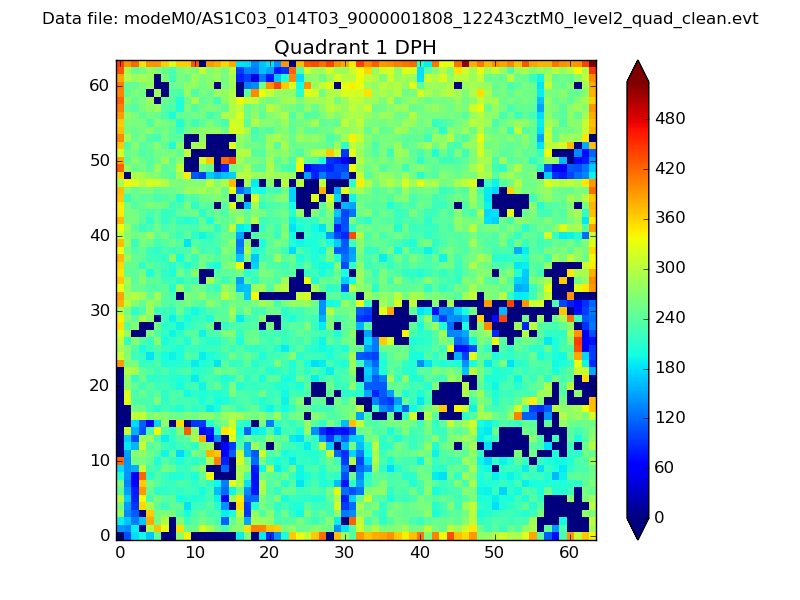 |
Quadrant B |
|---|---|---|---|
| Quadrant D | 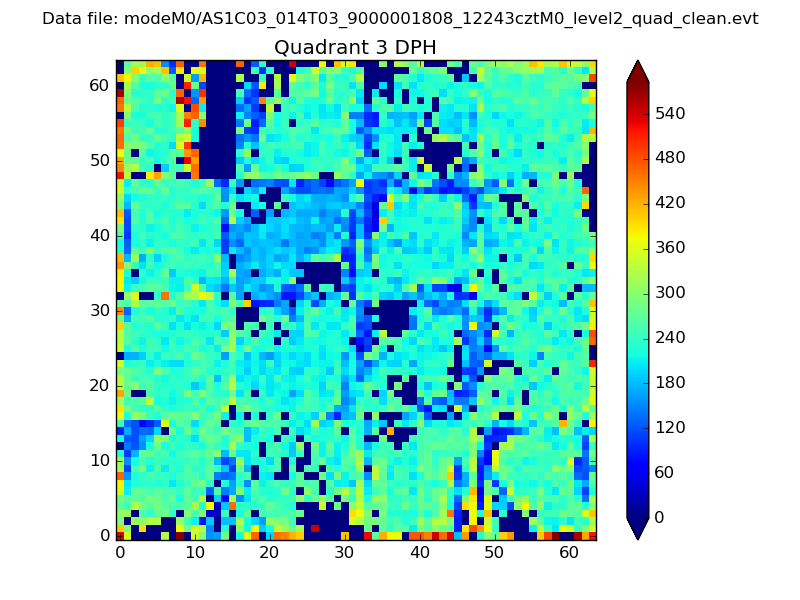 |
 |
Quadrant C |
| Plot type | Count rate plots | Images |
|---|---|---|
| Comparison with Poisson distribution Blue bars denote a histogram of data divided into 1 sec bins. Red curve is a Poisson curve with rate = median count rate of data. |
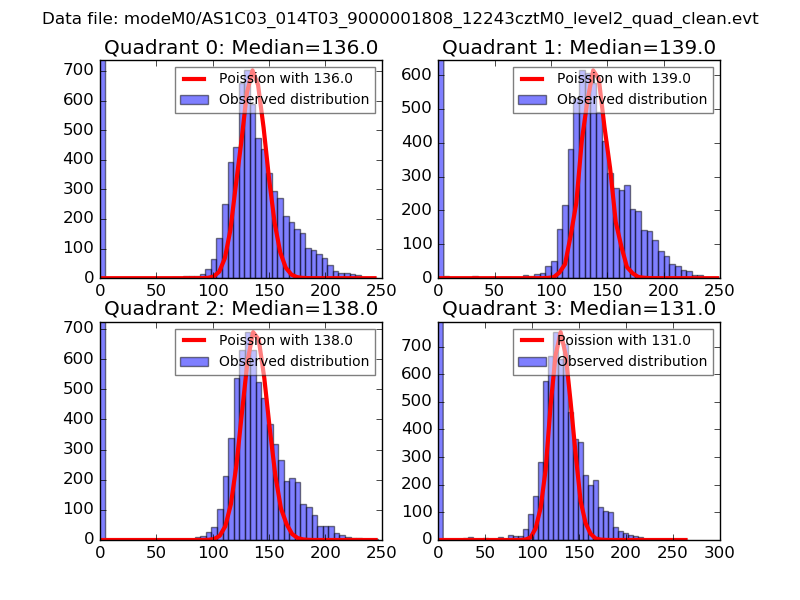 |
 |
| Quadrant-wise count rates Data is divided into 100 sec bins |
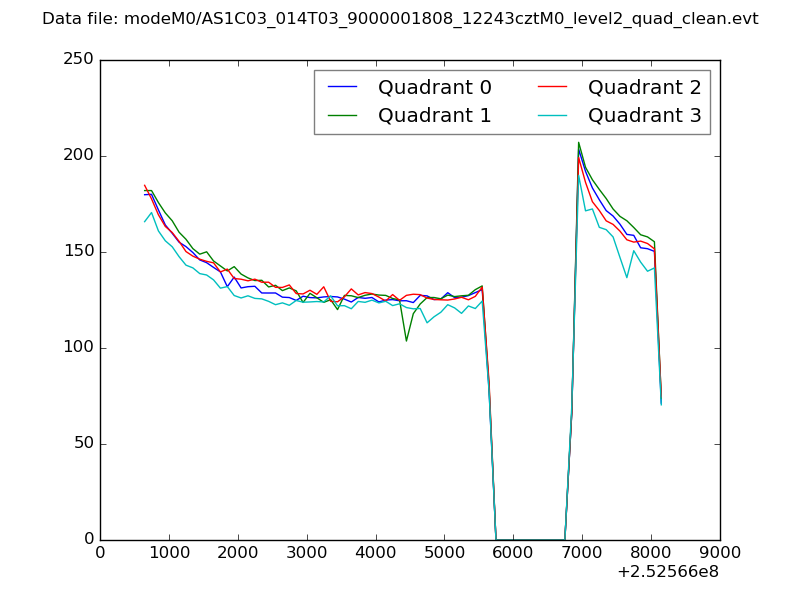 |
|
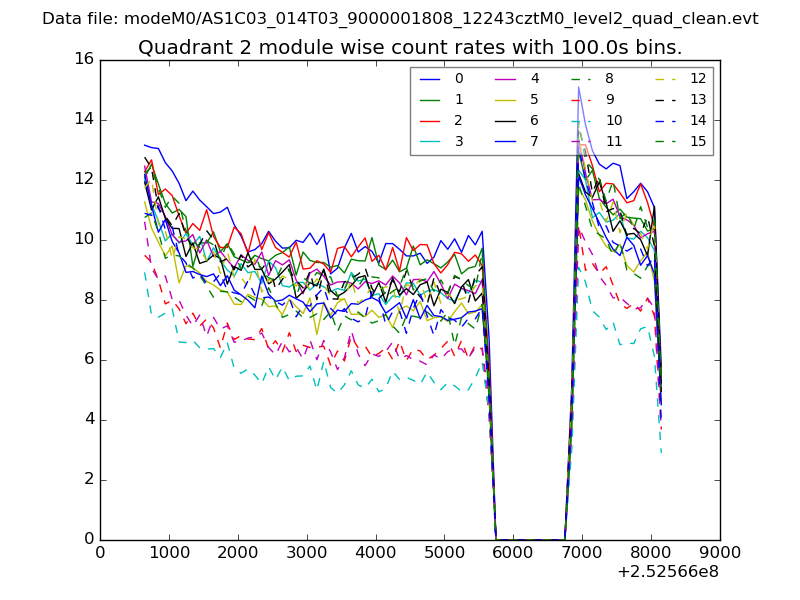
| Module-wise count rates for Quadrant A Data is divided into 100 sec bins |
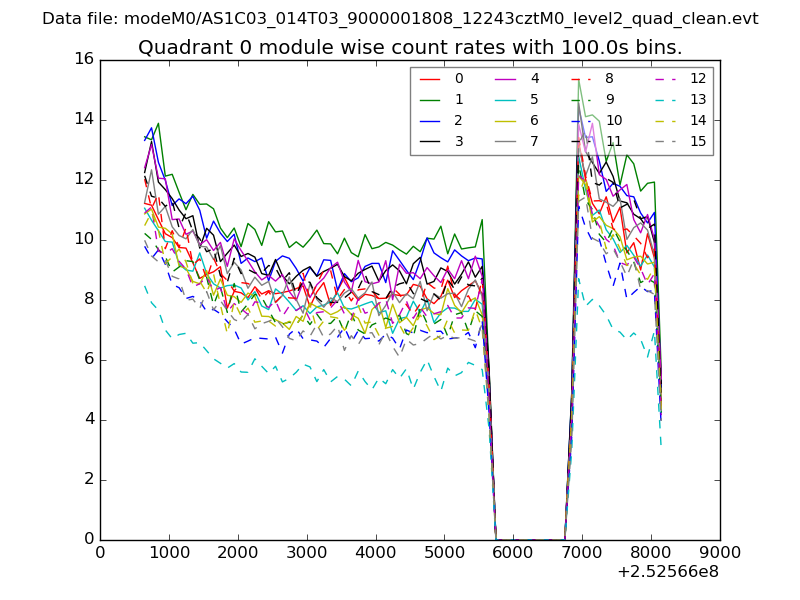 |
 |
| Module-wise count rates for Quadrant B Data is divided into 100 sec bins |
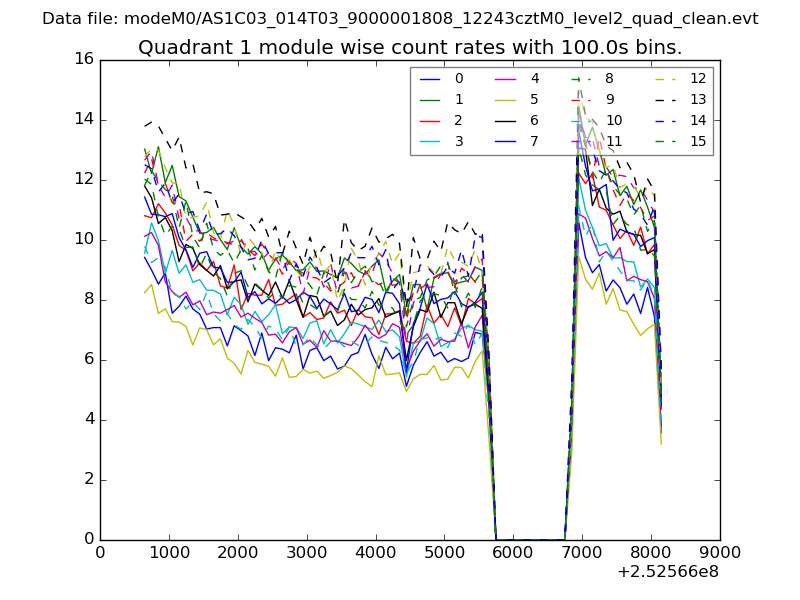 |
 |
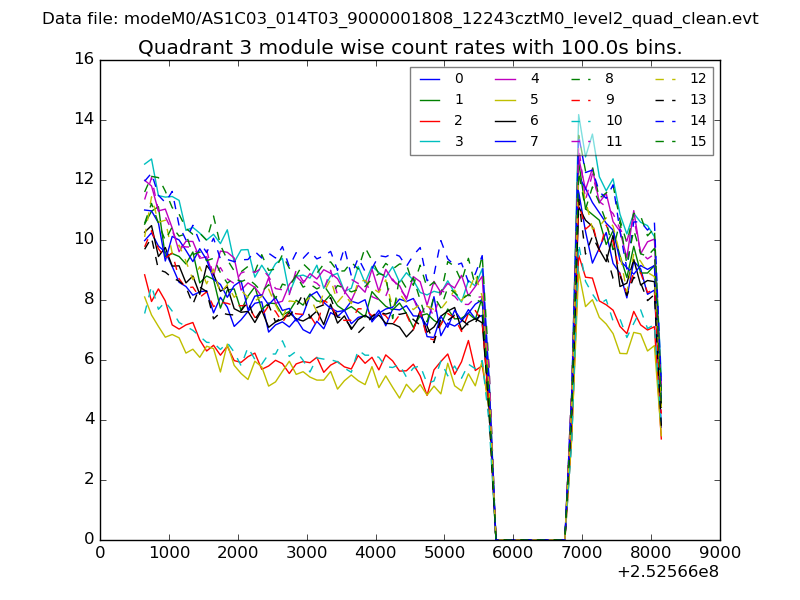
| Module-wise count rates for Quadrant C Data is divided into 100 sec bins |
 |
 |
| Module-wise count rates for Quadrant D Data is divided into 100 sec bins |
 |
 |
| Parameter | Plot |
|---|---|
| CZT HV Monitor |  |
| D_VDD | 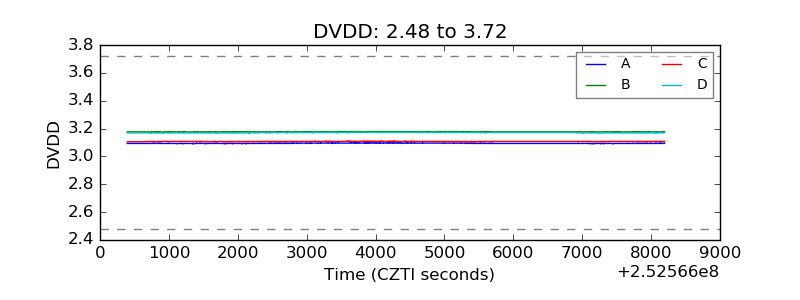 |
| Temperature 1 | 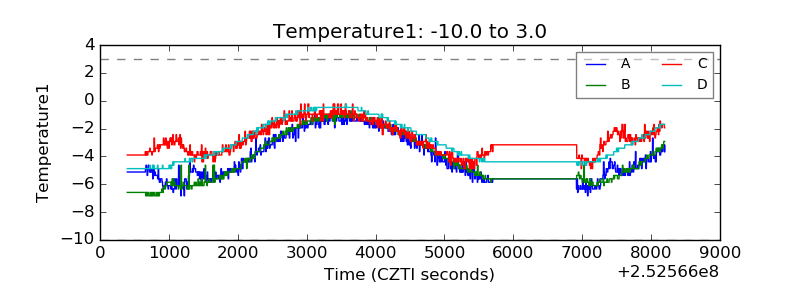 |
| Veto HV Monitor | 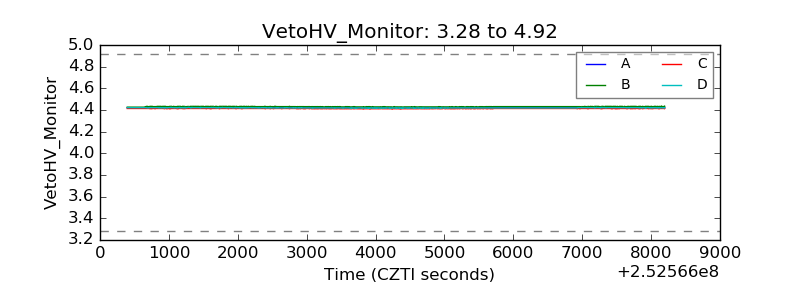 |
| Veto LLD |  |
| Alpha Counter | 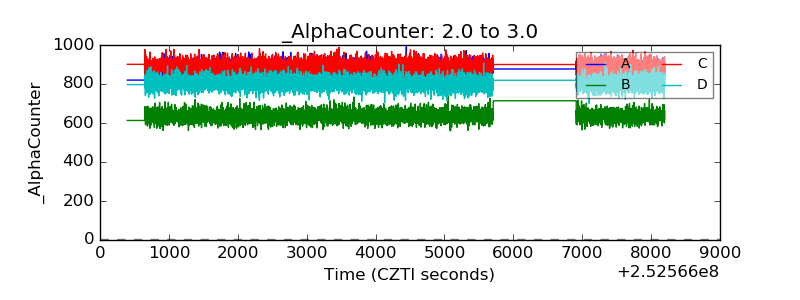 |
| _CPM_Rate | 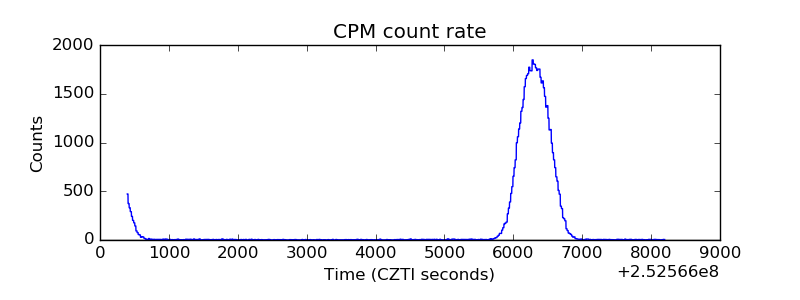 |
| CZT Counter | 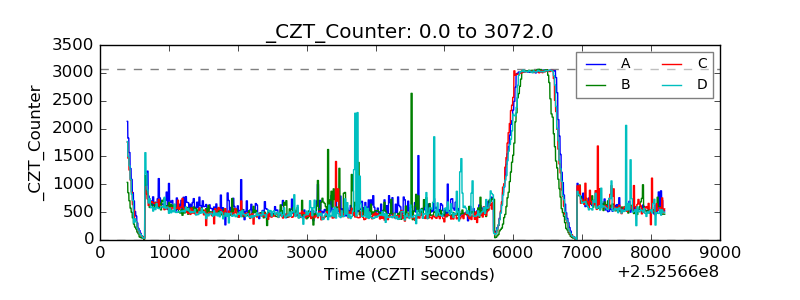 |
| +2.5 Volts monitor |  |
| +5 Volts monitor |  |
| _ROLL_ROT | 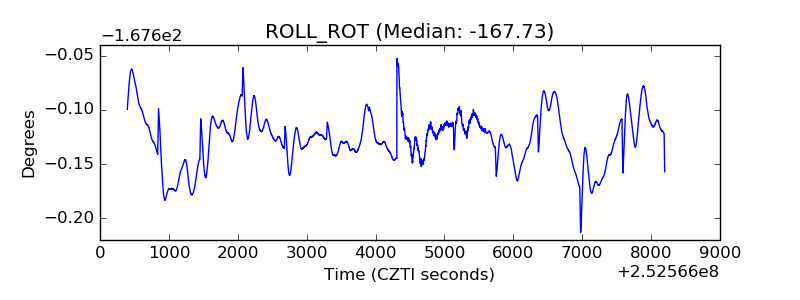 |
| _Roll_DEC | 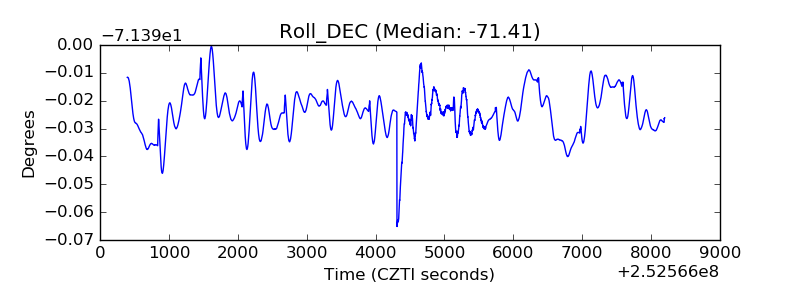 |
| _Roll_RA | 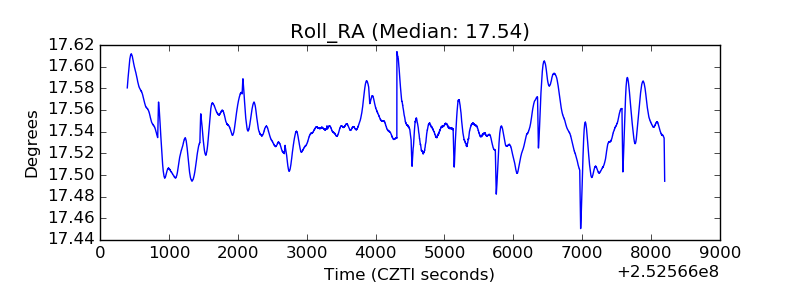 |
| Veto Counter | 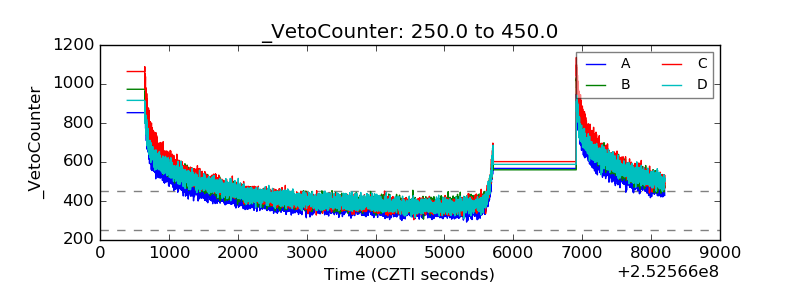 |