| Param | Original file | Final file |
|---|---|---|
| Filename | modeM0/AS1C03_014T03_9000001808_12244cztM0_level2.evt | modeM0/AS1C03_014T03_9000001808_12244cztM0_level2_quad_clean.evt |
| Size (bytes) | 375,292,800 | 98,124,480 |
| Size | 357.9 MB | 93.6 MB |
| Events in quadrant A | 2,960,584 | 668,380 |
| Events in quadrant B | 2,731,659 | 674,109 |
| Events in quadrant C | 2,456,488 | 670,903 |
| Events in quadrant D | 2,899,136 | 630,240 |
| Mode M0 | |||
|---|---|---|---|
| Quadrant | BADHDUFLAG | Total packets | Discarded packets |
| A | 0 | 11968 | 1 |
| B | 0 | 11036 | 1 |
| C | 0 | 10488 | 1 |
| D | 0 | 11695 | 1 |
| Mode M9 | |||
|---|---|---|---|
| Quadrant | BADHDUFLAG | Total packets | Discarded packets |
| A | 0 | 6 | 0 |
| B | 0 | 6 | 0 |
| C | 0 | 6 | 0 |
| D | 0 | 7 | 0 |
| Mode SS | |||
|---|---|---|---|
| Quadrant | BADHDUFLAG | Total packets | Discarded packets |
| A | 0 | 92 | 0 |
| B | 0 | 92 | 0 |
| C | 0 | 92 | 0 |
| D | 0 | 92 | 0 |
| Quadrant | Total seconds | Saturated seconds | Saturation percentage |
|---|---|---|---|
| A | 4676 | 66 | 1.411463% |
| B | 4676 | 124 | 2.651839% |
| C | 4676 | 44 | 0.940975% |
| D | 4676 | 201 | 4.298546% |
Noise dominated data is calculated using 1-second bins in cleaned event files. If a bin has >2000 counts, and if more than 50% of those come from <1% of pixels, then it is considered to be noise-dominated and hence unusable.
| Quadrant | # 1 sec bins | Bins with >0 counts | Bins with >2000 counts | High rate bins dominated by noise | Noise dominated (total time) | Noise dominated (detector-on time) | Marked lightcurve |
|---|---|---|---|---|---|---|---|
| A | 4677 | 4677 | 8 | 8 | 0.17% | 0.17% | 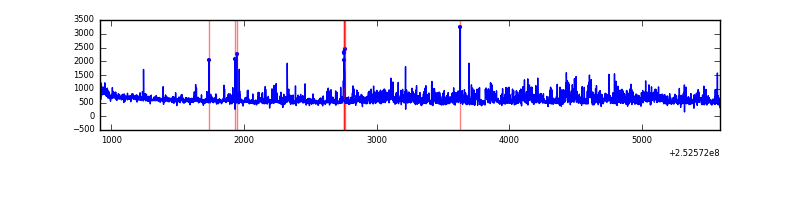 |
| B | 4677 | 4677 | 62 | 62 | 1.33% | 1.33% | 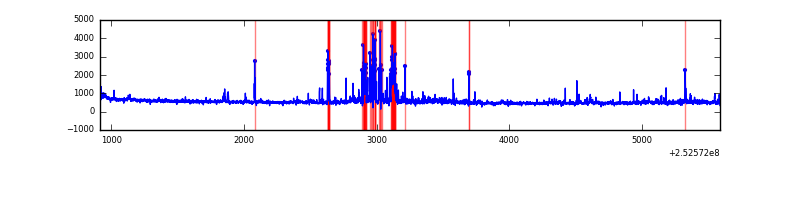 |
| C | 4677 | 4677 | 18 | 18 | 0.38% | 0.38% |  |
| D | 4677 | 4677 | 126 | 126 | 2.69% | 2.69% |  |
Top three noisy pixels from each quadrant. If the there are fewer than three noisy pixels in the level2.evt file, extra rows are filled as -1
| Pixel properties | Quadrant properties | ||||||
|---|---|---|---|---|---|---|---|
| Quadrant | DetID | PixID | Counts | Sigma | Mean | Median | Sigma |
| A | 13 | 251 | 211249 | 1812.71 | 584 | 575 | 116.2 |
| A | 1 | 162 | 181354 | 1555.48 | 584 | 575 | 116.2 |
| A | 1 | 178 | 103034 | 881.59 | 584 | 575 | 116.2 |
| B | 4 | 239 | 206020 | 1942.63 | 579 | 567 | 105.8 |
| B | 11 | 51 | 121195 | 1140.58 | 579 | 567 | 105.8 |
| B | 3 | 64 | 43536 | 406.29 | 579 | 567 | 105.8 |
| C | 15 | 208 | 201242 | 1551.49 | 566 | 569 | 129.3 |
| C | 4 | 175 | 30830 | 233.96 | 566 | 569 | 129.3 |
| C | 14 | 234 | 15537 | 115.72 | 566 | 569 | 129.3 |
| D | 1 | 52 | 545577 | 4143.79 | 558 | 545 | 131.5 |
| D | 2 | 33 | 74963 | 565.79 | 558 | 545 | 131.5 |
| D | 10 | 199 | 57933 | 436.31 | 558 | 545 | 131.5 |
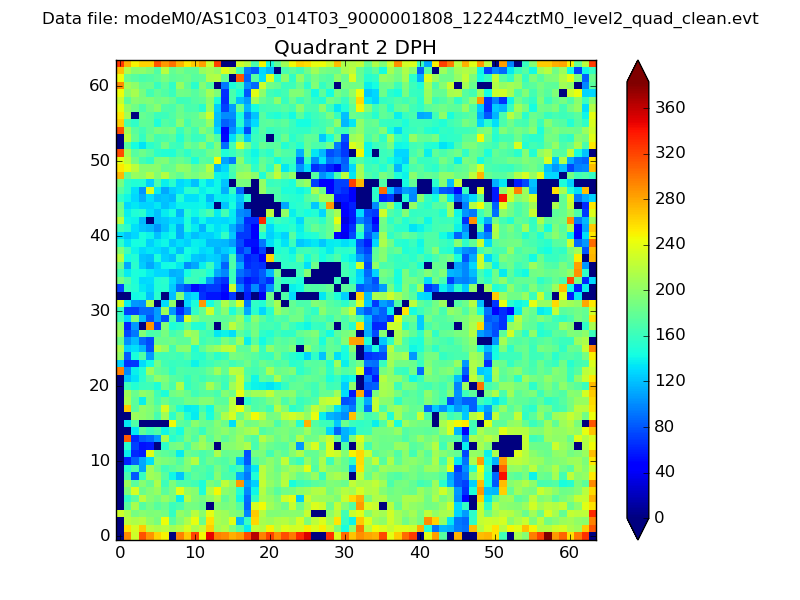
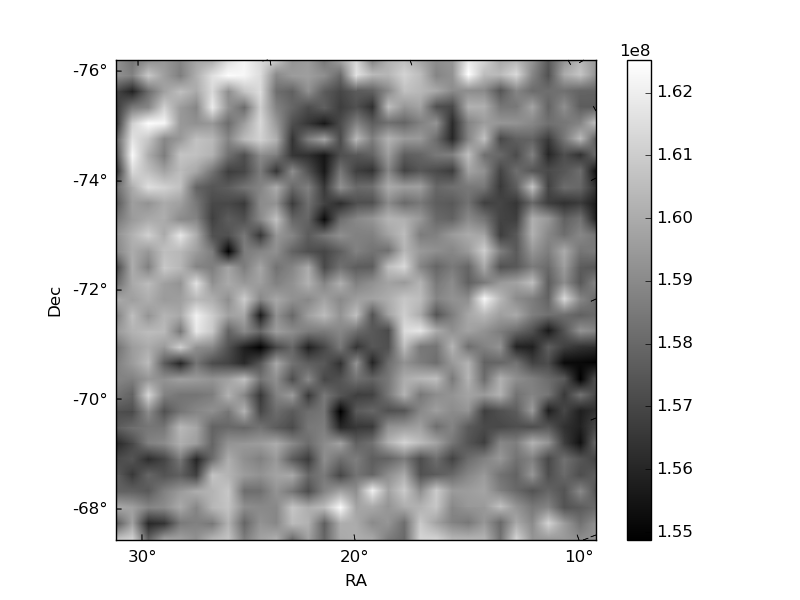
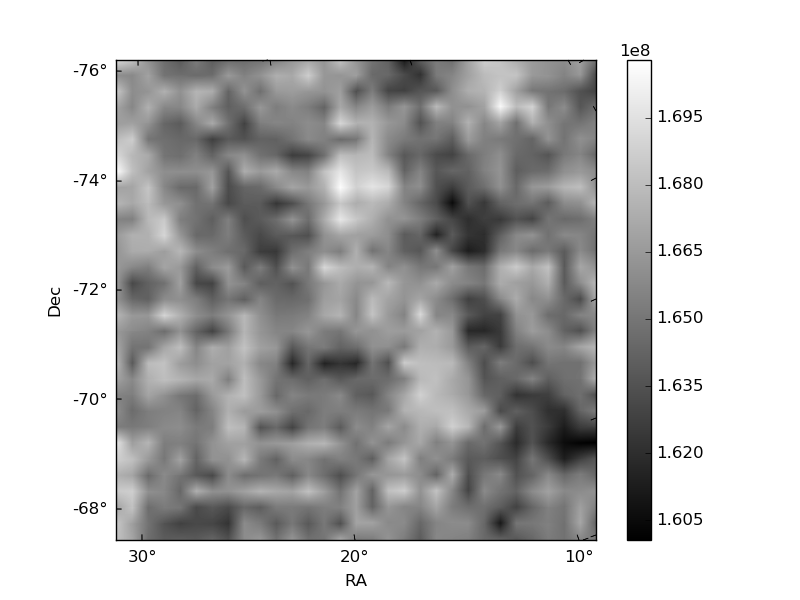
Histogram calculated using DETX and DETY for each event in the final _common_clean file
| Quadrant A | 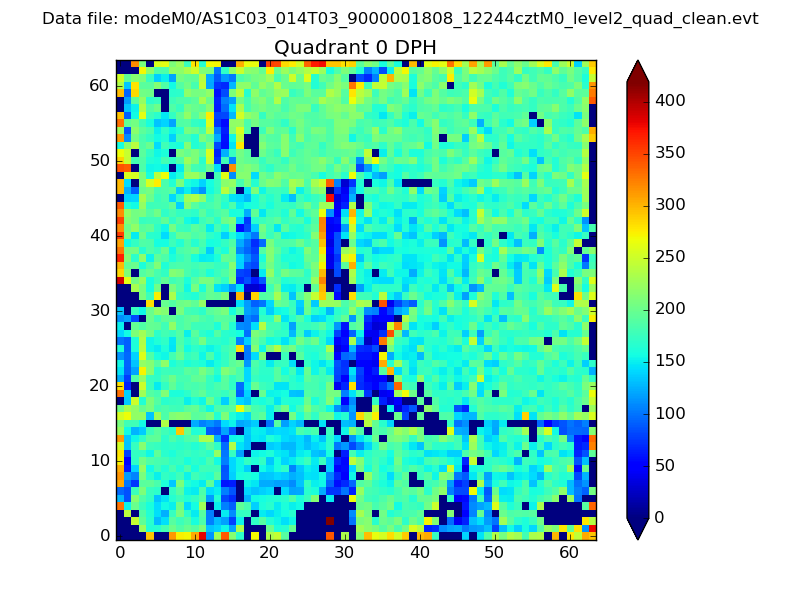 |
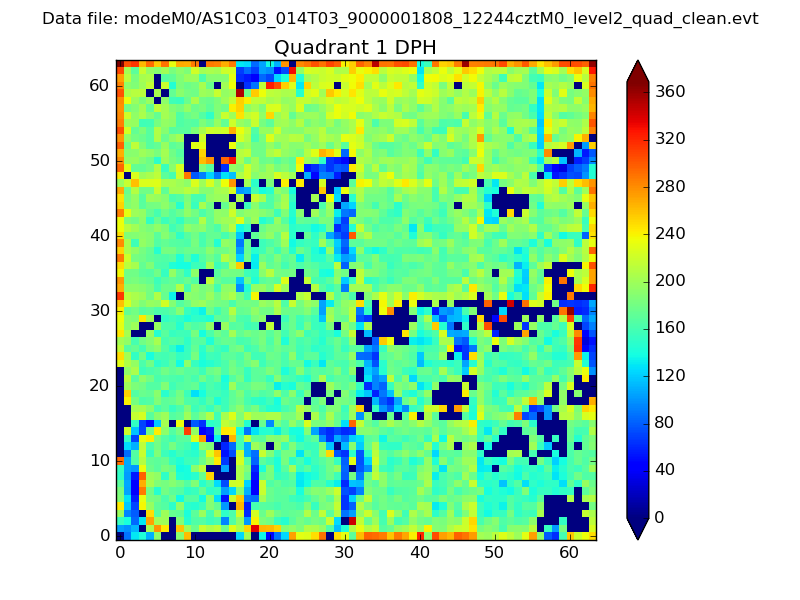 |
Quadrant B |
|---|---|---|---|
| Quadrant D | 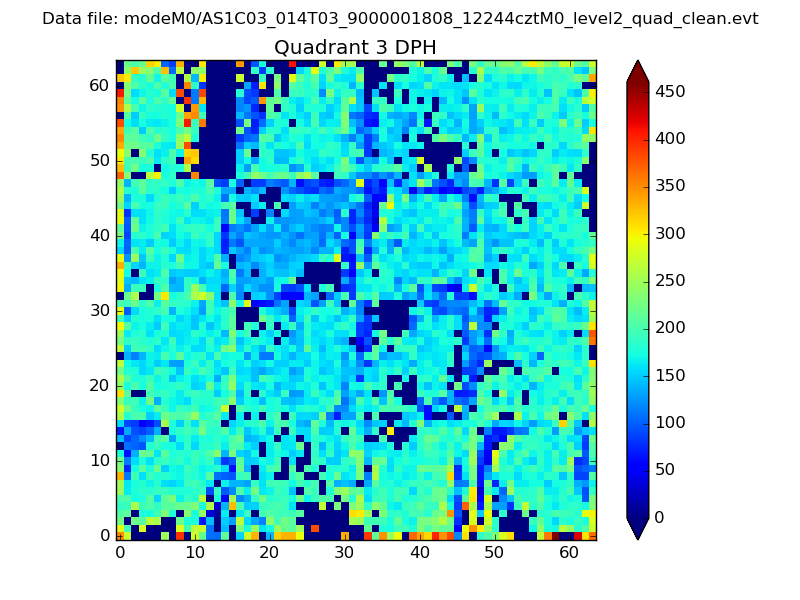 |
 |
Quadrant C |
| Plot type | Count rate plots | Images |
|---|---|---|
| Comparison with Poisson distribution Blue bars denote a histogram of data divided into 1 sec bins. Red curve is a Poisson curve with rate = median count rate of data. |
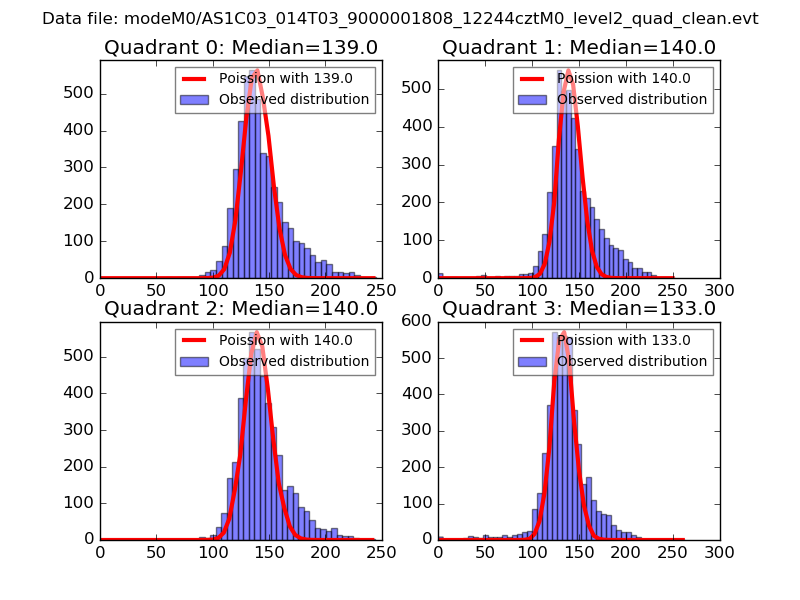 |
 |
| Quadrant-wise count rates Data is divided into 100 sec bins |
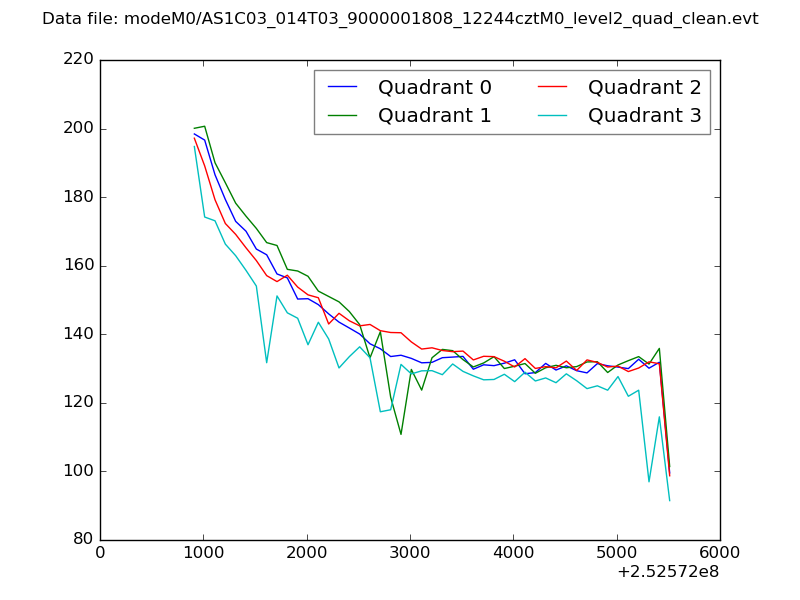 |
|
| Module-wise count rates for Quadrant A Data is divided into 100 sec bins |
 |
 |
| Module-wise count rates for Quadrant B Data is divided into 100 sec bins |
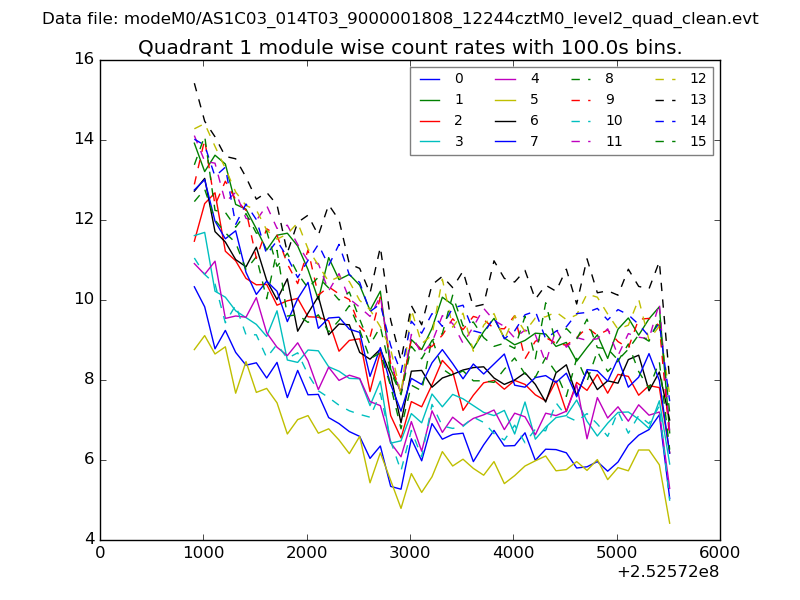 |
 |
| Module-wise count rates for Quadrant C Data is divided into 100 sec bins |
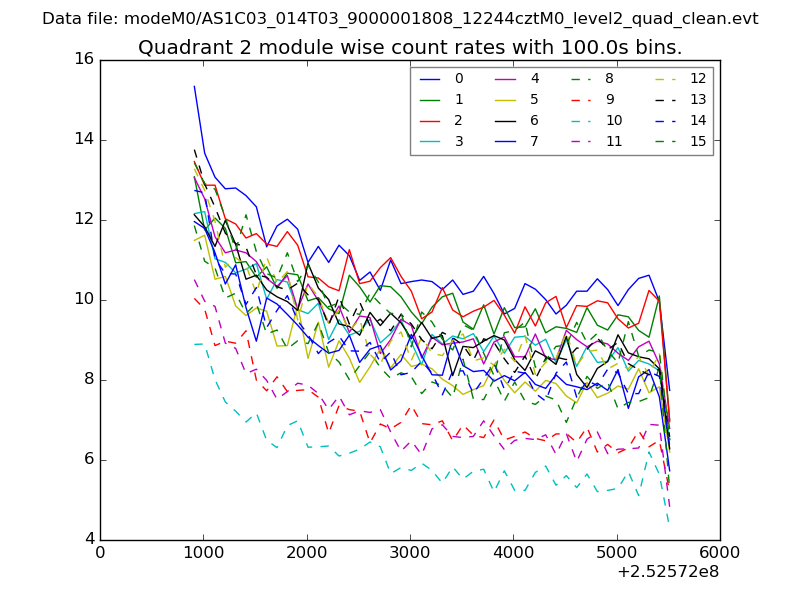 |
 |
| Module-wise count rates for Quadrant D Data is divided into 100 sec bins |
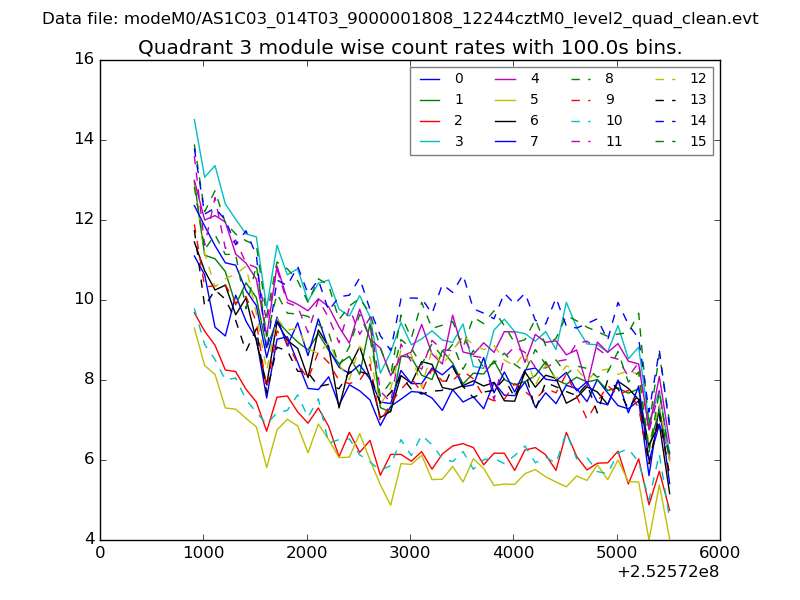 |
 |
| Parameter | Plot |
|---|---|
| CZT HV Monitor | 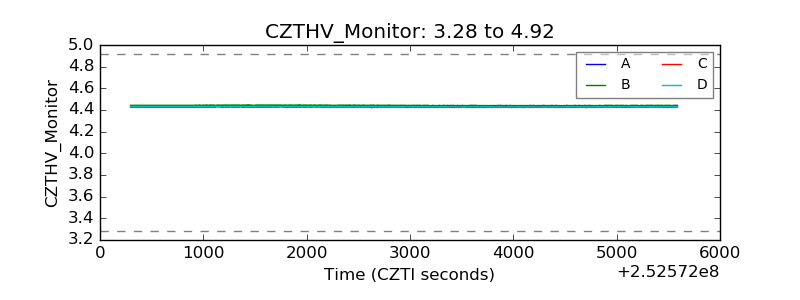 |
| D_VDD | 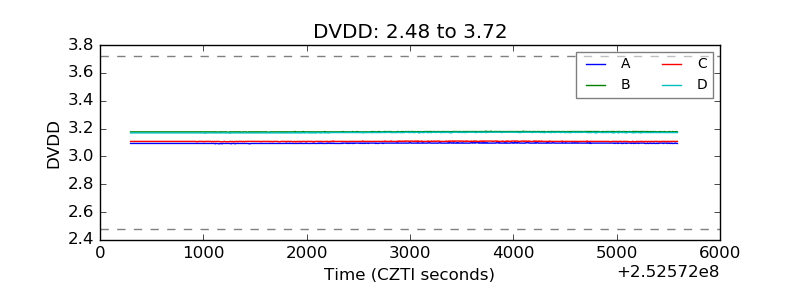 |
| Temperature 1 | 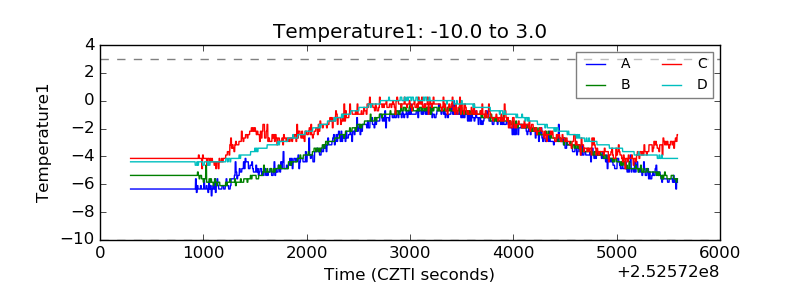 |
| Veto HV Monitor | 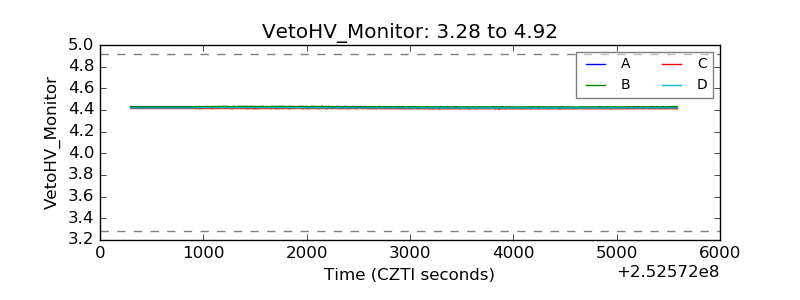 |
| Veto LLD |  |
| Alpha Counter | 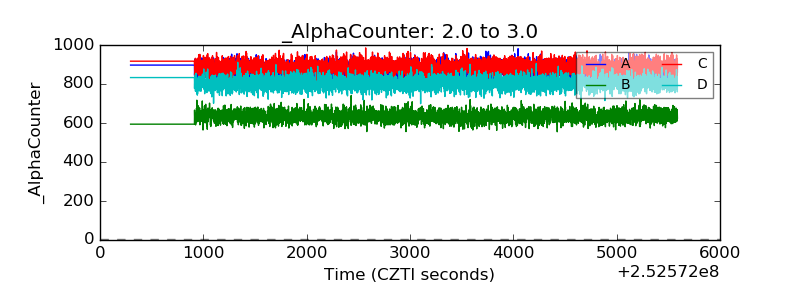 |
| _CPM_Rate | 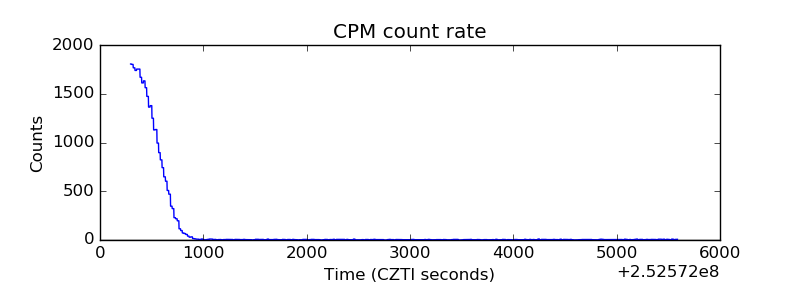 |
| CZT Counter | 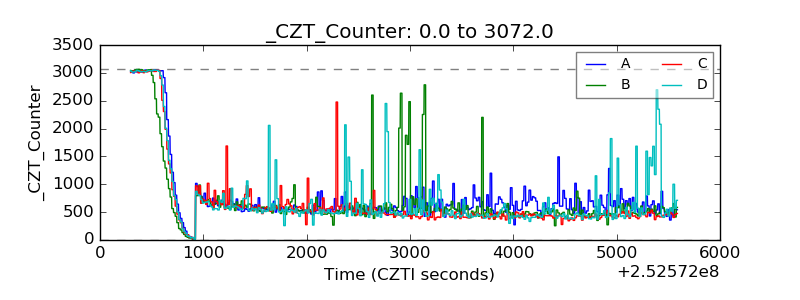 |
| +2.5 Volts monitor |  |
| +5 Volts monitor | 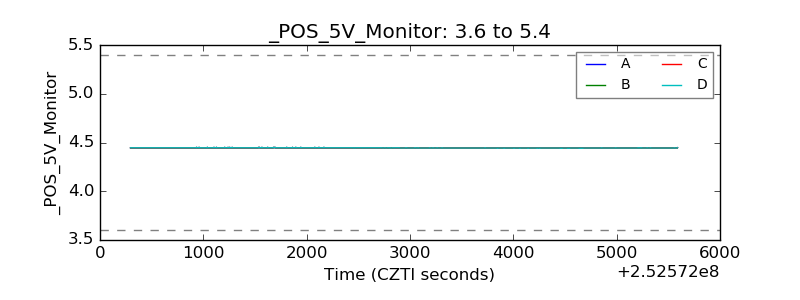 |
| _ROLL_ROT |  |
| _Roll_DEC | 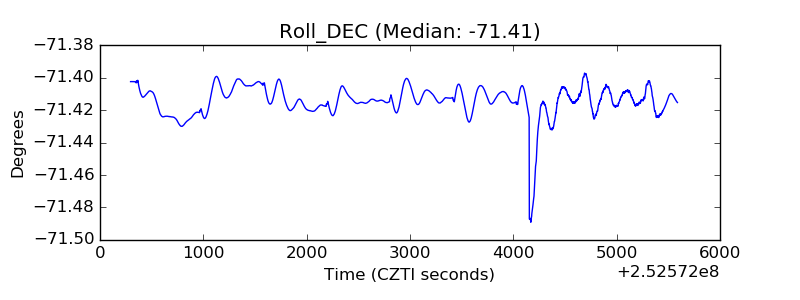 |
| _Roll_RA | 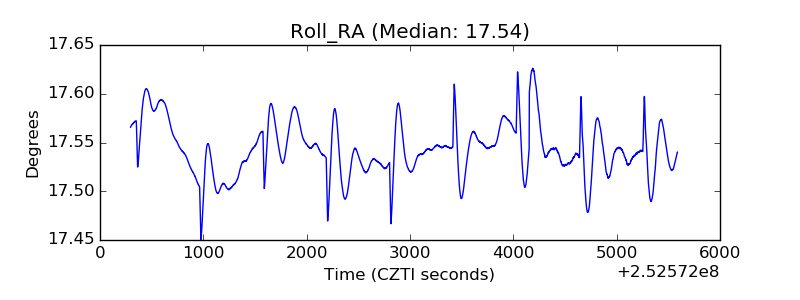 |
| Veto Counter |  |