| Param | Original file | Final file |
|---|---|---|
| Filename | modeM0/AS1C03_005T01_9000001810_12244cztM0_level2.evt | modeM0/AS1C03_005T01_9000001810_12244cztM0_level2_quad_clean.evt |
| Size (bytes) | 113,330,880 | 32,086,080 |
| Size | 108.1 MB | 30.6 MB |
| Events in quadrant A | 890,988 | 220,870 |
| Events in quadrant B | 826,693 | 225,923 |
| Events in quadrant C | 762,870 | 219,868 |
| Events in quadrant D | 860,584 | 207,171 |
| Mode M0 | |||
|---|---|---|---|
| Quadrant | BADHDUFLAG | Total packets | Discarded packets |
| A | 0 | 3658 | 2 |
| B | 0 | 3302 | 1 |
| C | 0 | 3094 | 1 |
| D | 0 | 3423 | 1 |
| Mode SS | |||
|---|---|---|---|
| Quadrant | BADHDUFLAG | Total packets | Discarded packets |
| A | 0 | 26 | 0 |
| B | 0 | 26 | 0 |
| C | 0 | 26 | 0 |
| D | 0 | 26 | 0 |
| Mode M9 | |||
|---|---|---|---|
| Quadrant | BADHDUFLAG | Total packets | Discarded packets |
| A | 0 | 12 | 0 |
| B | 0 | 12 | 0 |
| C | 0 | 12 | 0 |
| D | 0 | 12 | 0 |
| Quadrant | Total seconds | Saturated seconds | Saturation percentage |
|---|---|---|---|
| A | 1301 | 15 | 1.152959% |
| B | 1301 | 26 | 1.998463% |
| C | 1301 | 8 | 0.614912% |
| D | 1301 | 23 | 1.767871% |
Noise dominated data is calculated using 1-second bins in cleaned event files. If a bin has >2000 counts, and if more than 50% of those come from <1% of pixels, then it is considered to be noise-dominated and hence unusable.
| Quadrant | # 1 sec bins | Bins with >0 counts | Bins with >2000 counts | High rate bins dominated by noise | Noise dominated (total time) | Noise dominated (detector-on time) | Marked lightcurve |
|---|---|---|---|---|---|---|---|
| A | 1302 | 1302 | 0 | 0 | 0.00% | 0.00% | 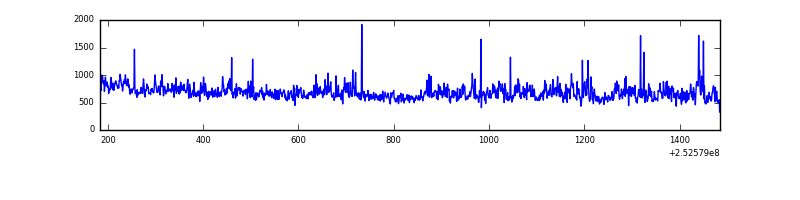 |
| B | 1302 | 1302 | 7 | 7 | 0.54% | 0.54% | 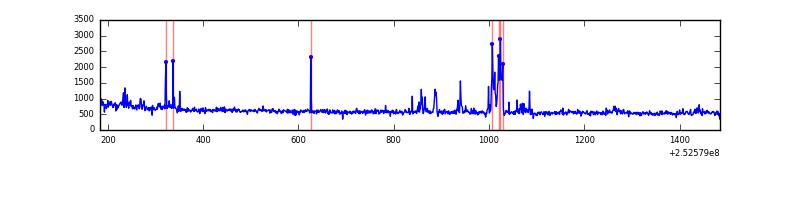 |
| C | 1302 | 1302 | 2 | 2 | 0.15% | 0.15% | 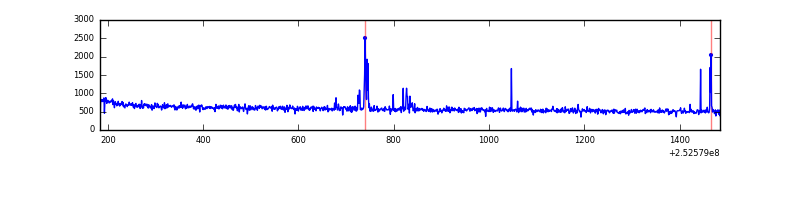 |
| D | 1302 | 1302 | 11 | 11 | 0.84% | 0.84% | 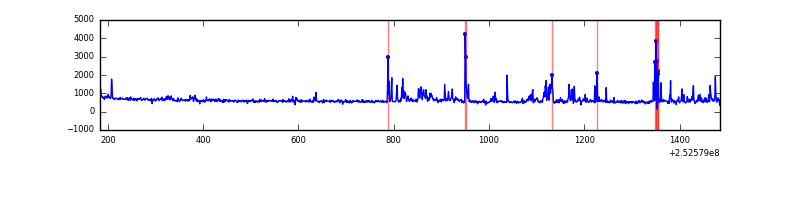 |
Top three noisy pixels from each quadrant. If the there are fewer than three noisy pixels in the level2.evt file, extra rows are filled as -1
| Pixel properties | Quadrant properties | ||||||
|---|---|---|---|---|---|---|---|
| Quadrant | DetID | PixID | Counts | Sigma | Mean | Median | Sigma |
| A | 13 | 251 | 46645 | 1144.23 | 193 | 190 | 40.6 |
| A | 1 | 162 | 38240 | 937.21 | 193 | 190 | 40.6 |
| A | 1 | 178 | 22176 | 541.54 | 193 | 190 | 40.6 |
| B | 4 | 239 | 48045 | 1308.38 | 190 | 187 | 36.6 |
| B | 15 | 201 | 12555 | 338.13 | 190 | 187 | 36.6 |
| B | 0 | 214 | 7409 | 197.44 | 190 | 187 | 36.6 |
| C | 15 | 208 | 26750 | 606.68 | 188 | 189 | 43.8 |
| C | 4 | 175 | 1480 | 29.49 | 188 | 189 | 43.8 |
| C | 13 | 61 | 1331 | 26.08 | 188 | 189 | 43.8 |
| D | 1 | 52 | 108838 | 2408.08 | 188 | 183 | 45.1 |
| D | 13 | 249 | 11662 | 254.4 | 188 | 183 | 45.1 |
| D | 10 | 199 | 6799 | 146.63 | 188 | 183 | 45.1 |
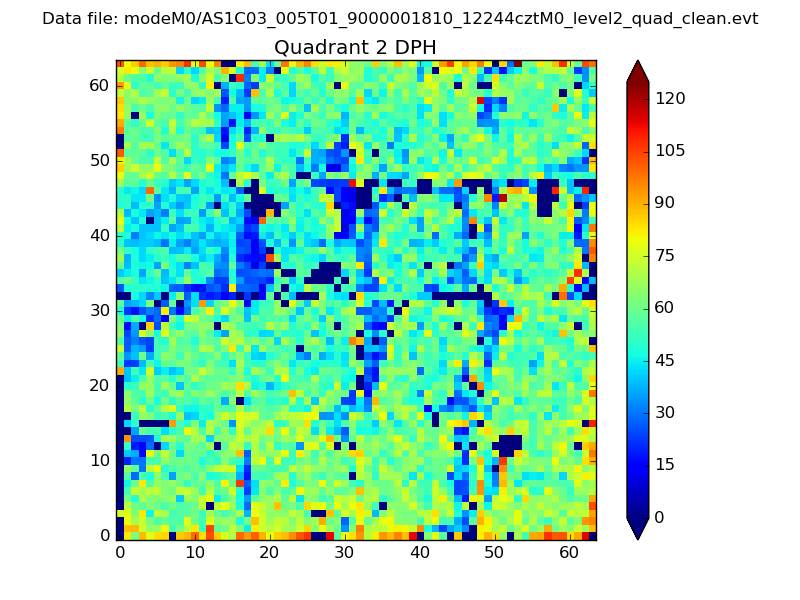
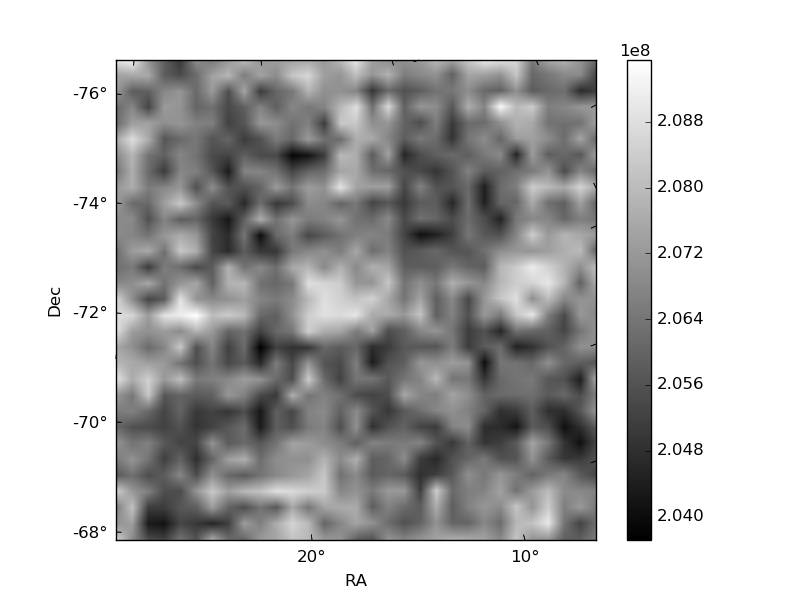
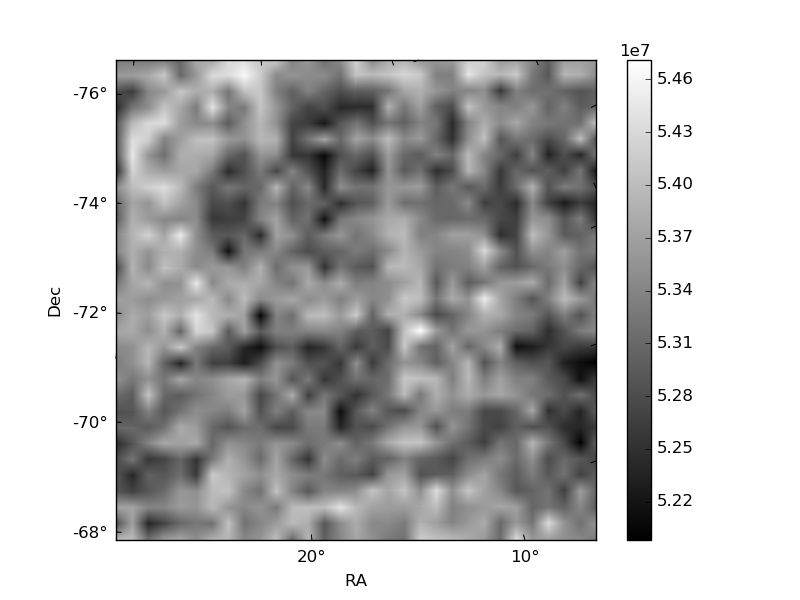
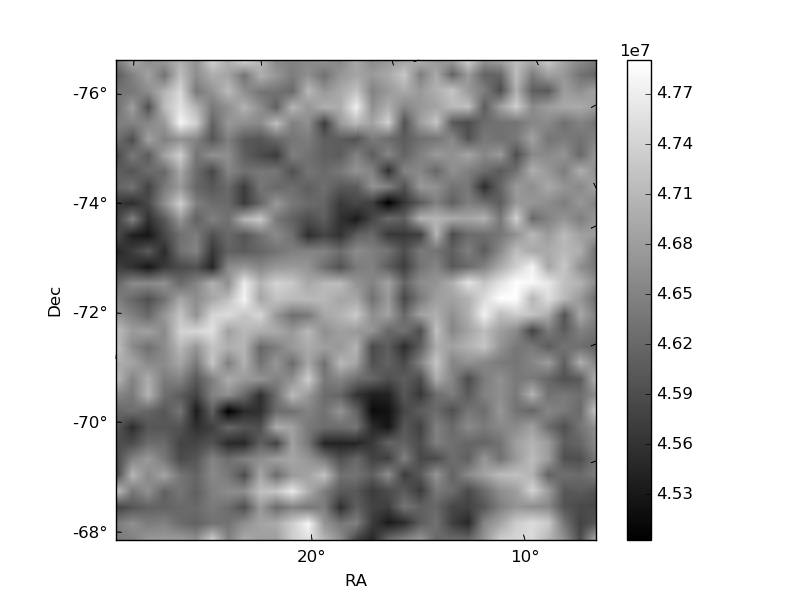
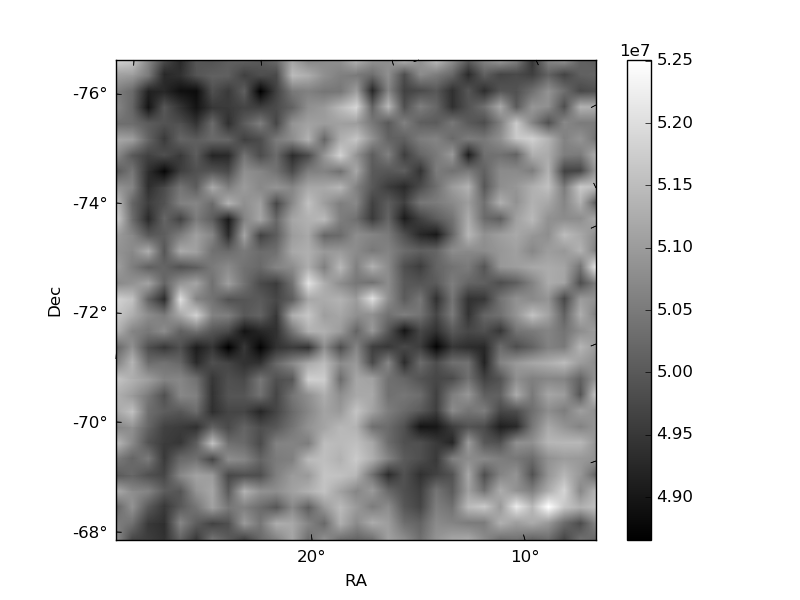
Histogram calculated using DETX and DETY for each event in the final _common_clean file
| Quadrant A | 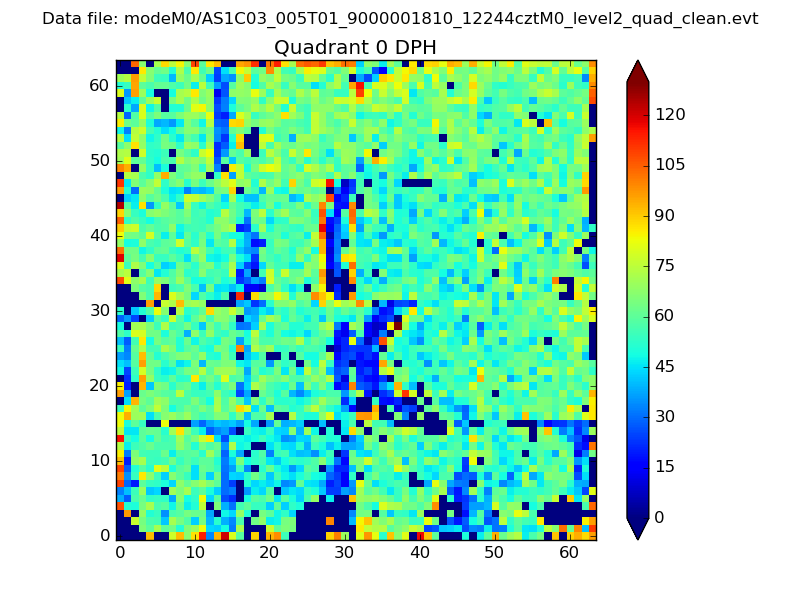 |
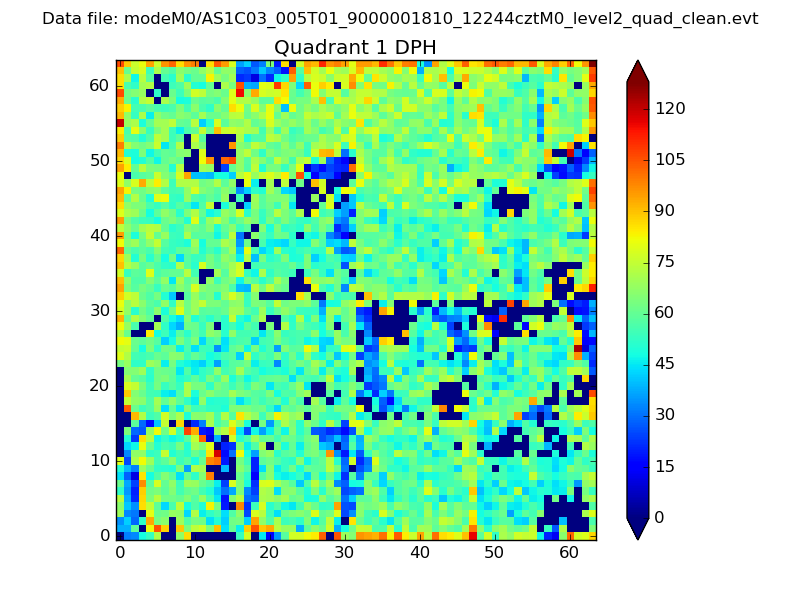 |
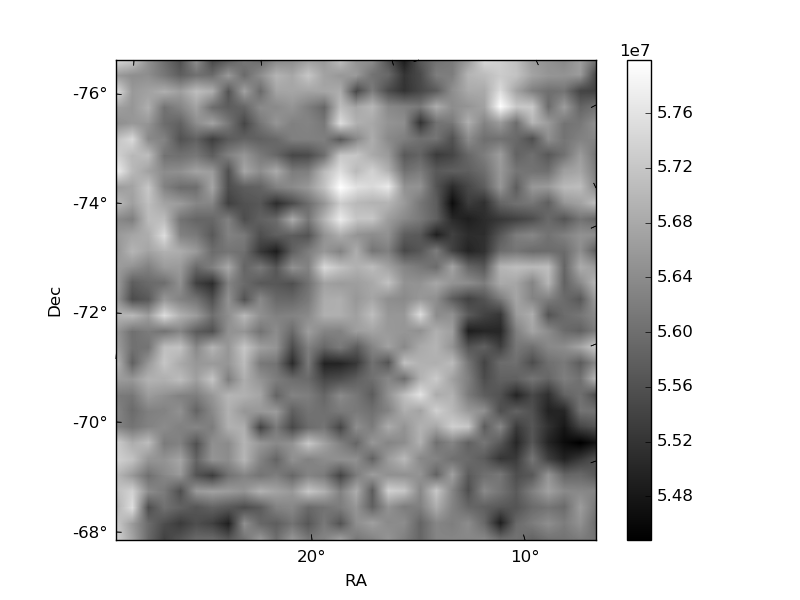
Quadrant B |
|---|---|---|---|
| Quadrant D | 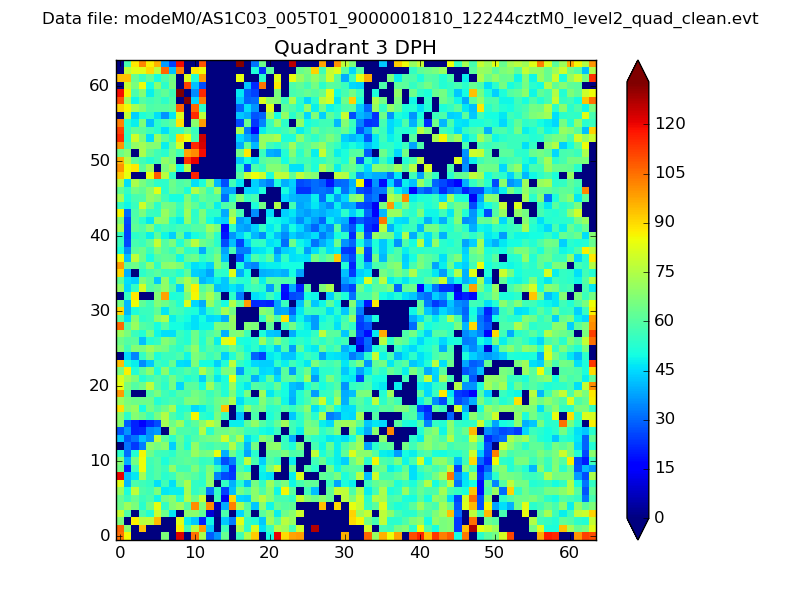 |
 |
Quadrant C |
| Plot type | Count rate plots | Images |
|---|---|---|
| Comparison with Poisson distribution Blue bars denote a histogram of data divided into 1 sec bins. Red curve is a Poisson curve with rate = median count rate of data. |
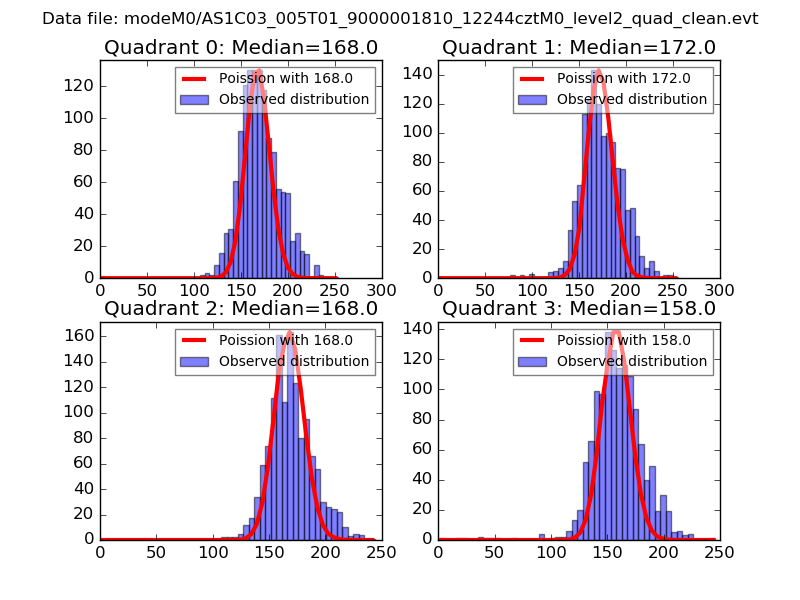 |
 |
| Quadrant-wise count rates Data is divided into 100 sec bins |
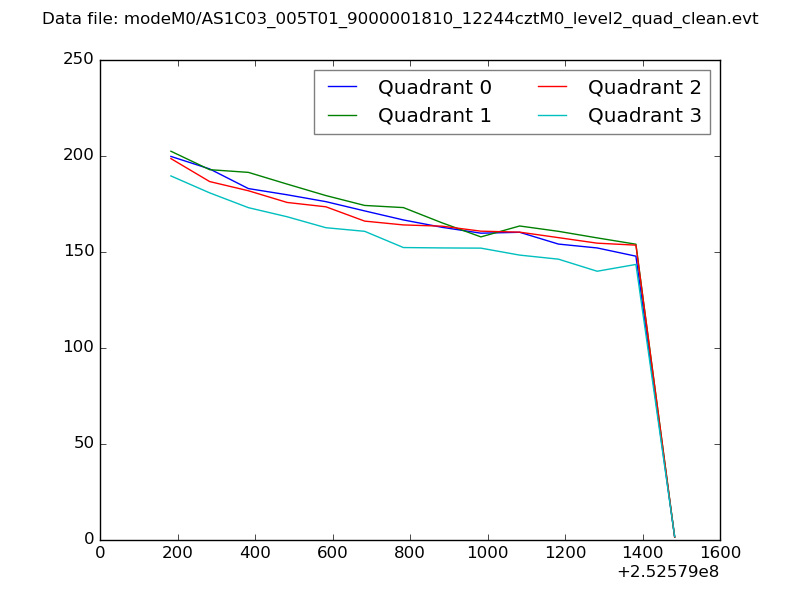 |
|
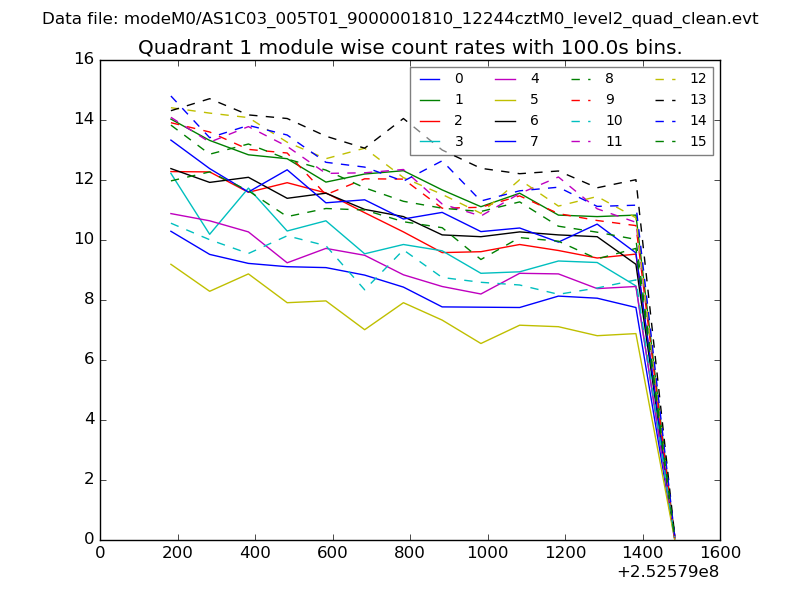
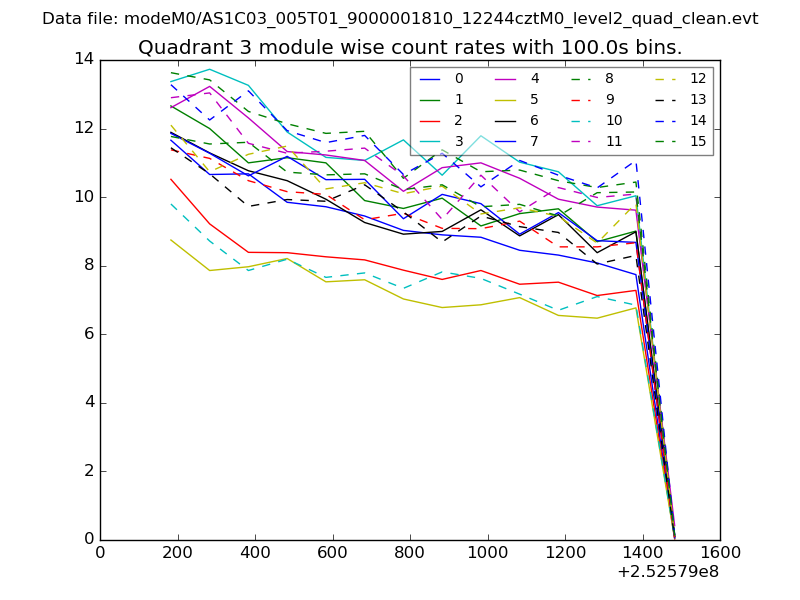
| Module-wise count rates for Quadrant A Data is divided into 100 sec bins |
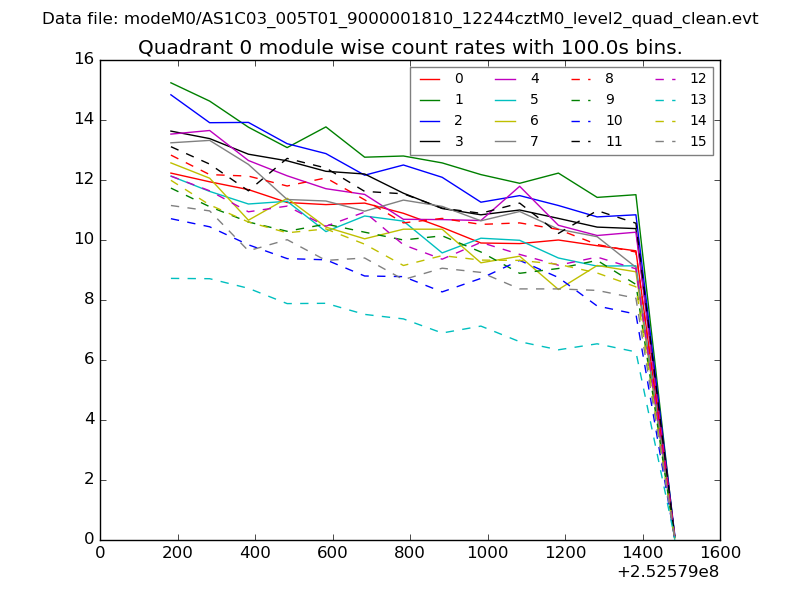 |
 |
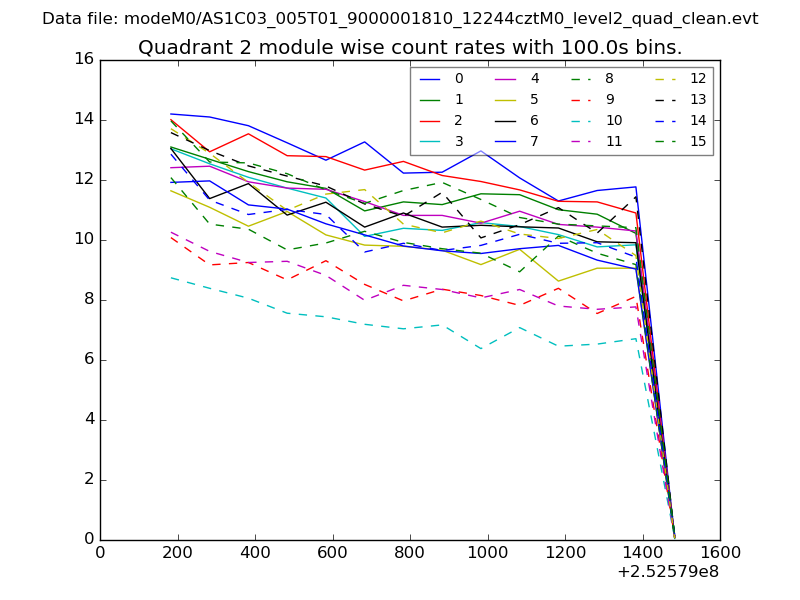
| Module-wise count rates for Quadrant B Data is divided into 100 sec bins |
 |
 |
| Module-wise count rates for Quadrant C Data is divided into 100 sec bins |
 |
 |
| Module-wise count rates for Quadrant D Data is divided into 100 sec bins |
 |
 |
| Parameter | Plot |
|---|---|
| CZT HV Monitor | 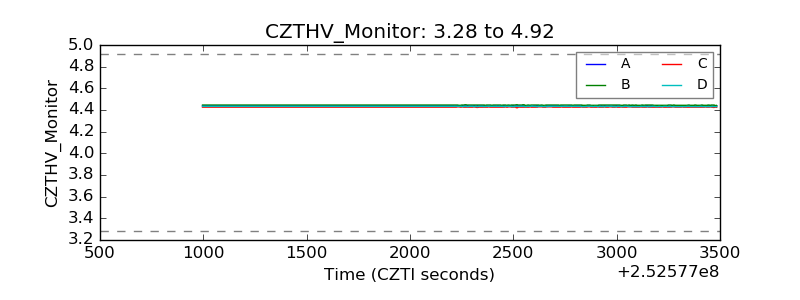 |
| D_VDD | 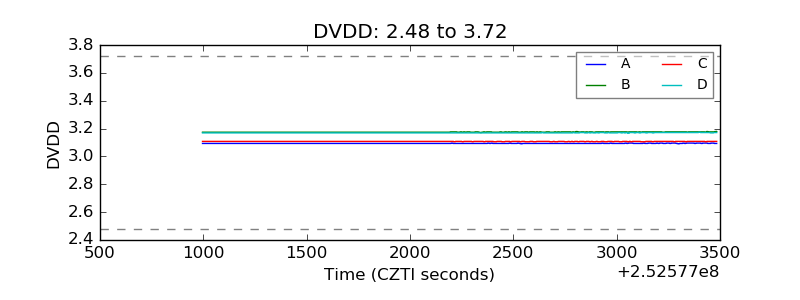 |
| Temperature 1 | 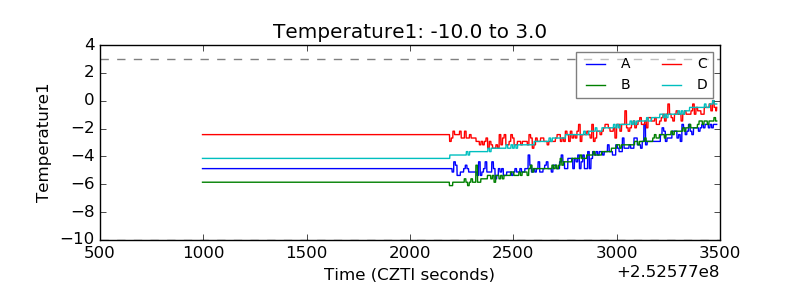 |
| Veto HV Monitor |  |
| Veto LLD | 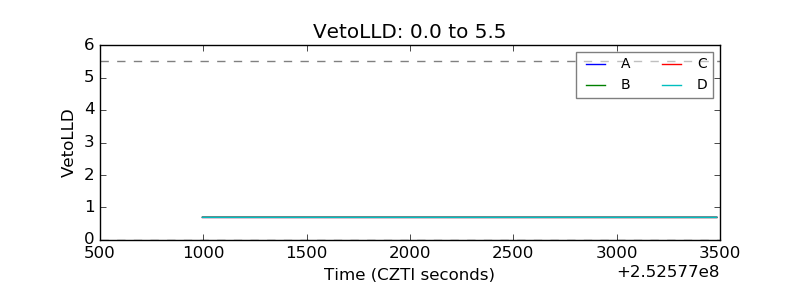 |
| Alpha Counter | 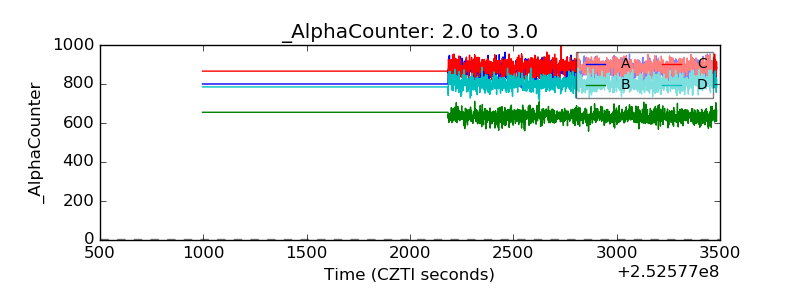 |
| _CPM_Rate | 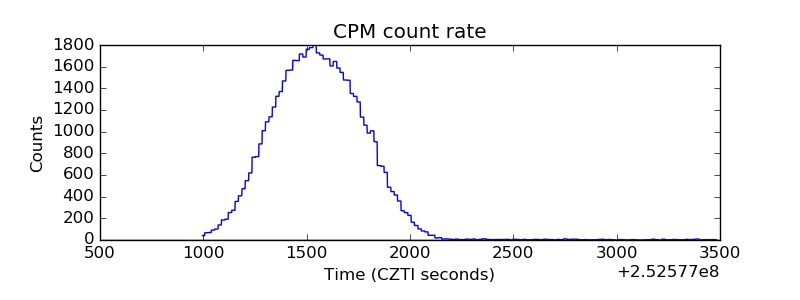 |
| CZT Counter | 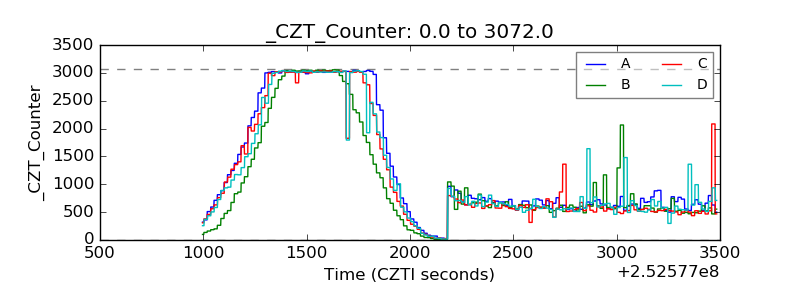 |
| +2.5 Volts monitor |  |
| +5 Volts monitor |  |
| _ROLL_ROT | 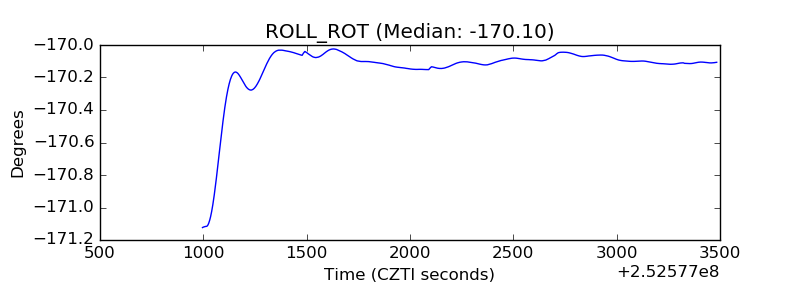 |
| _Roll_DEC | 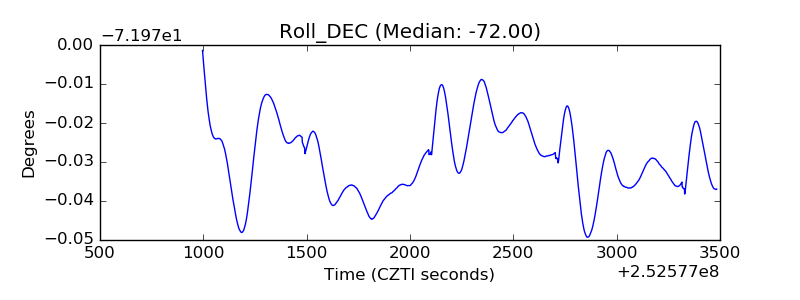 |
| _Roll_RA | 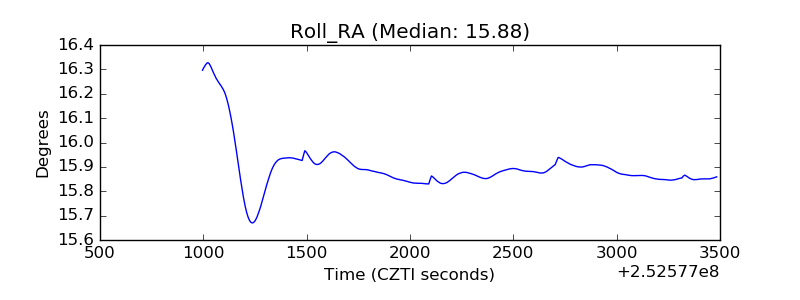 |
| Veto Counter | 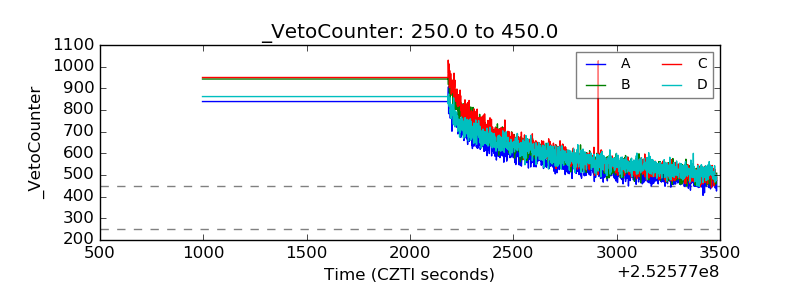 |