| Param | Original file | Final file |
|---|---|---|
| Filename | modeM0/AS1C03_005T01_9000001810_12245cztM0_level2.evt | modeM0/AS1C03_005T01_9000001810_12245cztM0_level2_quad_clean.evt |
| Size (bytes) | 541,287,360 | 136,080,000 |
| Size | 516.2 MB | 129.8 MB |
| Events in quadrant A | 4,212,467 | 936,543 |
| Events in quadrant B | 4,637,376 | 911,336 |
| Events in quadrant C | 3,506,051 | 932,057 |
| Events in quadrant D | 3,601,138 | 893,007 |
| Mode M0 | |||
|---|---|---|---|
| Quadrant | BADHDUFLAG | Total packets | Discarded packets |
| A | 0 | 17037 | 2 |
| B | 0 | 17980 | 1 |
| C | 0 | 14645 | 1 |
| D | 0 | 15009 | 1 |
| Mode SS | |||
|---|---|---|---|
| Quadrant | BADHDUFLAG | Total packets | Discarded packets |
| A | 0 | 130 | 0 |
| B | 0 | 130 | 0 |
| C | 0 | 130 | 0 |
| D | 0 | 130 | 0 |
| Mode M9 | |||
|---|---|---|---|
| Quadrant | BADHDUFLAG | Total packets | Discarded packets |
| A | 0 | 13 | 0 |
| B | 0 | 13 | 0 |
| C | 0 | 13 | 0 |
| D | 0 | 13 | 0 |
| Quadrant | Total seconds | Saturated seconds | Saturation percentage |
|---|---|---|---|
| A | 6429 | 186 | 2.893140% |
| B | 6429 | 537 | 8.352776% |
| C | 6429 | 126 | 1.959869% |
| D | 6429 | 131 | 2.037642% |
Noise dominated data is calculated using 1-second bins in cleaned event files. If a bin has >2000 counts, and if more than 50% of those come from <1% of pixels, then it is considered to be noise-dominated and hence unusable.
| Quadrant | # 1 sec bins | Bins with >0 counts | Bins with >2000 counts | High rate bins dominated by noise | Noise dominated (total time) | Noise dominated (detector-on time) | Marked lightcurve |
|---|---|---|---|---|---|---|---|
| A | 7715 | 6431 | 33 | 33 | 0.43% | 0.51% | 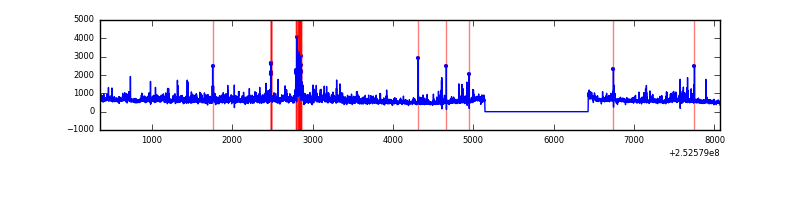 |
| B | 7715 | 6431 | 255 | 255 | 3.31% | 3.97% | 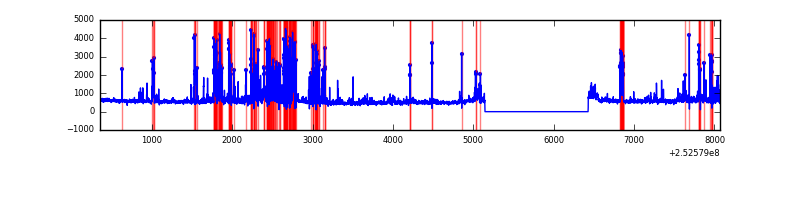 |
| C | 7715 | 6431 | 22 | 22 | 0.29% | 0.34% | 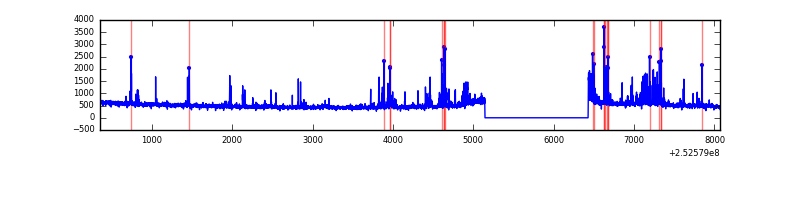 |
| D | 7715 | 6431 | 42 | 42 | 0.54% | 0.65% | 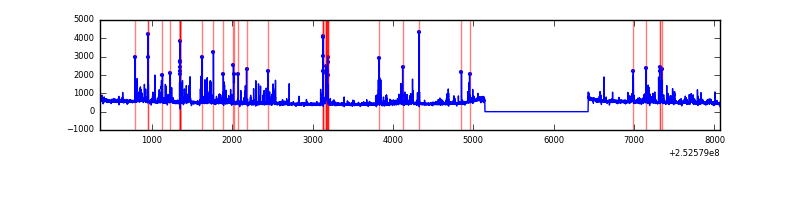 |
Top three noisy pixels from each quadrant. If the there are fewer than three noisy pixels in the level2.evt file, extra rows are filled as -1
| Pixel properties | Quadrant properties | ||||||
|---|---|---|---|---|---|---|---|
| Quadrant | DetID | PixID | Counts | Sigma | Mean | Median | Sigma |
| A | 13 | 251 | 370107 | 2233.02 | 828 | 814 | 165.4 |
| A | 1 | 162 | 187965 | 1131.65 | 828 | 814 | 165.4 |
| A | 1 | 178 | 108621 | 651.88 | 828 | 814 | 165.4 |
| B | 4 | 239 | 1169334 | 8074.26 | 794 | 779 | 144.7 |
| B | 11 | 51 | 156349 | 1074.93 | 794 | 779 | 144.7 |
| B | 0 | 229 | 49039 | 333.46 | 794 | 779 | 144.7 |
| C | 15 | 208 | 328730 | 1833.19 | 793 | 798 | 178.9 |
| C | 1 | 16 | 45300 | 248.77 | 793 | 798 | 178.9 |
| C | 4 | 175 | 31645 | 172.44 | 793 | 798 | 178.9 |
| D | 1 | 52 | 245545 | 1308.68 | 799 | 779 | 187.0 |
| D | 7 | 71 | 98946 | 524.87 | 799 | 779 | 187.0 |
| D | 13 | 104 | 65192 | 344.4 | 799 | 779 | 187.0 |
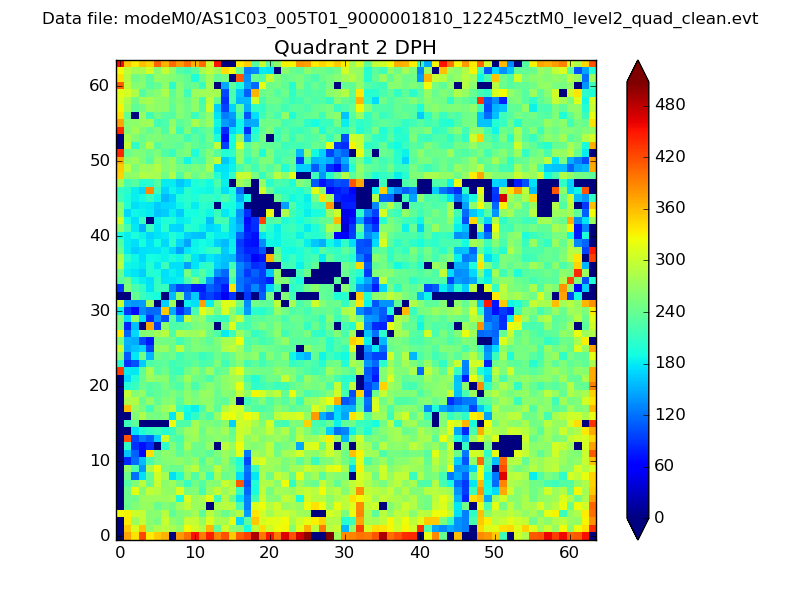
Histogram calculated using DETX and DETY for each event in the final _common_clean file
| Quadrant A | 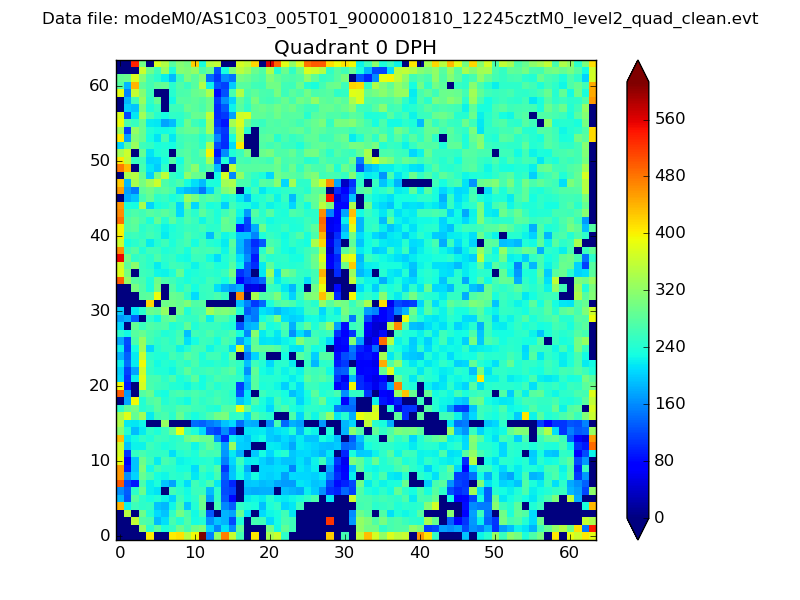 |
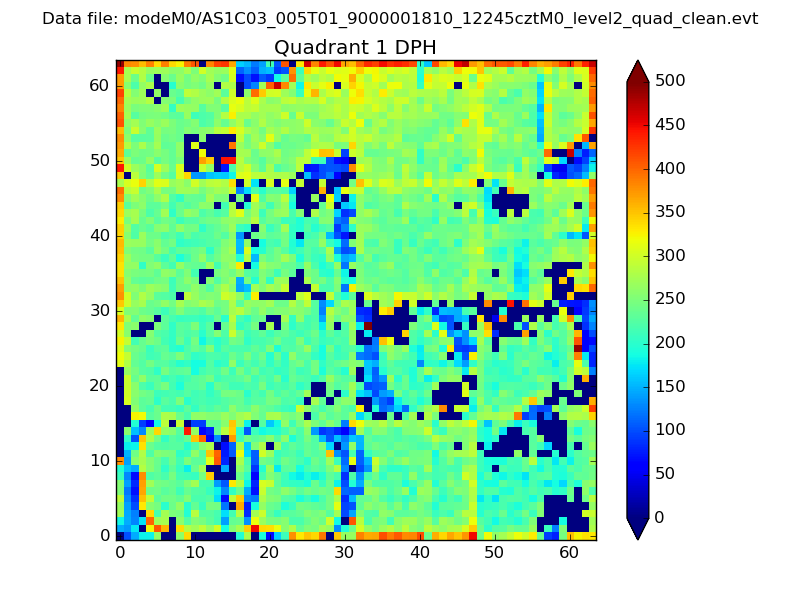 |
Quadrant B |
|---|---|---|---|
| Quadrant D | 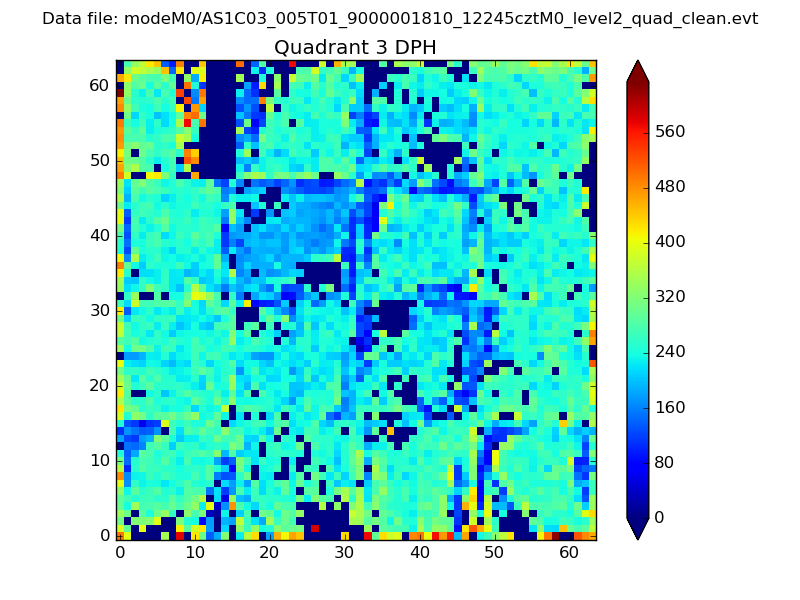 |
 |
Quadrant C |
| Plot type | Count rate plots | Images |
|---|---|---|
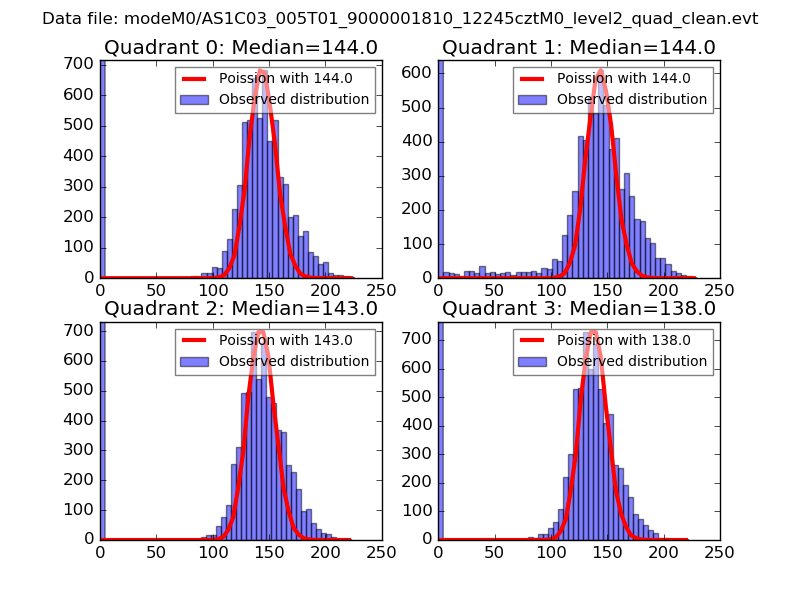
| Comparison with Poisson distribution Blue bars denote a histogram of data divided into 1 sec bins. Red curve is a Poisson curve with rate = median count rate of data. |
 |
 |
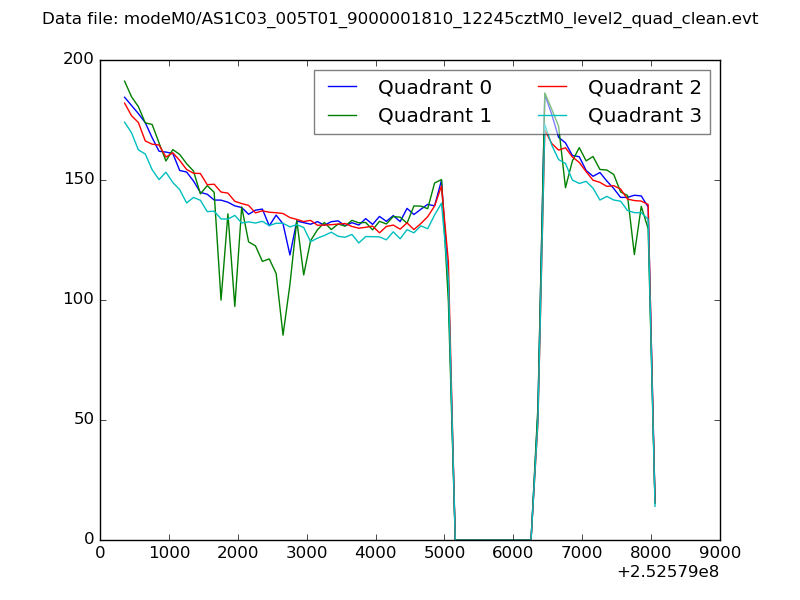
| Quadrant-wise count rates Data is divided into 100 sec bins |
 |
|
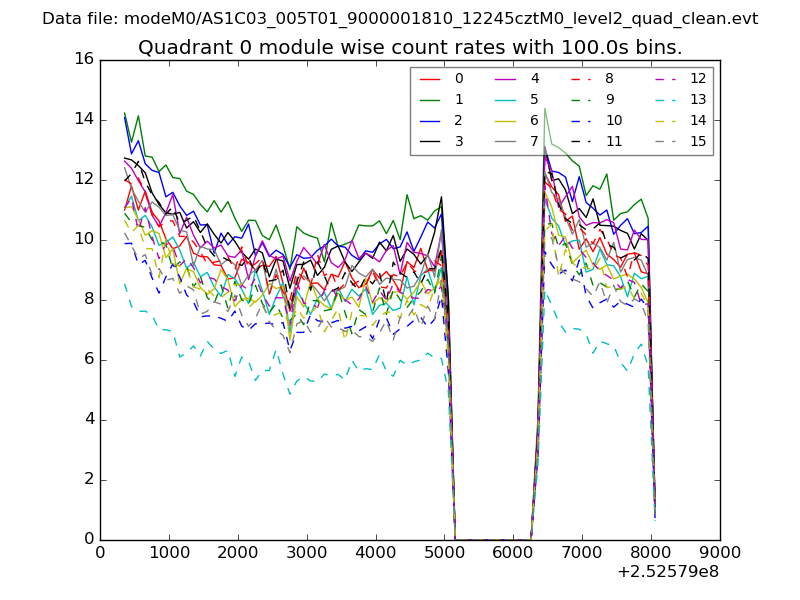
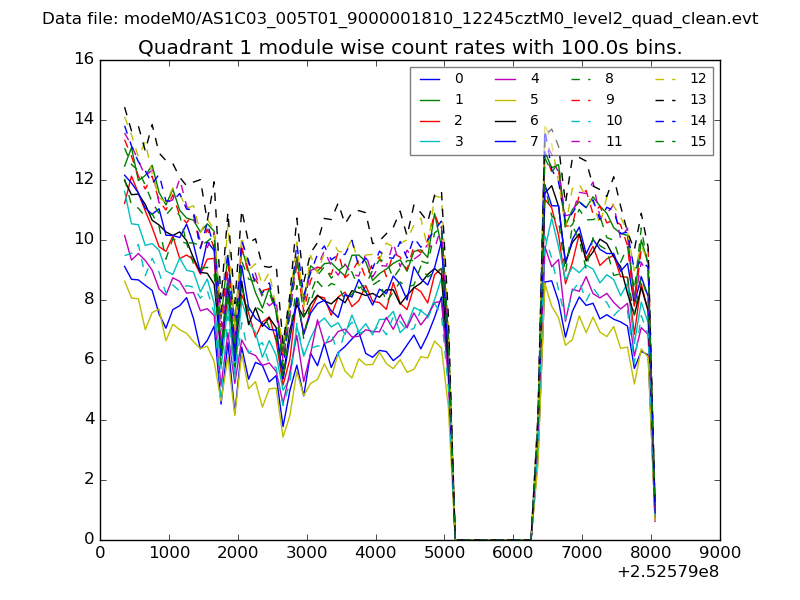
| Module-wise count rates for Quadrant A Data is divided into 100 sec bins |
 |
 |
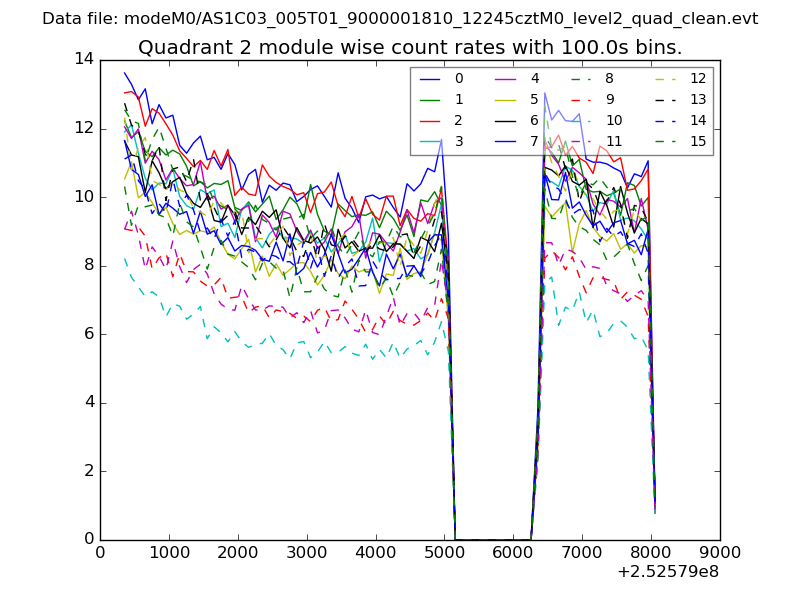
| Module-wise count rates for Quadrant B Data is divided into 100 sec bins |
 |
 |
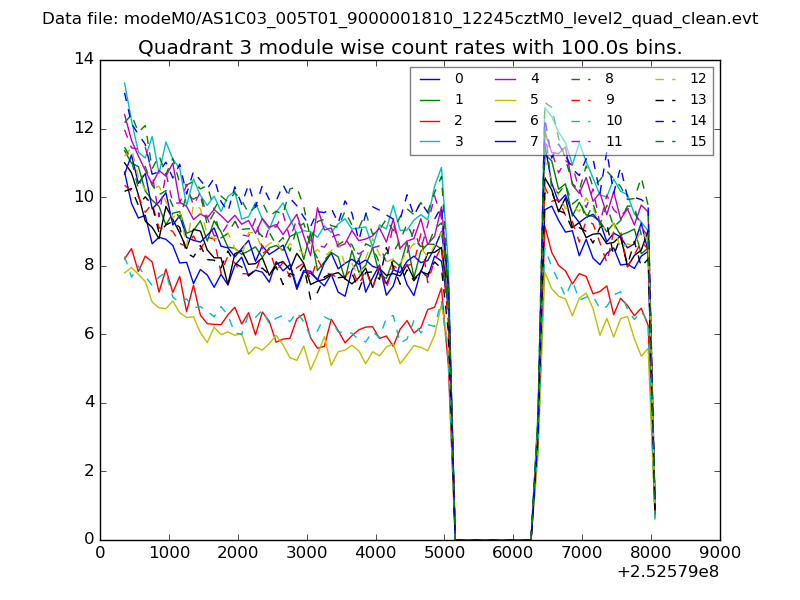
| Module-wise count rates for Quadrant C Data is divided into 100 sec bins |
 |
 |
| Module-wise count rates for Quadrant D Data is divided into 100 sec bins |
 |
 |
| Parameter | Plot |
|---|---|
| CZT HV Monitor | 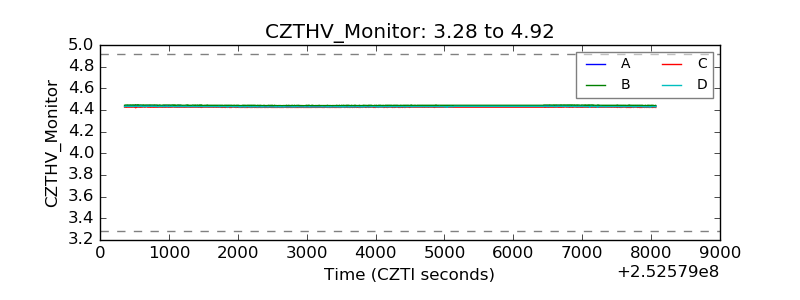 |
| D_VDD | 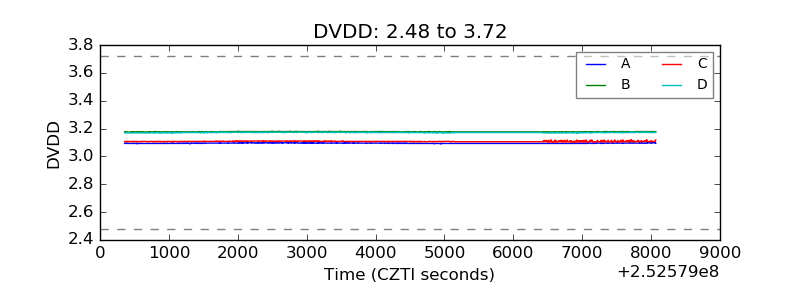 |
| Temperature 1 | 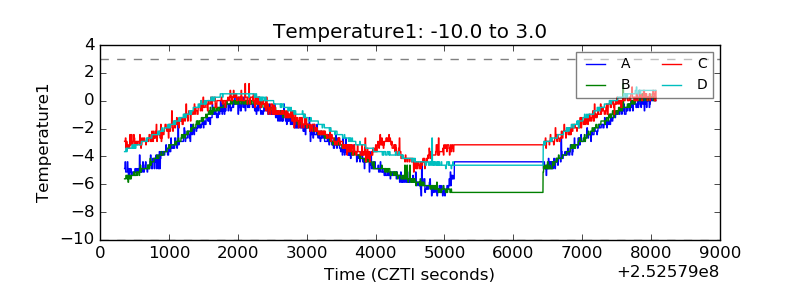 |
| Veto HV Monitor | 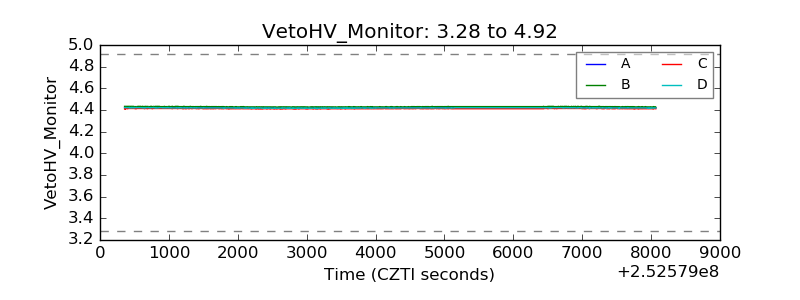 |
| Veto LLD | 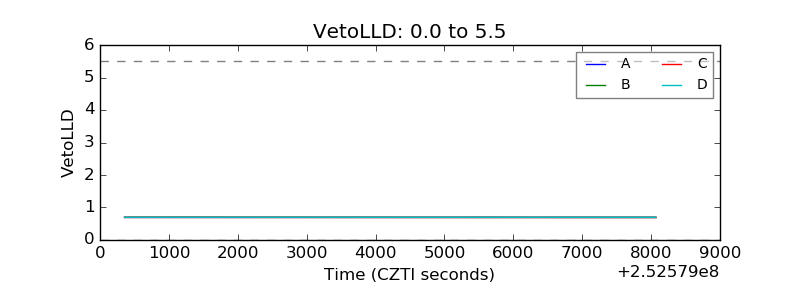 |
| Alpha Counter | 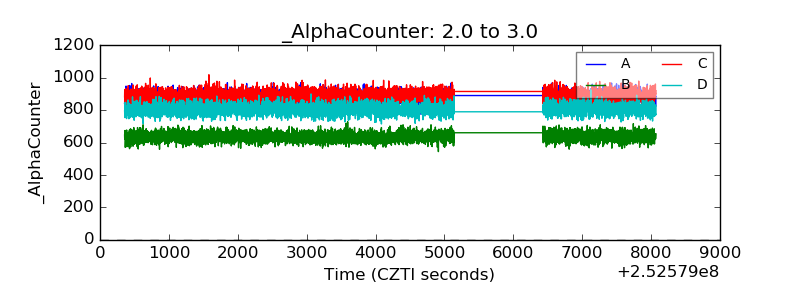 |
| _CPM_Rate | 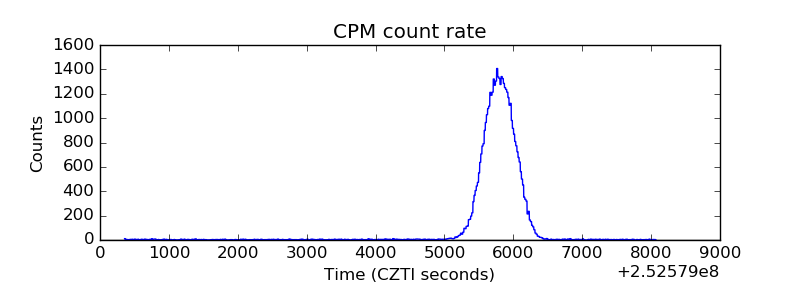 |
| CZT Counter | 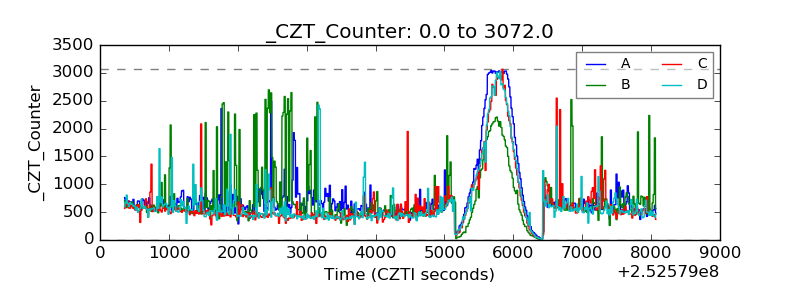 |
| +2.5 Volts monitor |  |
| +5 Volts monitor |  |
| _ROLL_ROT | 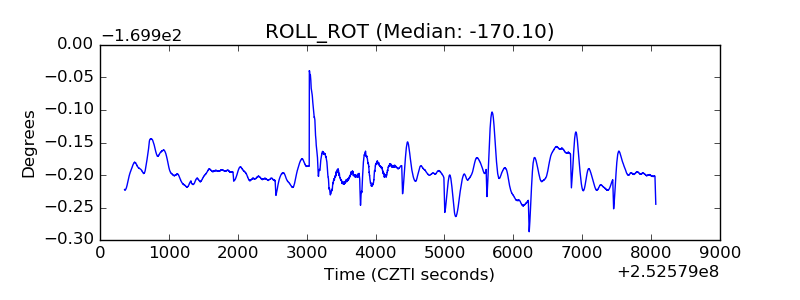 |
| _Roll_DEC | 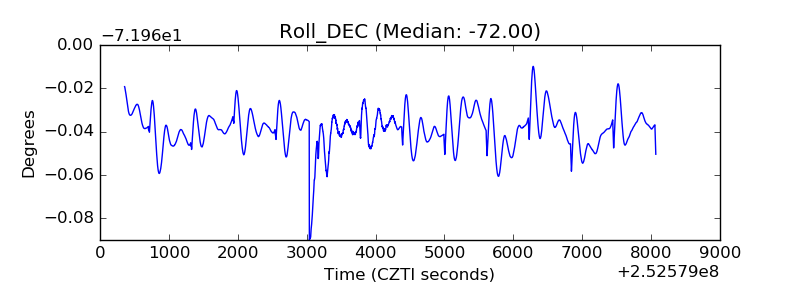 |
| _Roll_RA | 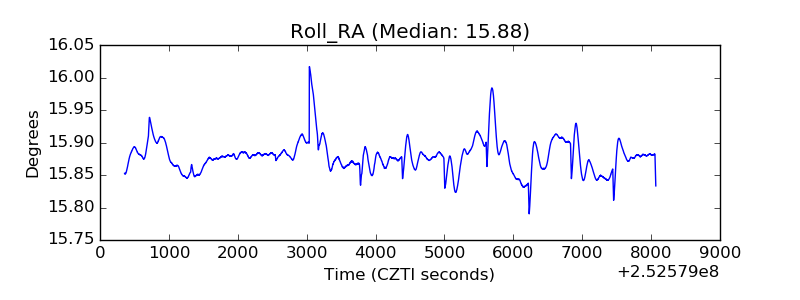 |
| Veto Counter | 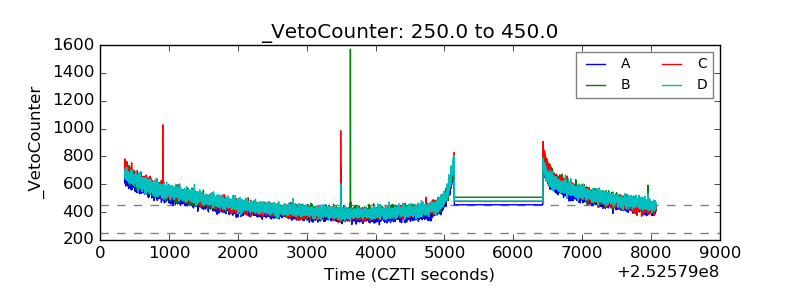 |