| Param | Original file | Final file |
|---|---|---|
| Filename | modeM0/AS1C03_005T01_9000001810_12246cztM0_level2.evt | modeM0/AS1C03_005T01_9000001810_12246cztM0_level2_quad_clean.evt |
| Size (bytes) | 496,788,480 | 126,768,960 |
| Size | 473.8 MB | 120.9 MB |
| Events in quadrant A | 3,862,554 | 864,384 |
| Events in quadrant B | 4,130,511 | 857,243 |
| Events in quadrant C | 3,314,434 | 854,672 |
| Events in quadrant D | 3,313,609 | 826,851 |
| Mode M0 | |||
|---|---|---|---|
| Quadrant | BADHDUFLAG | Total packets | Discarded packets |
| A | 0 | 15687 | 2 |
| B | 0 | 16398 | 1 |
| C | 0 | 14021 | 1 |
| D | 0 | 14035 | 1 |
| Mode SS | |||
|---|---|---|---|
| Quadrant | BADHDUFLAG | Total packets | Discarded packets |
| A | 0 | 128 | 0 |
| B | 0 | 128 | 0 |
| C | 0 | 128 | 0 |
| D | 0 | 128 | 0 |
| Mode M9 | |||
|---|---|---|---|
| Quadrant | BADHDUFLAG | Total packets | Discarded packets |
| A | 0 | 12 | 0 |
| B | 0 | 12 | 0 |
| C | 0 | 12 | 0 |
| D | 0 | 12 | 0 |
| Quadrant | Total seconds | Saturated seconds | Saturation percentage |
|---|---|---|---|
| A | 6246 | 167 | 2.673711% |
| B | 6246 | 368 | 5.891771% |
| C | 6246 | 111 | 1.777137% |
| D | 6246 | 111 | 1.777137% |
Noise dominated data is calculated using 1-second bins in cleaned event files. If a bin has >2000 counts, and if more than 50% of those come from <1% of pixels, then it is considered to be noise-dominated and hence unusable.
| Quadrant | # 1 sec bins | Bins with >0 counts | Bins with >2000 counts | High rate bins dominated by noise | Noise dominated (total time) | Noise dominated (detector-on time) | Marked lightcurve |
|---|---|---|---|---|---|---|---|
| A | 7477 | 6248 | 23 | 23 | 0.31% | 0.37% | 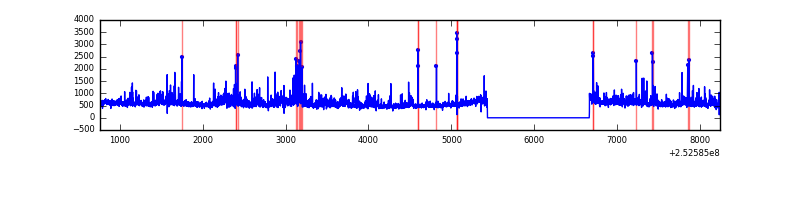 |
| B | 7477 | 6248 | 191 | 191 | 2.55% | 3.06% |  |
| C | 7477 | 6248 | 40 | 40 | 0.53% | 0.64% |  |
| D | 7477 | 6248 | 35 | 35 | 0.47% | 0.56% | 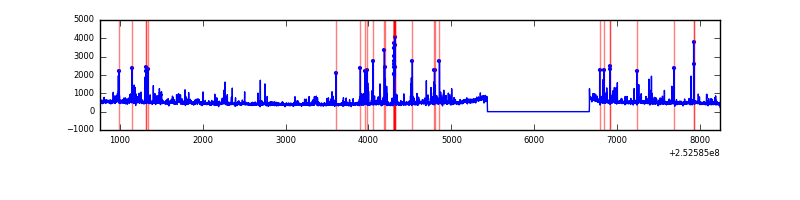 |
Top three noisy pixels from each quadrant. If the there are fewer than three noisy pixels in the level2.evt file, extra rows are filled as -1
| Pixel properties | Quadrant properties | ||||||
|---|---|---|---|---|---|---|---|
| Quadrant | DetID | PixID | Counts | Sigma | Mean | Median | Sigma |
| A | 13 | 251 | 478598 | 3073.54 | 772 | 757 | 155.5 |
| A | 1 | 162 | 120491 | 770.15 | 772 | 757 | 155.5 |
| A | 1 | 178 | 66542 | 423.14 | 772 | 757 | 155.5 |
| B | 4 | 239 | 809972 | 5801.31 | 755 | 736 | 139.5 |
| B | 11 | 51 | 151255 | 1079.05 | 755 | 736 | 139.5 |
| B | 4 | 80 | 37718 | 265.12 | 755 | 736 | 139.5 |
| C | 15 | 208 | 354361 | 2132.49 | 736 | 741 | 165.8 |
| C | 4 | 175 | 33070 | 194.96 | 736 | 741 | 165.8 |
| C | 1 | 16 | 22396 | 130.59 | 736 | 741 | 165.8 |
| D | 1 | 52 | 161812 | 905.98 | 745 | 723 | 177.8 |
| D | 13 | 104 | 96121 | 536.53 | 745 | 723 | 177.8 |
| D | 10 | 199 | 70388 | 391.8 | 745 | 723 | 177.8 |
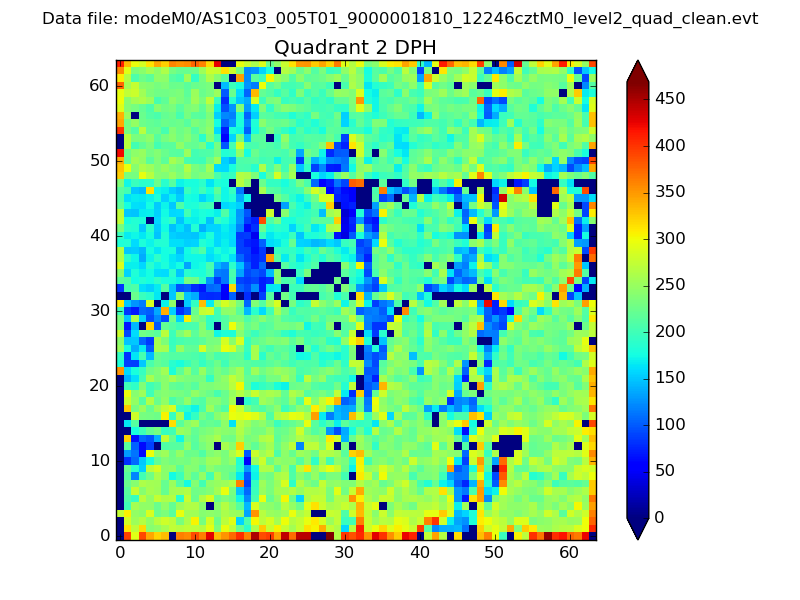
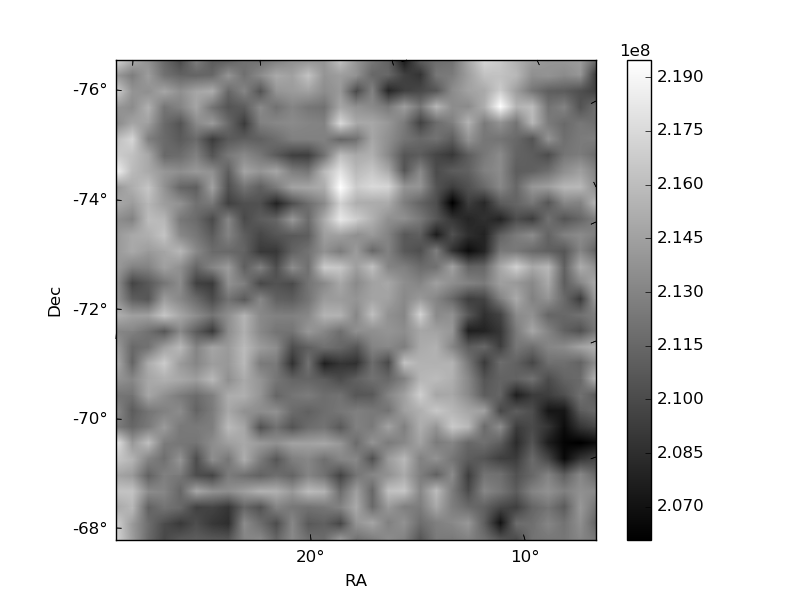
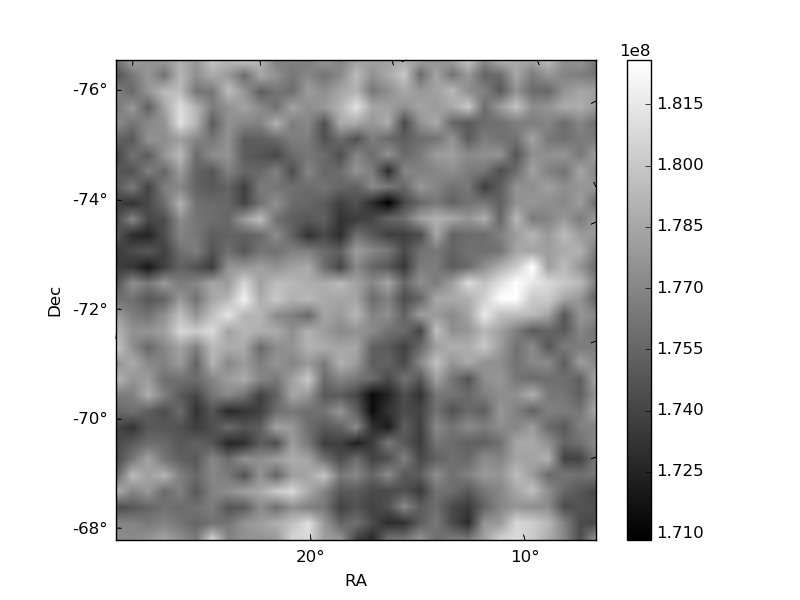
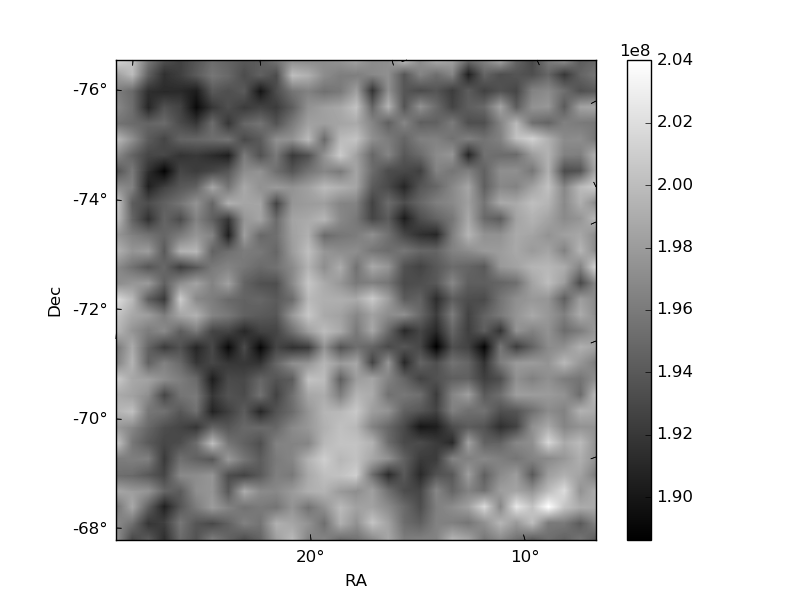
Histogram calculated using DETX and DETY for each event in the final _common_clean file
| Quadrant A | 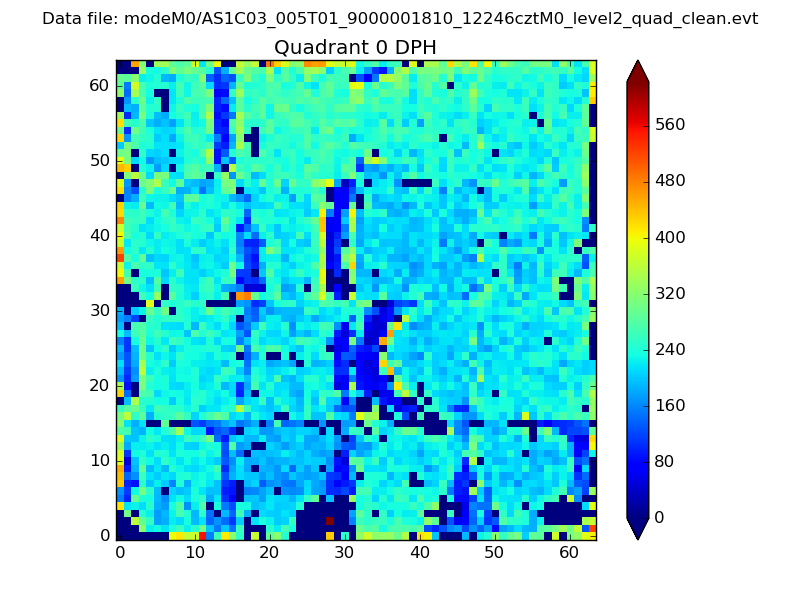 |
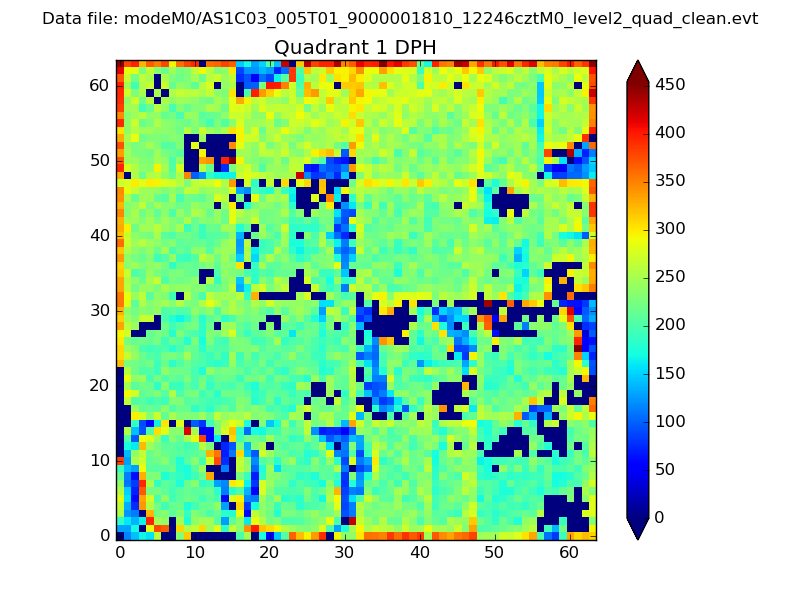 |
Quadrant B |
|---|---|---|---|
| Quadrant D | 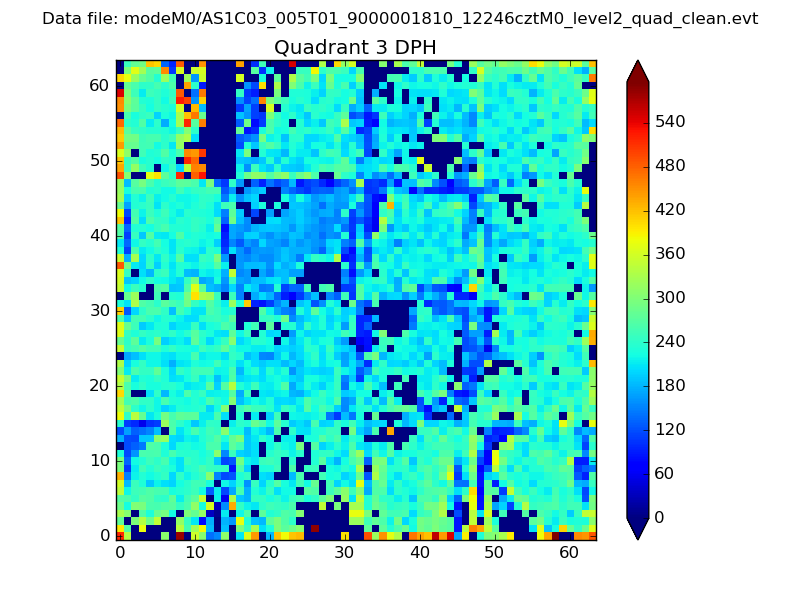 |
 |
Quadrant C |
| Plot type | Count rate plots | Images |
|---|---|---|
| Comparison with Poisson distribution Blue bars denote a histogram of data divided into 1 sec bins. Red curve is a Poisson curve with rate = median count rate of data. |
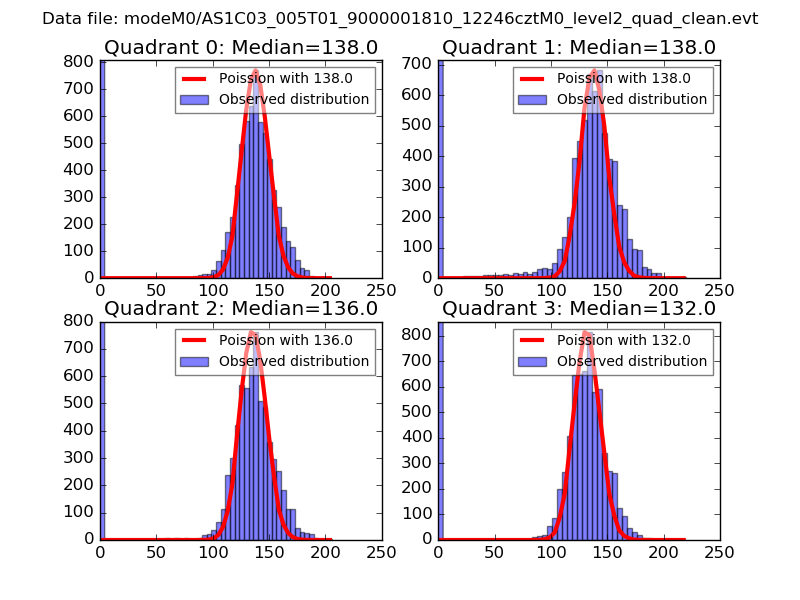 |
 |
| Quadrant-wise count rates Data is divided into 100 sec bins |
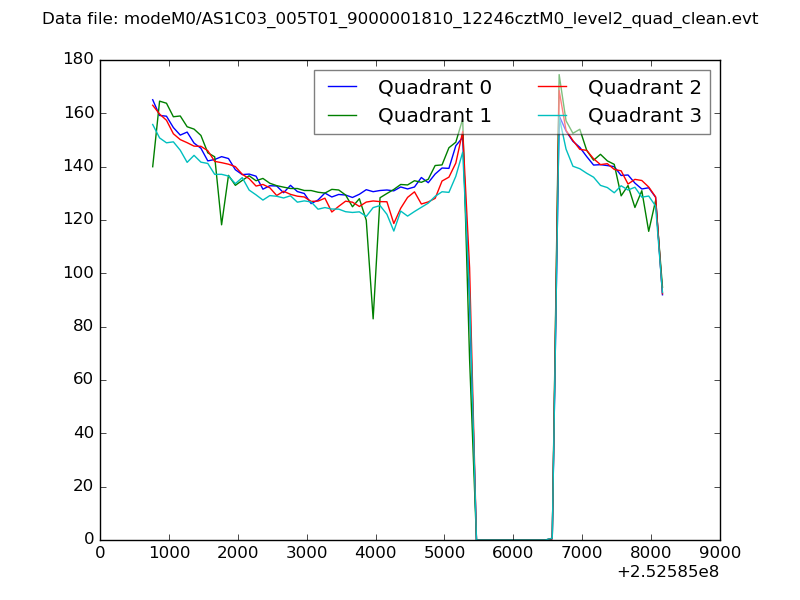 |
|
| Module-wise count rates for Quadrant A Data is divided into 100 sec bins |
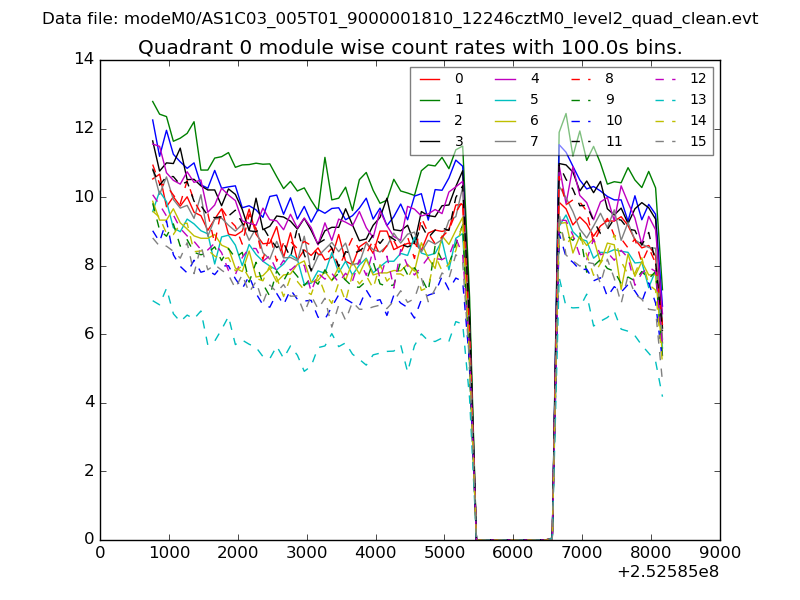 |
 |
| Module-wise count rates for Quadrant B Data is divided into 100 sec bins |
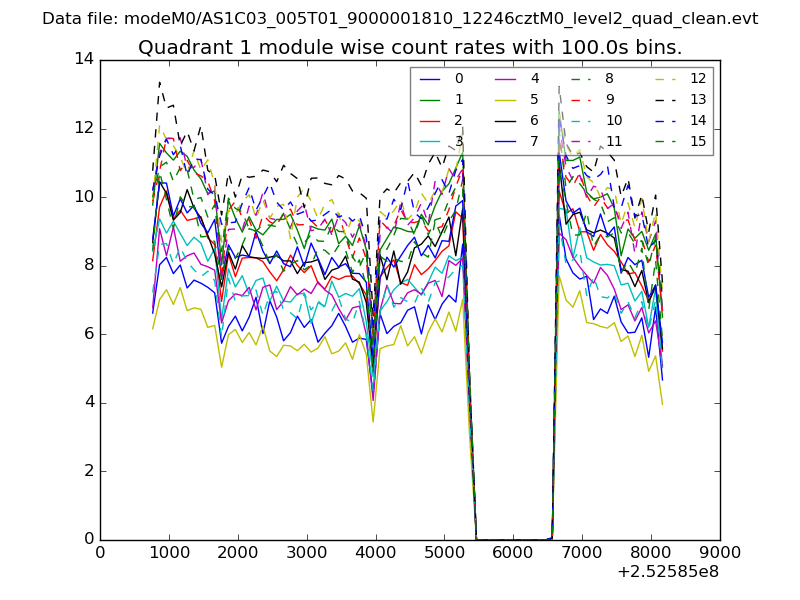 |
 |
| Module-wise count rates for Quadrant C Data is divided into 100 sec bins |
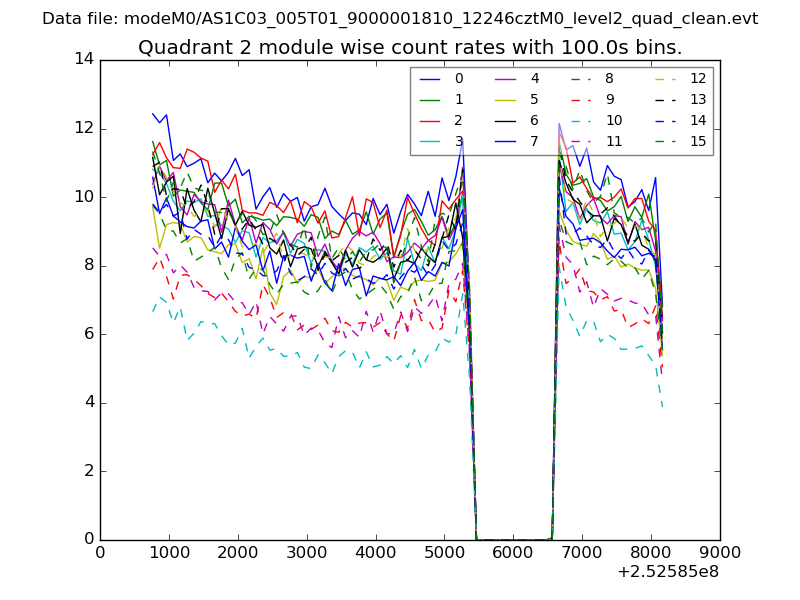 |
 |
| Module-wise count rates for Quadrant D Data is divided into 100 sec bins |
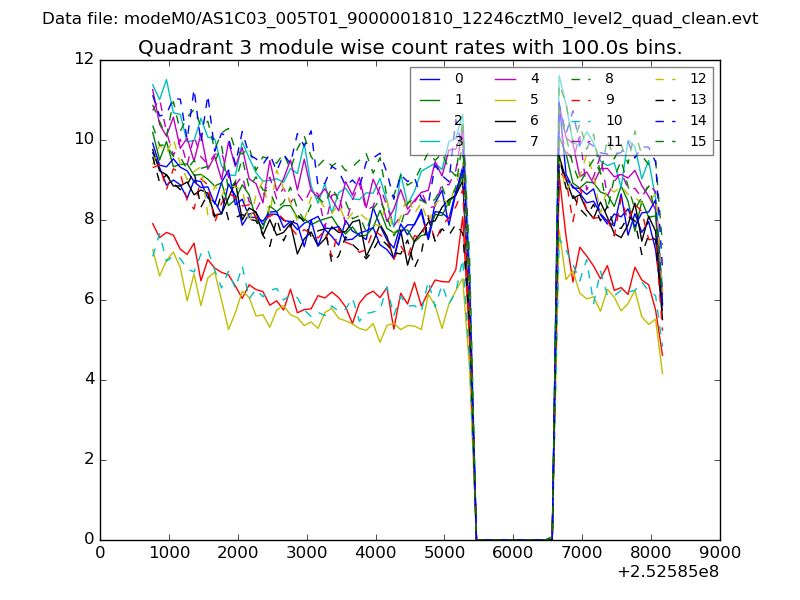 |
 |
| Parameter | Plot |
|---|---|
| CZT HV Monitor | 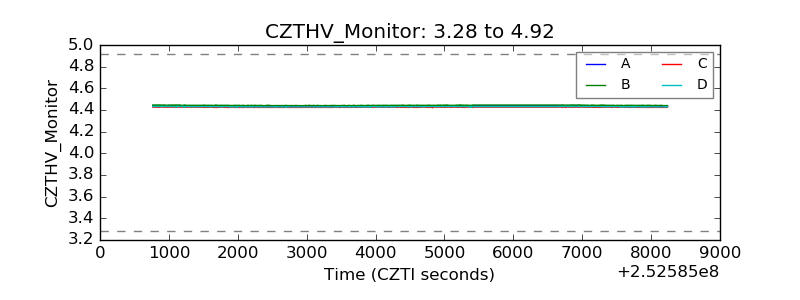 |
| D_VDD | 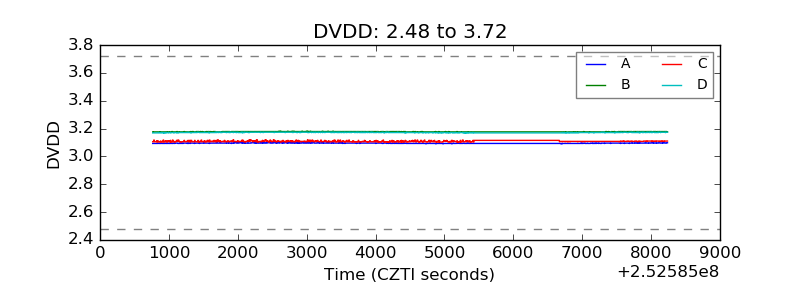 |
| Temperature 1 | 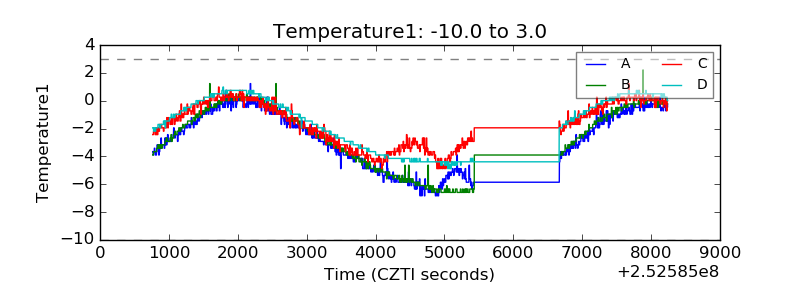 |
| Veto HV Monitor | 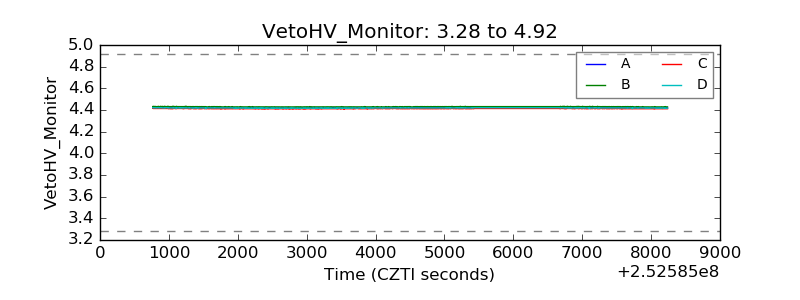 |
| Veto LLD | 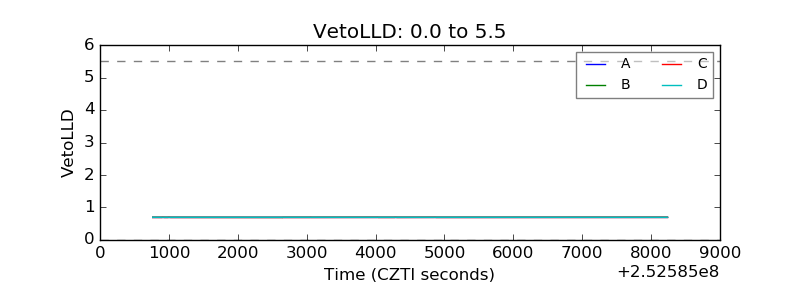 |
| Alpha Counter | 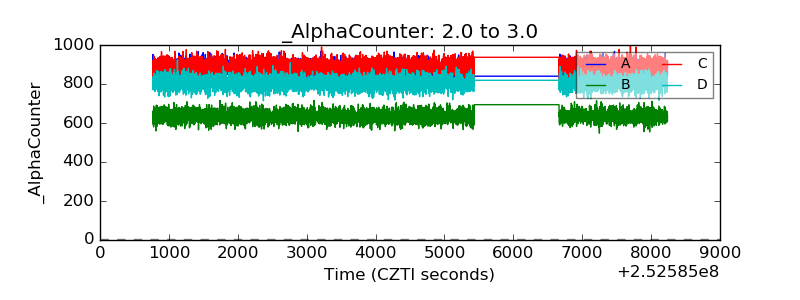 |
| _CPM_Rate | 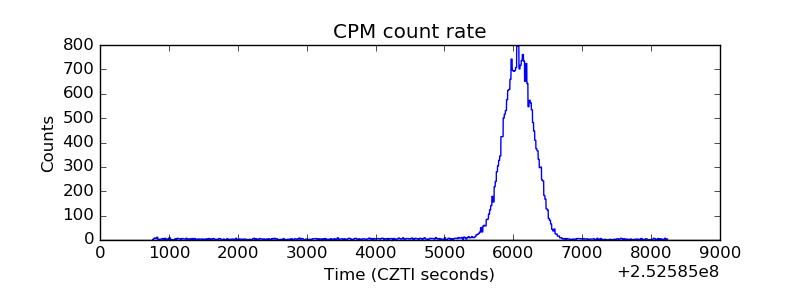 |
| CZT Counter | 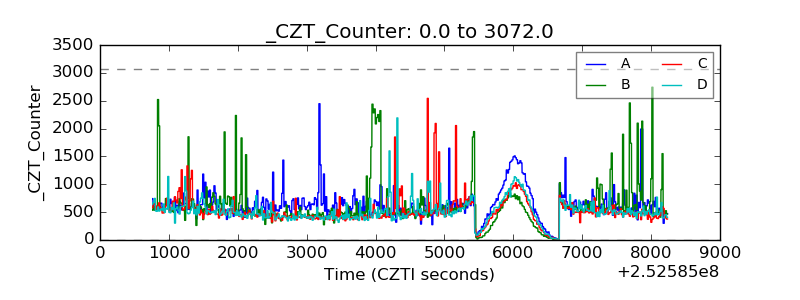 |
| +2.5 Volts monitor | 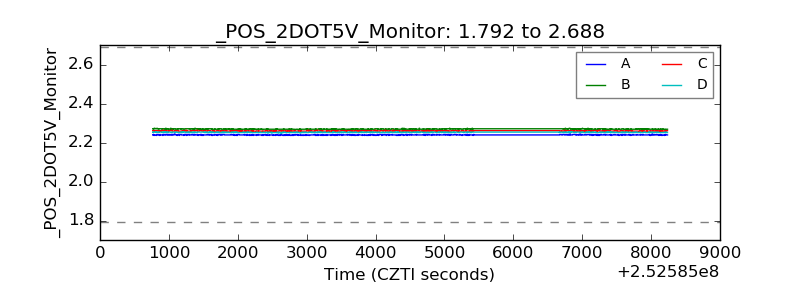 |
| +5 Volts monitor |  |
| _ROLL_ROT | 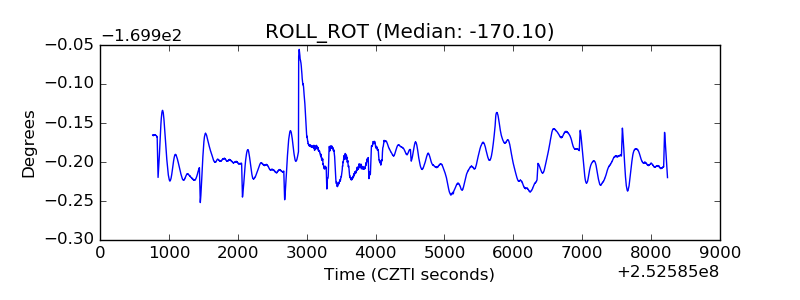 |
| _Roll_DEC | 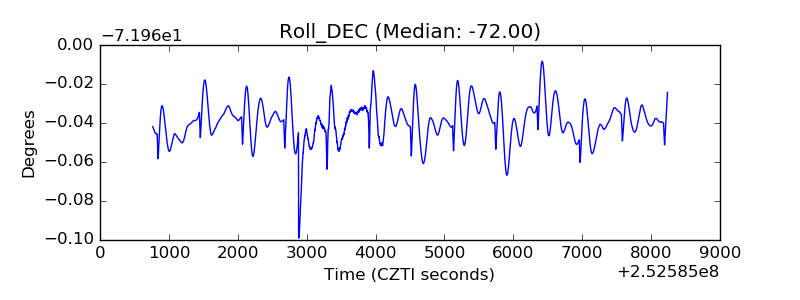 |
| _Roll_RA | 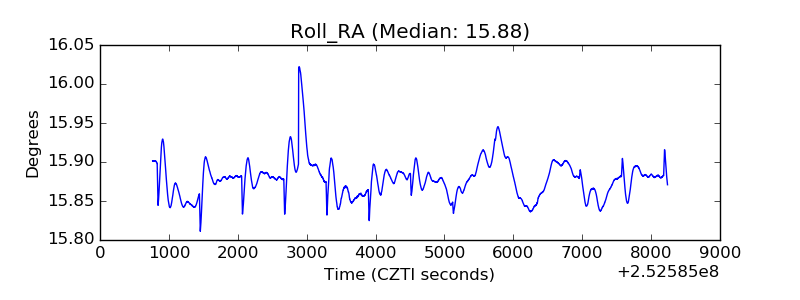 |
| Veto Counter | 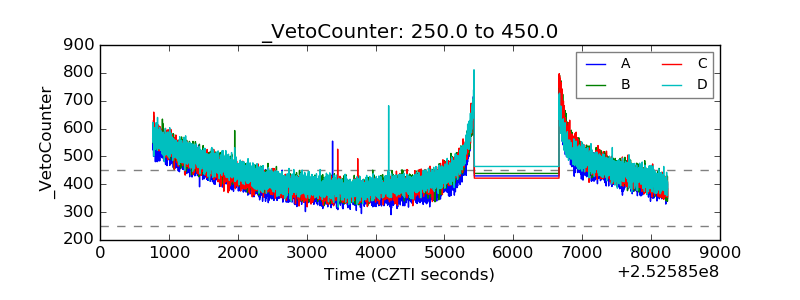 |