| Param | Original file | Final file |
|---|---|---|
| Filename | modeM0/AS1C03_005T01_9000001810_12247cztM0_level2.evt | modeM0/AS1C03_005T01_9000001810_12247cztM0_level2_quad_clean.evt |
| Size (bytes) | 444,219,840 | 114,549,120 |
| Size | 423.6 MB | 109.2 MB |
| Events in quadrant A | 3,858,821 | 768,285 |
| Events in quadrant B | 3,390,874 | 774,057 |
| Events in quadrant C | 2,709,019 | 767,120 |
| Events in quadrant D | 3,087,555 | 741,482 |
| Mode M0 | |||
|---|---|---|---|
| Quadrant | BADHDUFLAG | Total packets | Discarded packets |
| A | 0 | 15381 | 2 |
| B | 0 | 14033 | 1 |
| C | 0 | 12284 | 1 |
| D | 0 | 13376 | 1 |
| Mode SS | |||
|---|---|---|---|
| Quadrant | BADHDUFLAG | Total packets | Discarded packets |
| A | 0 | 122 | 0 |
| B | 0 | 122 | 0 |
| C | 0 | 122 | 0 |
| D | 0 | 122 | 0 |
| Mode M9 | |||
|---|---|---|---|
| Quadrant | BADHDUFLAG | Total packets | Discarded packets |
| A | 0 | 11 | 0 |
| B | 0 | 11 | 0 |
| C | 0 | 11 | 0 |
| D | 0 | 11 | 0 |
| Quadrant | Total seconds | Saturated seconds | Saturation percentage |
|---|---|---|---|
| A | 5988 | 216 | 3.607214% |
| B | 5988 | 205 | 3.423514% |
| C | 5988 | 33 | 0.551102% |
| D | 5988 | 76 | 1.269205% |
Noise dominated data is calculated using 1-second bins in cleaned event files. If a bin has >2000 counts, and if more than 50% of those come from <1% of pixels, then it is considered to be noise-dominated and hence unusable.
| Quadrant | # 1 sec bins | Bins with >0 counts | Bins with >2000 counts | High rate bins dominated by noise | Noise dominated (total time) | Noise dominated (detector-on time) | Marked lightcurve |
|---|---|---|---|---|---|---|---|
| A | 7009 | 5990 | 65 | 65 | 0.93% | 1.09% | 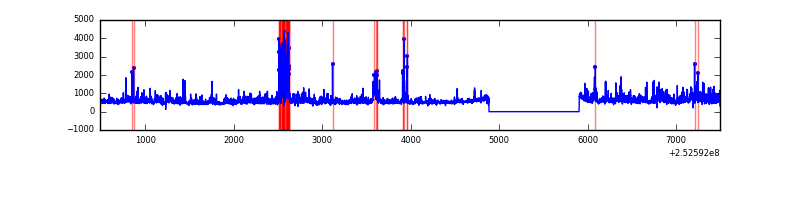 |
| B | 7009 | 5990 | 82 | 82 | 1.17% | 1.37% | 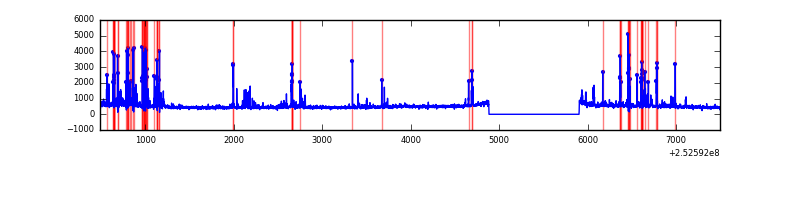 |
| C | 7009 | 5990 | 1 | 1 | 0.01% | 0.02% |  |
| D | 7009 | 5990 | 18 | 18 | 0.26% | 0.30% |  |
Top three noisy pixels from each quadrant. If the there are fewer than three noisy pixels in the level2.evt file, extra rows are filled as -1
| Pixel properties | Quadrant properties | ||||||
|---|---|---|---|---|---|---|---|
| Quadrant | DetID | PixID | Counts | Sigma | Mean | Median | Sigma |
| A | 13 | 251 | 350252 | 2473.97 | 698 | 683 | 141.3 |
| A | 5 | 16 | 235351 | 1660.79 | 698 | 683 | 141.3 |
| A | 1 | 162 | 176984 | 1247.72 | 698 | 683 | 141.3 |
| B | 4 | 239 | 347317 | 2661.33 | 698 | 682 | 130.2 |
| B | 3 | 64 | 74515 | 566.86 | 698 | 682 | 130.2 |
| B | 11 | 51 | 65874 | 500.52 | 698 | 682 | 130.2 |
| C | 4 | 175 | 32510 | 207.92 | 672 | 677 | 153.1 |
| C | 1 | 16 | 21030 | 132.93 | 672 | 677 | 153.1 |
| C | 15 | 208 | 15984 | 99.98 | 672 | 677 | 153.1 |
| D | 1 | 52 | 115787 | 716.96 | 675 | 656 | 160.6 |
| D | 13 | 104 | 75847 | 468.24 | 675 | 656 | 160.6 |
| D | 2 | 33 | 60490 | 372.61 | 675 | 656 | 160.6 |
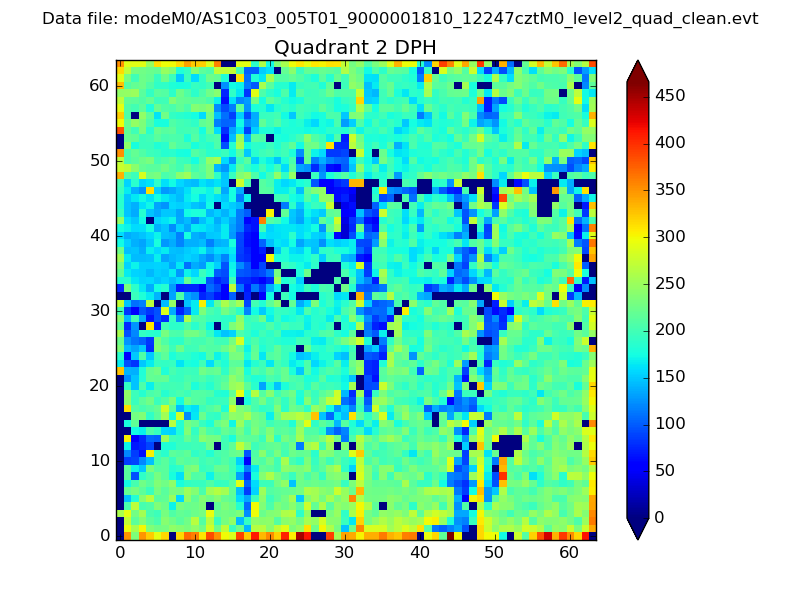
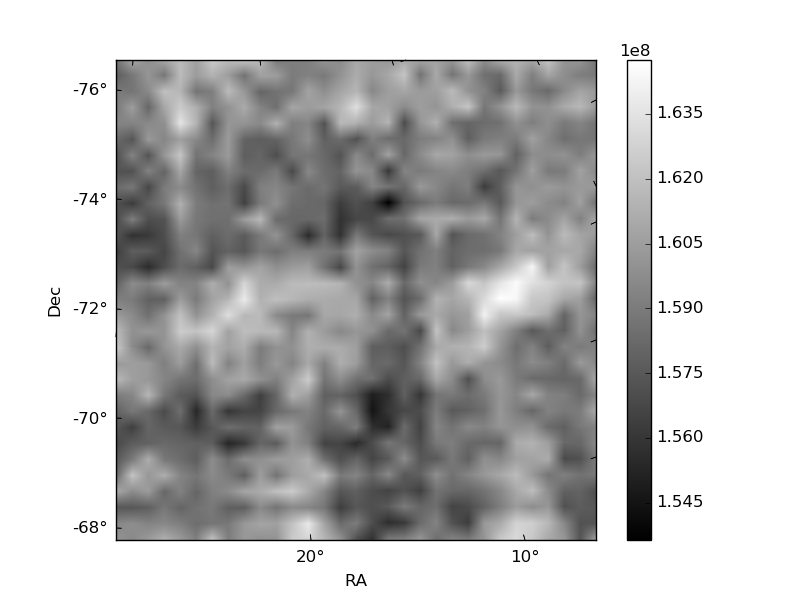
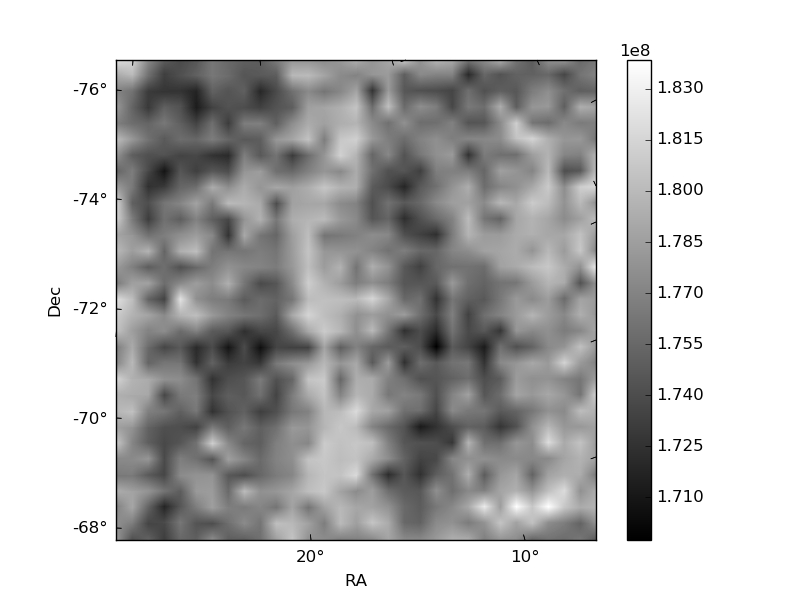
Histogram calculated using DETX and DETY for each event in the final _common_clean file
| Quadrant A | 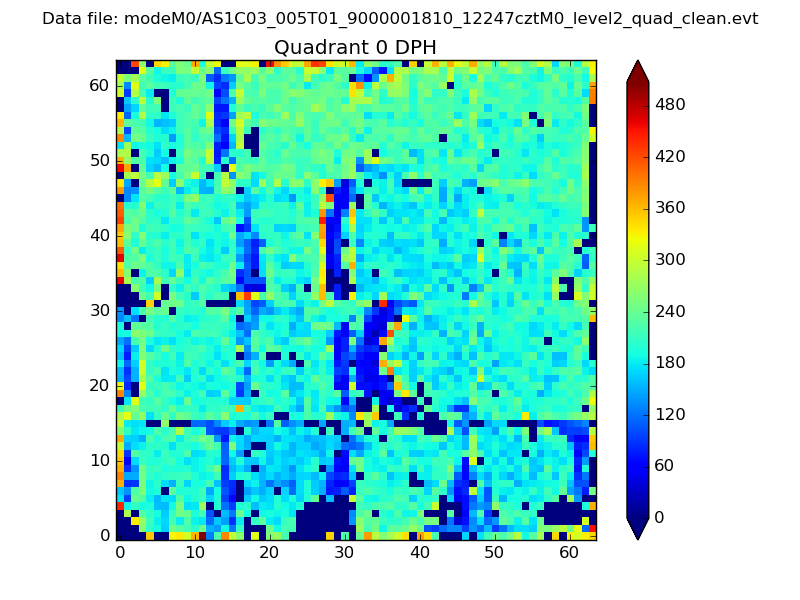 |
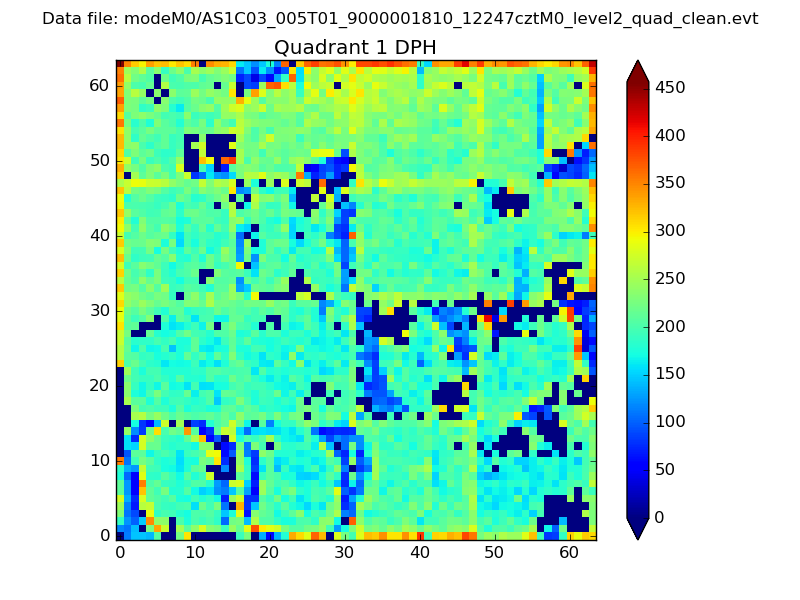 |
Quadrant B |
|---|---|---|---|
| Quadrant D | 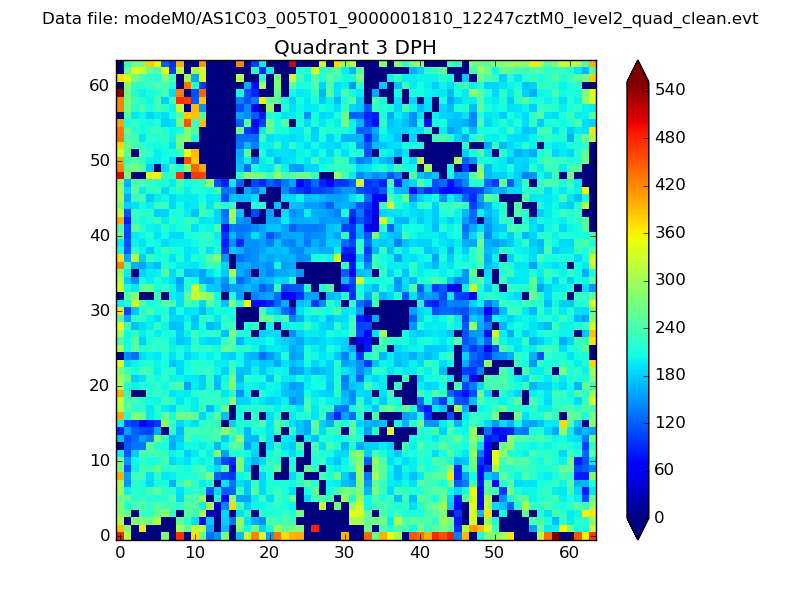 |
 |
Quadrant C |
| Plot type | Count rate plots | Images |
|---|---|---|
| Comparison with Poisson distribution Blue bars denote a histogram of data divided into 1 sec bins. Red curve is a Poisson curve with rate = median count rate of data. |
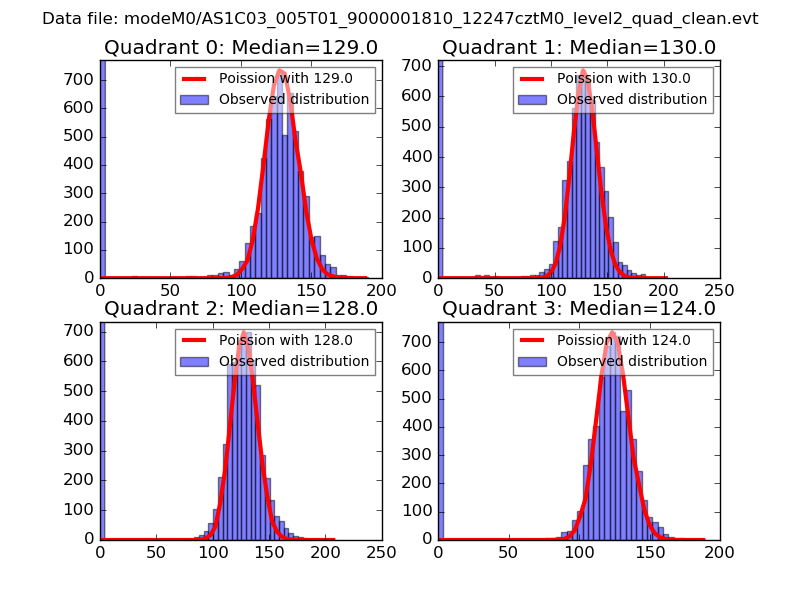 |
 |
| Quadrant-wise count rates Data is divided into 100 sec bins |
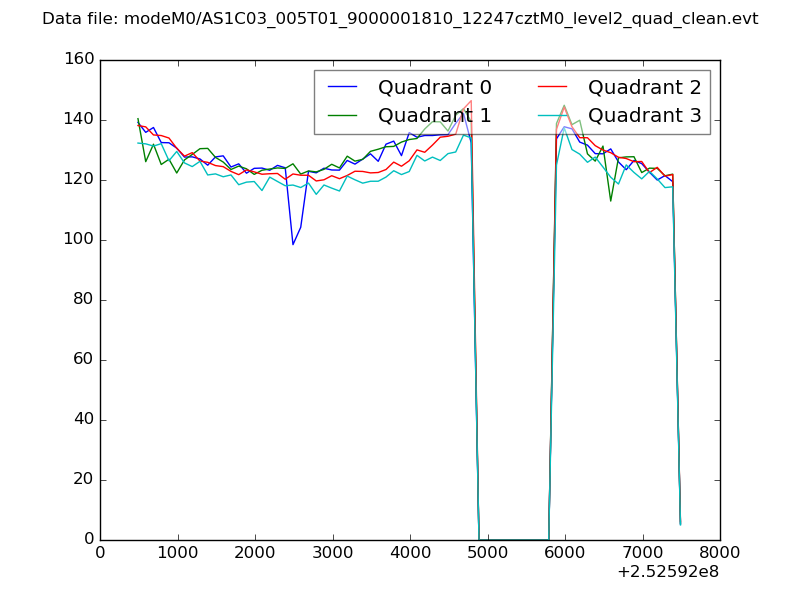 |
|
| Module-wise count rates for Quadrant A Data is divided into 100 sec bins |
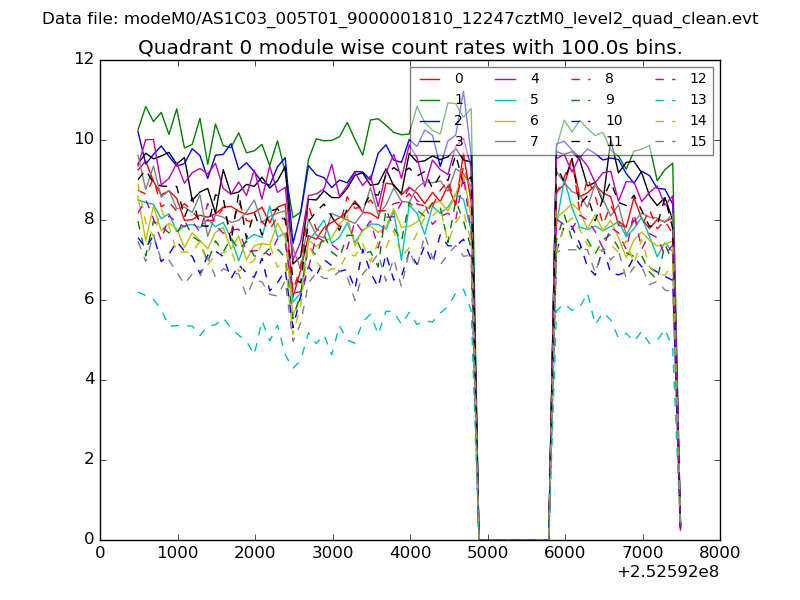 |
 |
| Module-wise count rates for Quadrant B Data is divided into 100 sec bins |
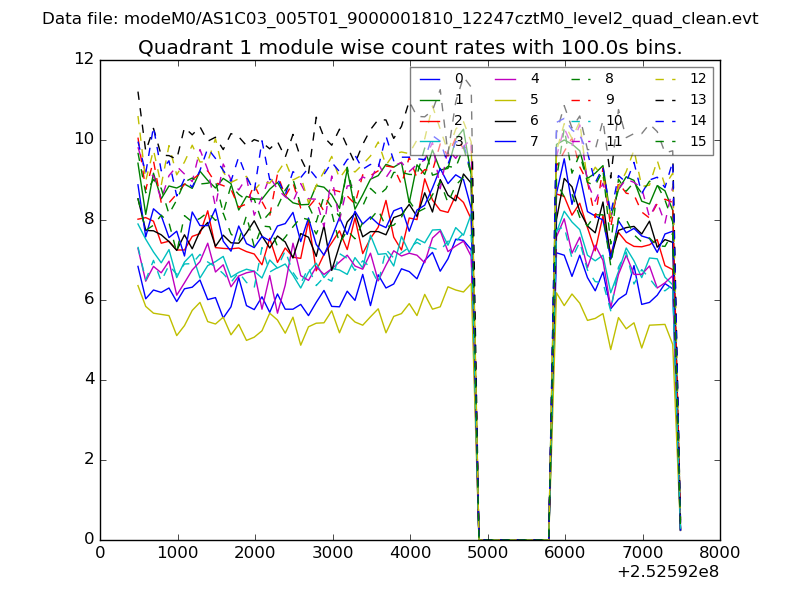 |
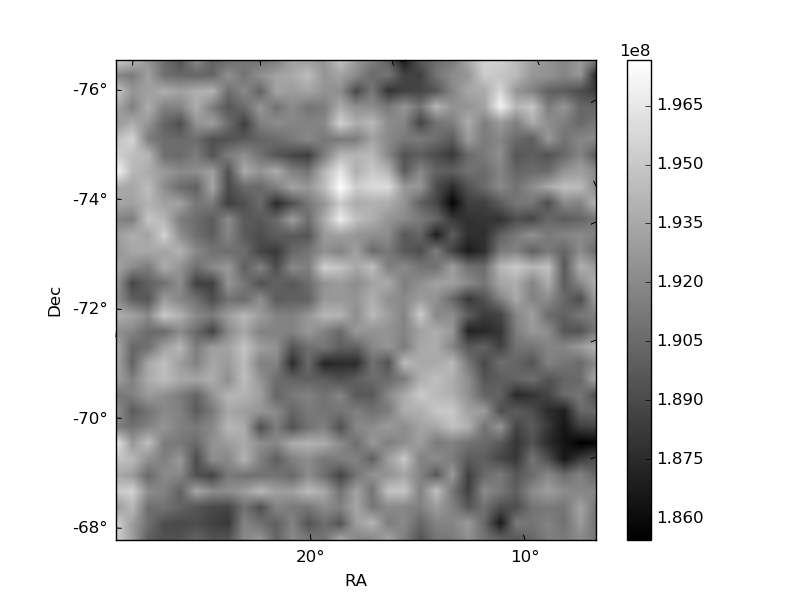 |
| Module-wise count rates for Quadrant C Data is divided into 100 sec bins |
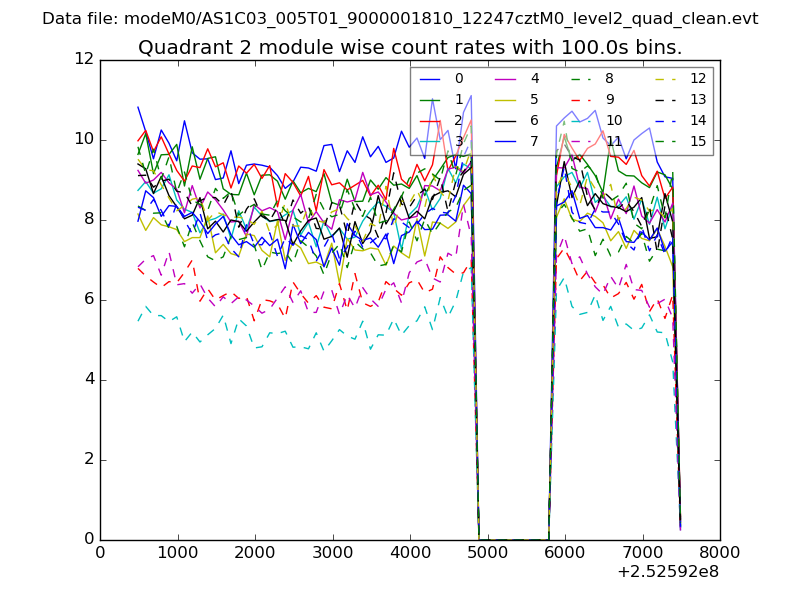 |
 |
| Module-wise count rates for Quadrant D Data is divided into 100 sec bins |
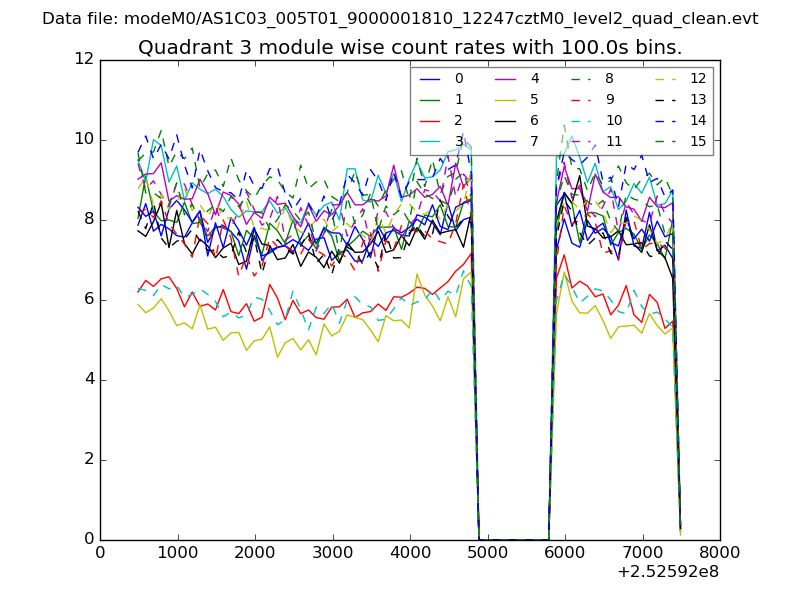 |
 |
| Parameter | Plot |
|---|---|
| CZT HV Monitor | 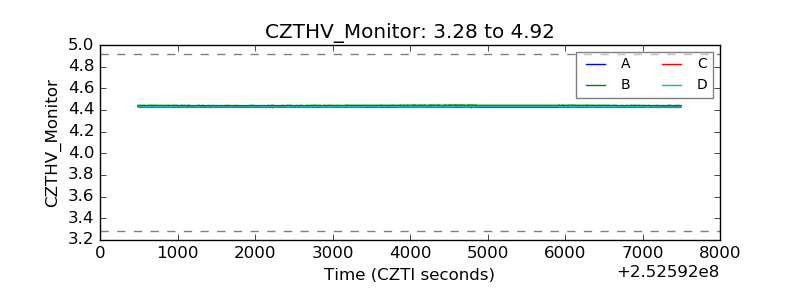 |
| D_VDD | 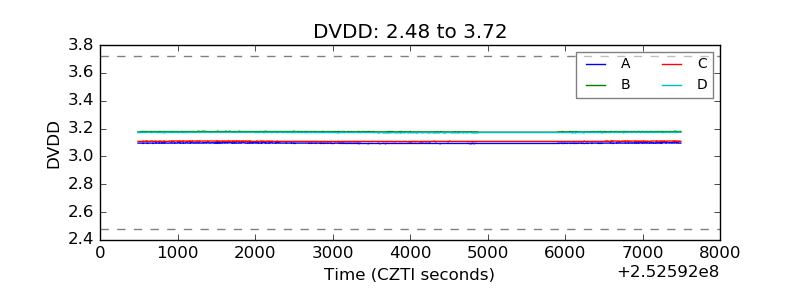 |
| Temperature 1 | 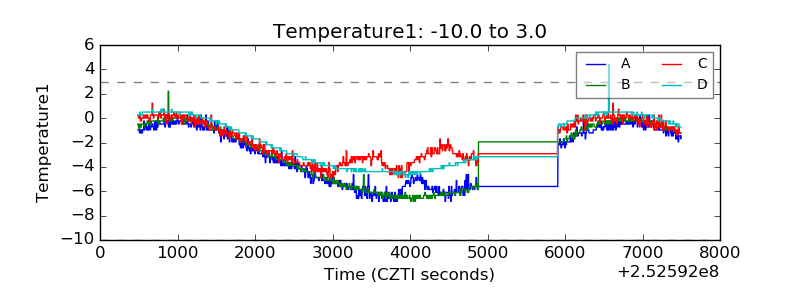 |
| Veto HV Monitor | 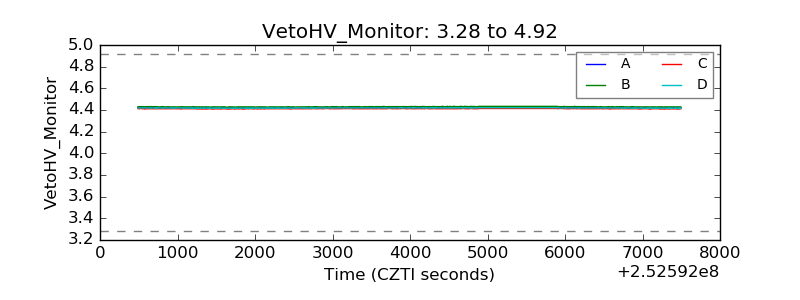 |
| Veto LLD | 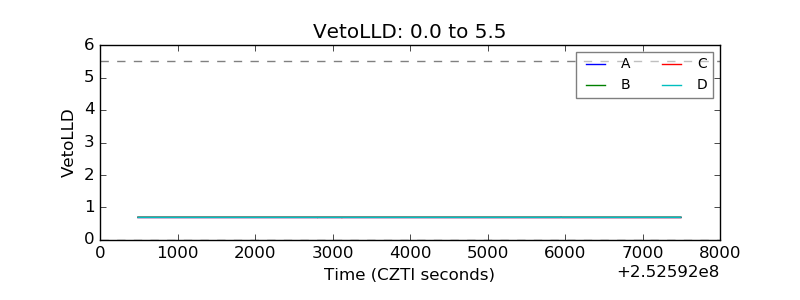 |
| Alpha Counter | 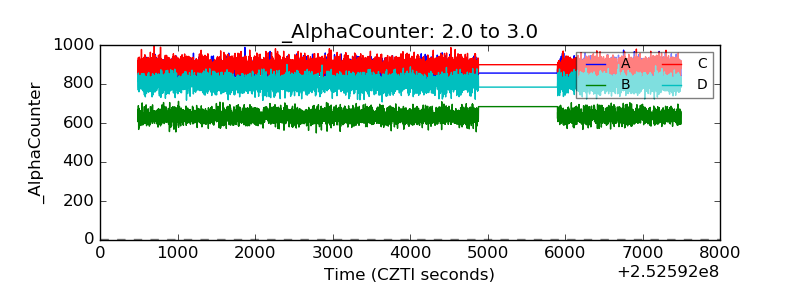 |
| _CPM_Rate | 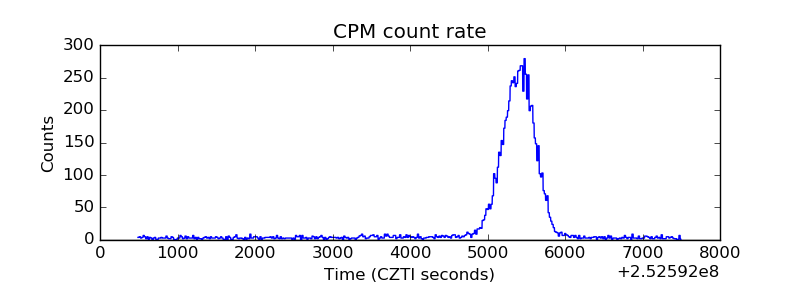 |
| CZT Counter | 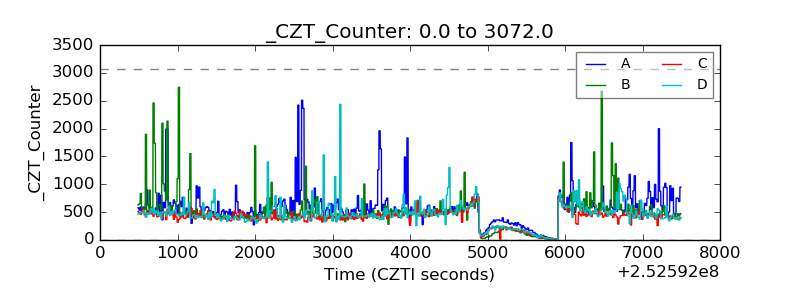 |
| +2.5 Volts monitor |  |
| +5 Volts monitor | 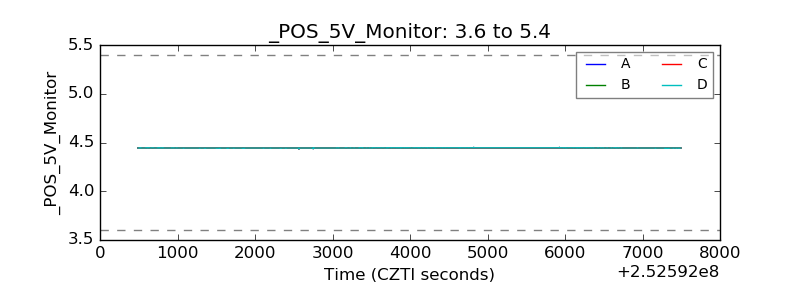 |
| _ROLL_ROT | 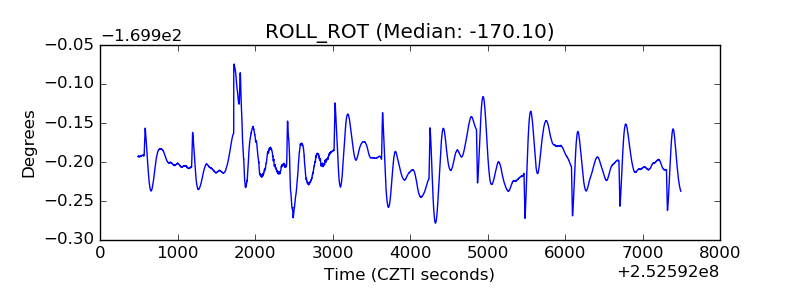 |
| _Roll_DEC | 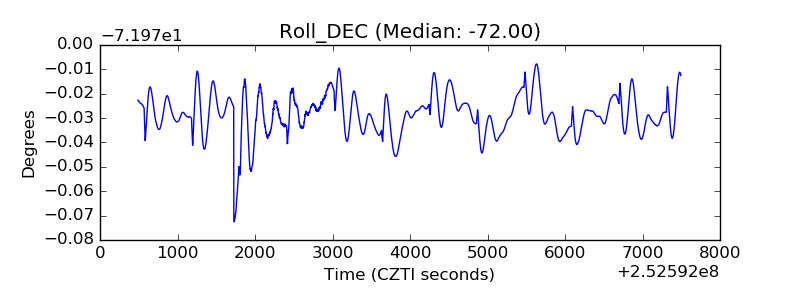 |
| _Roll_RA | 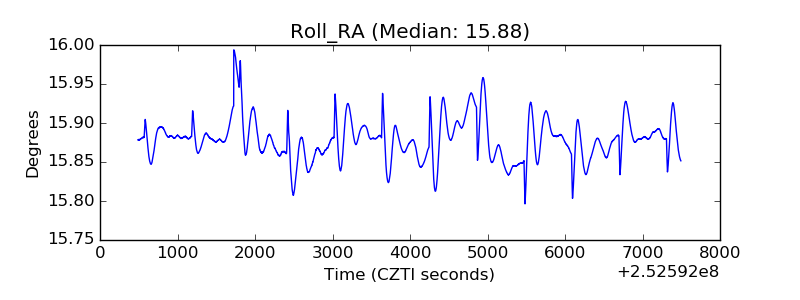 |
| Veto Counter | 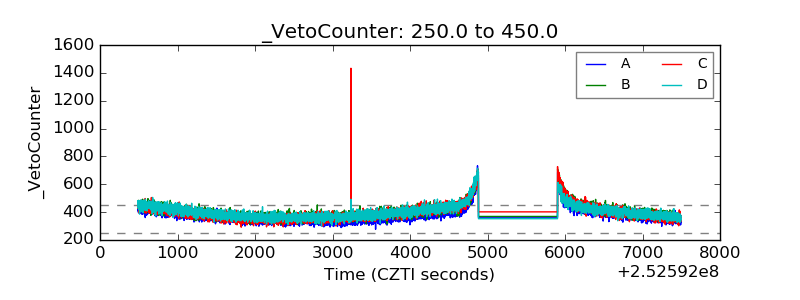 |