| Param | Original file | Final file |
|---|---|---|
| Filename | modeM0/AS1C03_005T01_9000001810_12248cztM0_level2.evt | modeM0/AS1C03_005T01_9000001810_12248cztM0_level2_quad_clean.evt |
| Size (bytes) | 478,252,800 | 122,423,040 |
| Size | 456.1 MB | 116.8 MB |
| Events in quadrant A | 4,207,033 | 817,948 |
| Events in quadrant B | 3,466,737 | 826,420 |
| Events in quadrant C | 2,920,874 | 814,963 |
| Events in quadrant D | 3,440,635 | 787,933 |
| Mode M0 | |||
|---|---|---|---|
| Quadrant | BADHDUFLAG | Total packets | Discarded packets |
| A | 0 | 16965 | 2 |
| B | 0 | 14743 | 1 |
| C | 0 | 13488 | 1 |
| D | 0 | 15051 | 1 |
| Mode SS | |||
|---|---|---|---|
| Quadrant | BADHDUFLAG | Total packets | Discarded packets |
| A | 0 | 134 | 0 |
| B | 0 | 134 | 0 |
| C | 0 | 134 | 0 |
| D | 0 | 134 | 0 |
| Mode M9 | |||
|---|---|---|---|
| Quadrant | BADHDUFLAG | Total packets | Discarded packets |
| A | 0 | 7 | 0 |
| B | 0 | 7 | 0 |
| C | 0 | 7 | 0 |
| D | 0 | 7 | 0 |
| Quadrant | Total seconds | Saturated seconds | Saturation percentage |
|---|---|---|---|
| A | 6604 | 170 | 2.574197% |
| B | 6604 | 156 | 2.362205% |
| C | 6604 | 19 | 0.287704% |
| D | 6604 | 98 | 1.483949% |
Noise dominated data is calculated using 1-second bins in cleaned event files. If a bin has >2000 counts, and if more than 50% of those come from <1% of pixels, then it is considered to be noise-dominated and hence unusable.
| Quadrant | # 1 sec bins | Bins with >0 counts | Bins with >2000 counts | High rate bins dominated by noise | Noise dominated (total time) | Noise dominated (detector-on time) | Marked lightcurve |
|---|---|---|---|---|---|---|---|
| A | 7245 | 6606 | 10 | 10 | 0.14% | 0.15% | 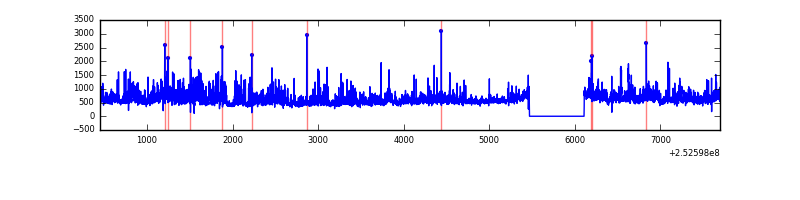 |
| B | 7245 | 6606 | 46 | 46 | 0.63% | 0.70% | 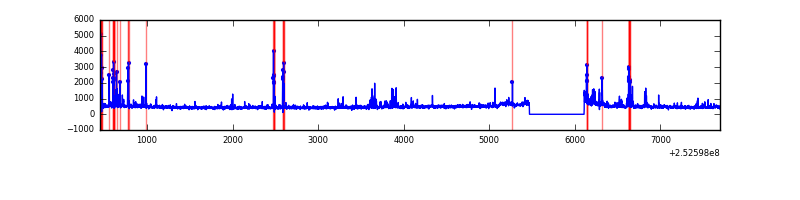 |
| C | 7245 | 6606 | 2 | 2 | 0.03% | 0.03% | 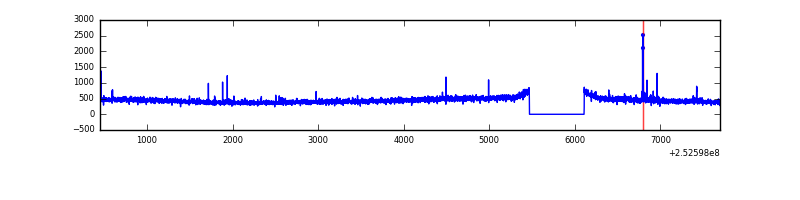 |
| D | 7245 | 6606 | 68 | 68 | 0.94% | 1.03% | 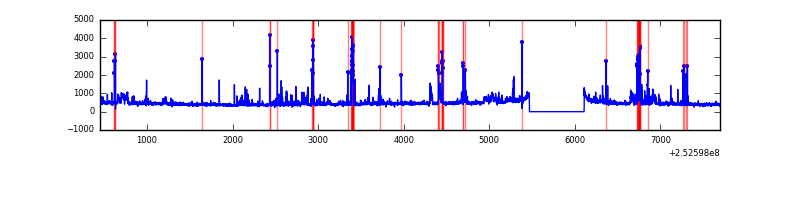 |
Top three noisy pixels from each quadrant. If the there are fewer than three noisy pixels in the level2.evt file, extra rows are filled as -1
| Pixel properties | Quadrant properties | ||||||
|---|---|---|---|---|---|---|---|
| Quadrant | DetID | PixID | Counts | Sigma | Mean | Median | Sigma |
| A | 13 | 251 | 454777 | 2961.1 | 757 | 742 | 153.3 |
| A | 1 | 162 | 263123 | 1711.18 | 757 | 742 | 153.3 |
| A | 1 | 178 | 156487 | 1015.73 | 757 | 742 | 153.3 |
| B | 4 | 239 | 218014 | 1542.78 | 758 | 741 | 140.8 |
| B | 0 | 219 | 77516 | 545.15 | 758 | 741 | 140.8 |
| B | 3 | 64 | 56599 | 396.63 | 758 | 741 | 140.8 |
| C | 4 | 175 | 34275 | 198.51 | 730 | 733 | 169.0 |
| C | 15 | 208 | 21822 | 124.81 | 730 | 733 | 169.0 |
| C | 13 | 61 | 5411 | 27.69 | 730 | 733 | 169.0 |
| D | 1 | 52 | 274526 | 1423.08 | 723 | 706 | 192.4 |
| D | 13 | 104 | 120150 | 620.77 | 723 | 706 | 192.4 |
| D | 2 | 33 | 119997 | 619.97 | 723 | 706 | 192.4 |
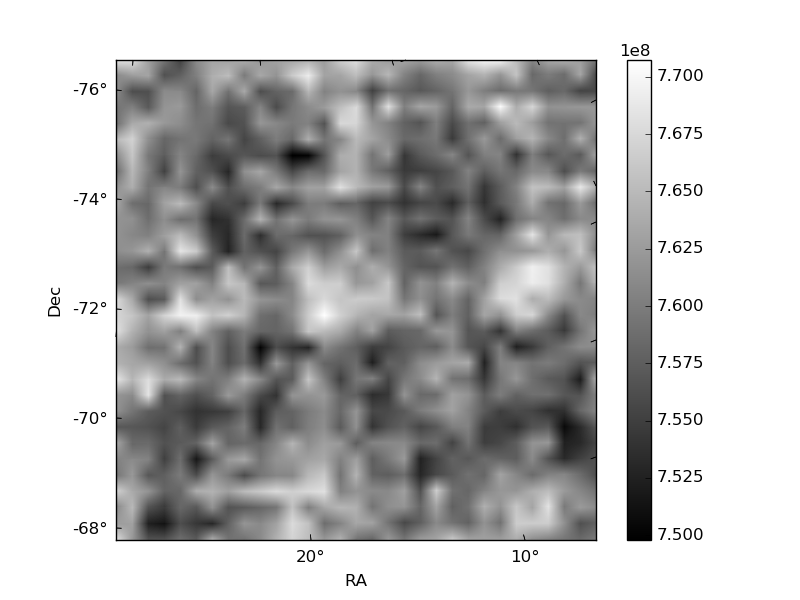
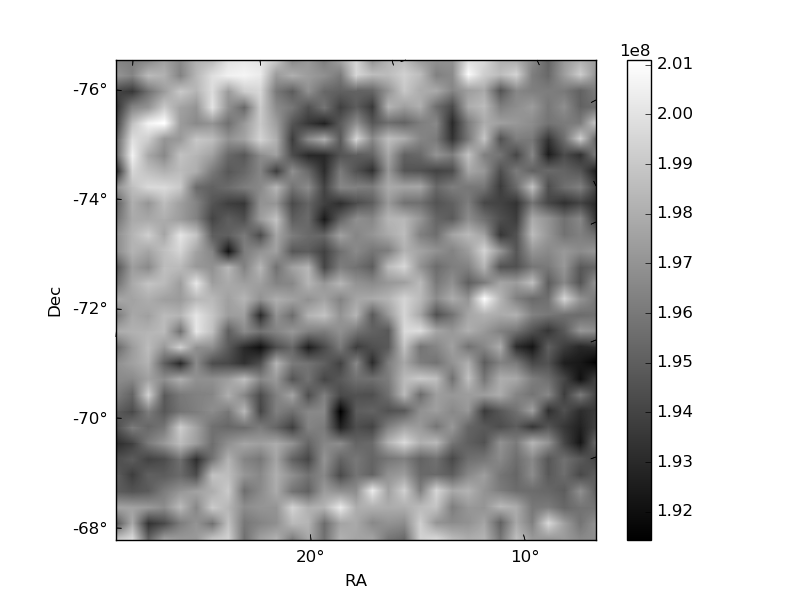
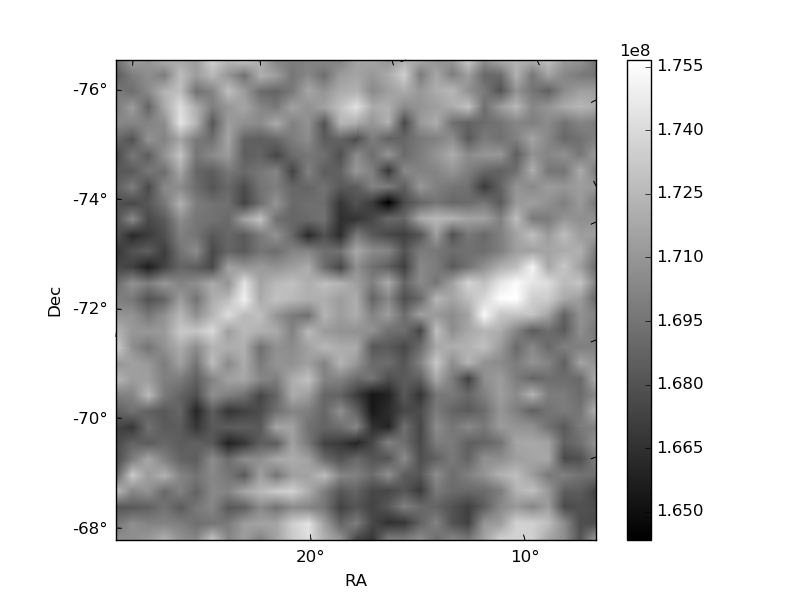
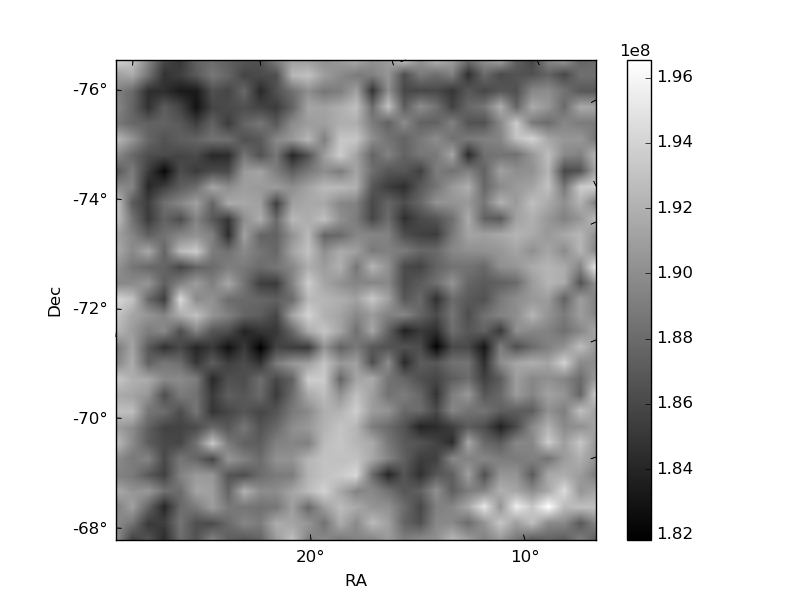
Histogram calculated using DETX and DETY for each event in the final _common_clean file
| Quadrant A | 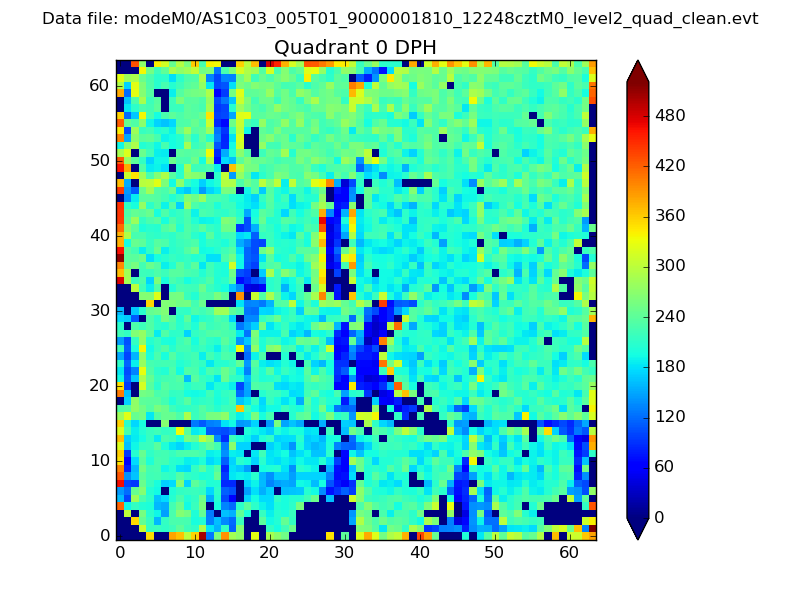 |
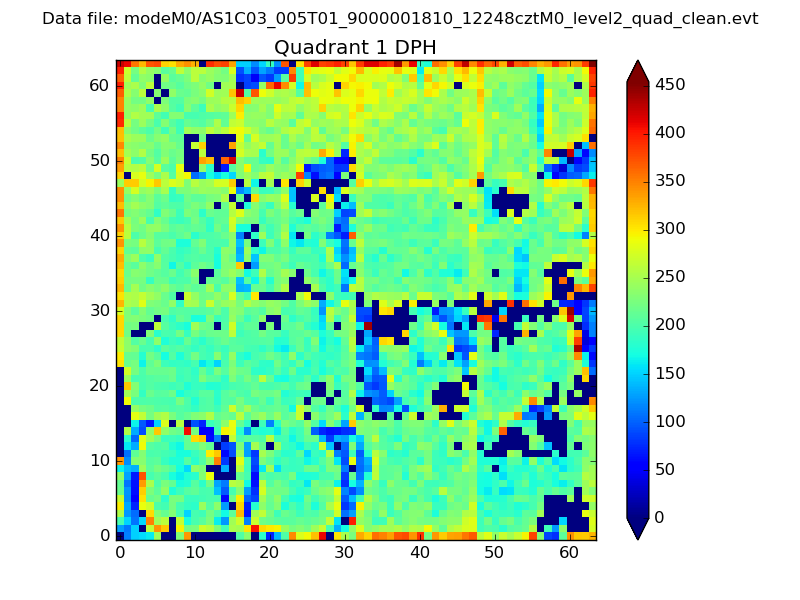 |
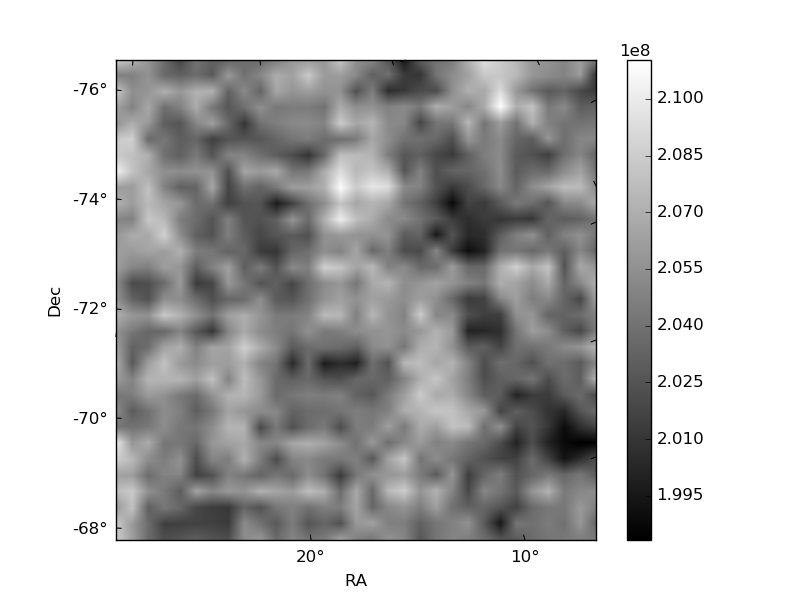
Quadrant B |
|---|---|---|---|
| Quadrant D | 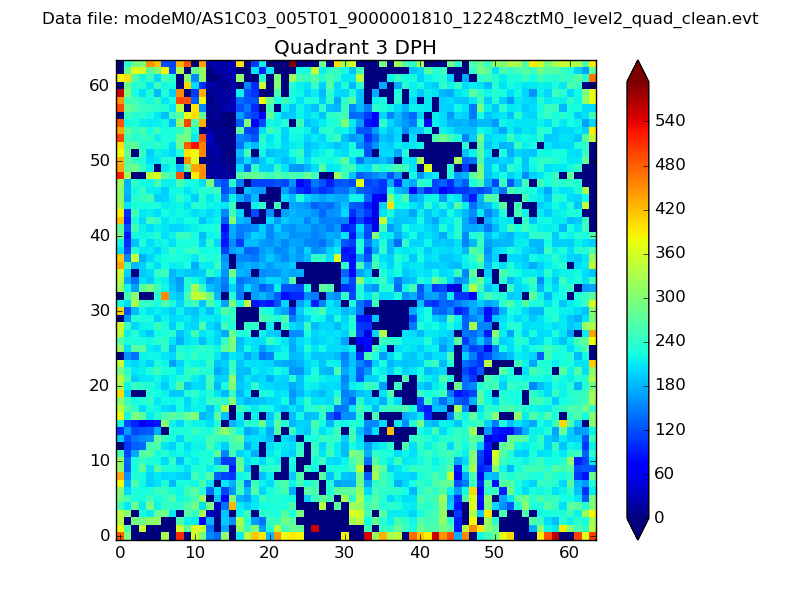 |
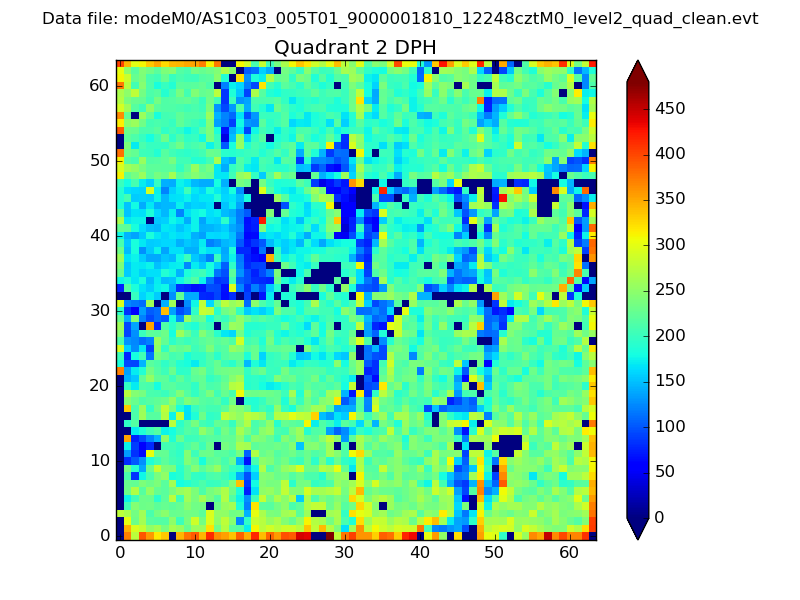 |
Quadrant C |
| Plot type | Count rate plots | Images |
|---|---|---|
| Comparison with Poisson distribution Blue bars denote a histogram of data divided into 1 sec bins. Red curve is a Poisson curve with rate = median count rate of data. |
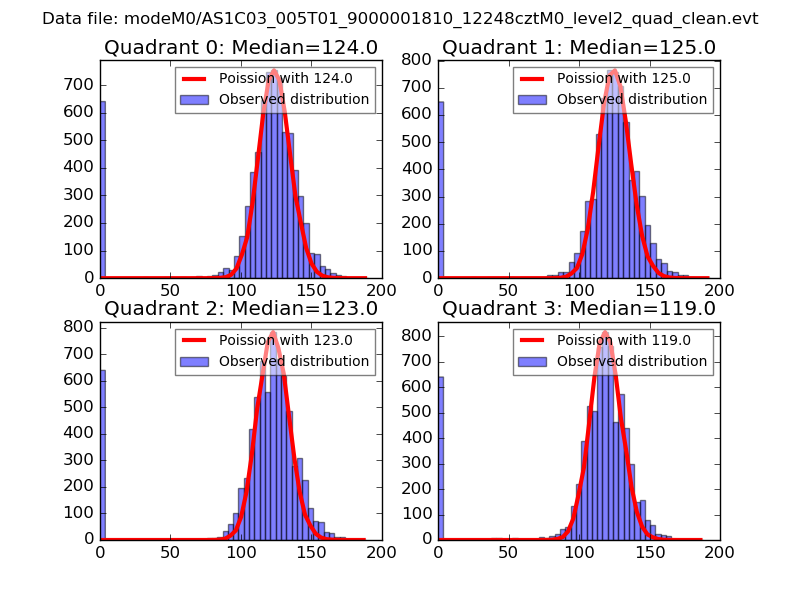 |
 |
| Quadrant-wise count rates Data is divided into 100 sec bins |
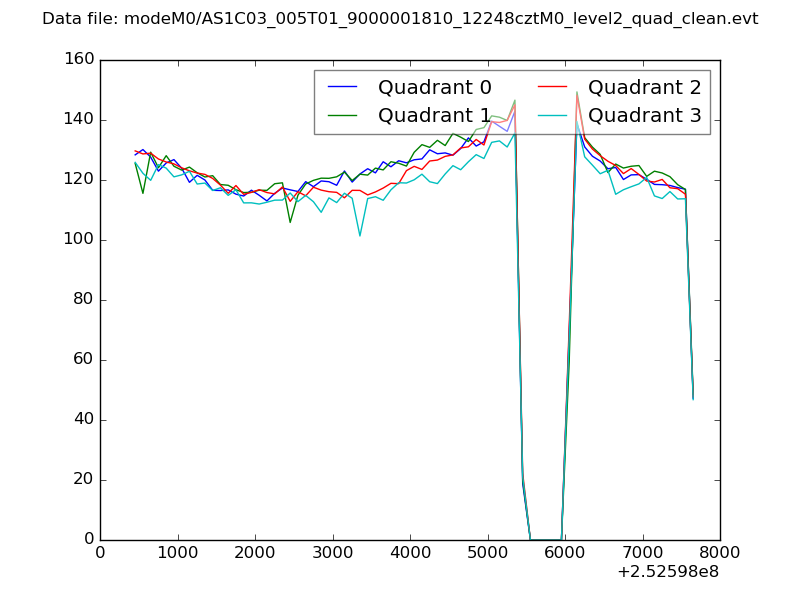 |
|
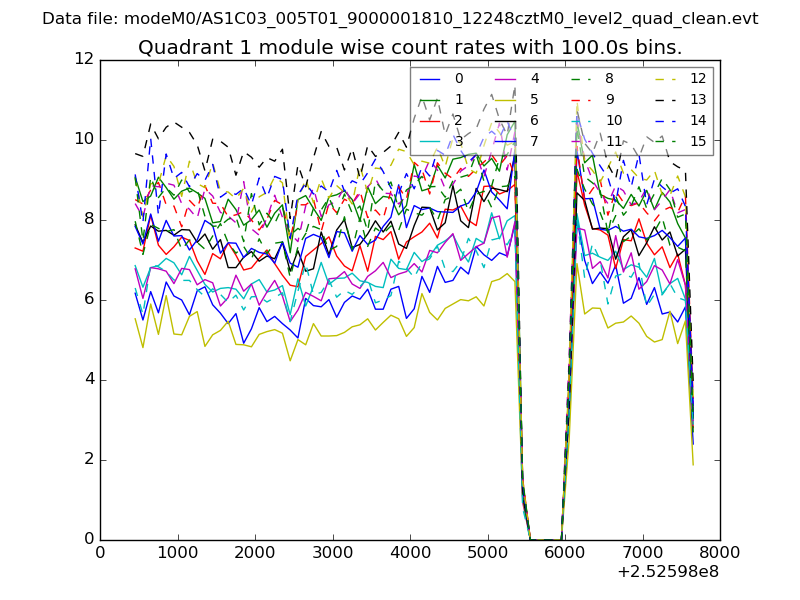
| Module-wise count rates for Quadrant A Data is divided into 100 sec bins |
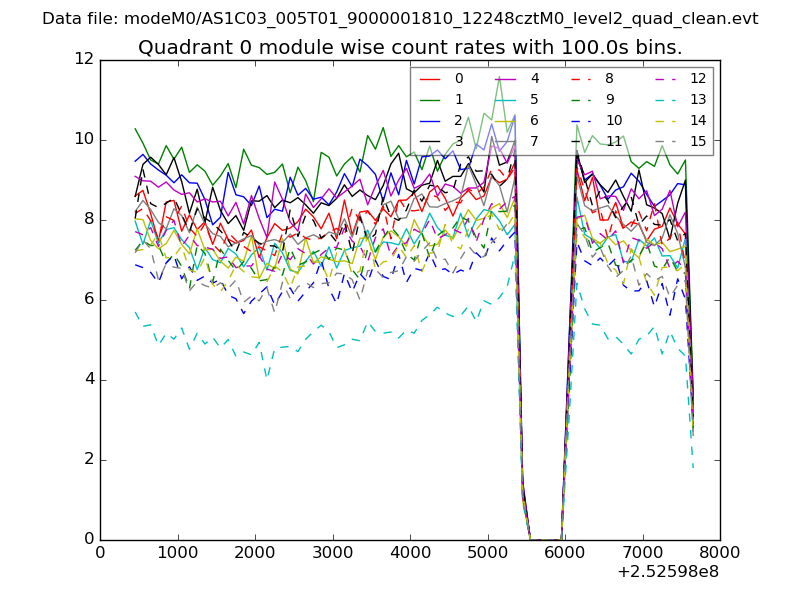 |
 |
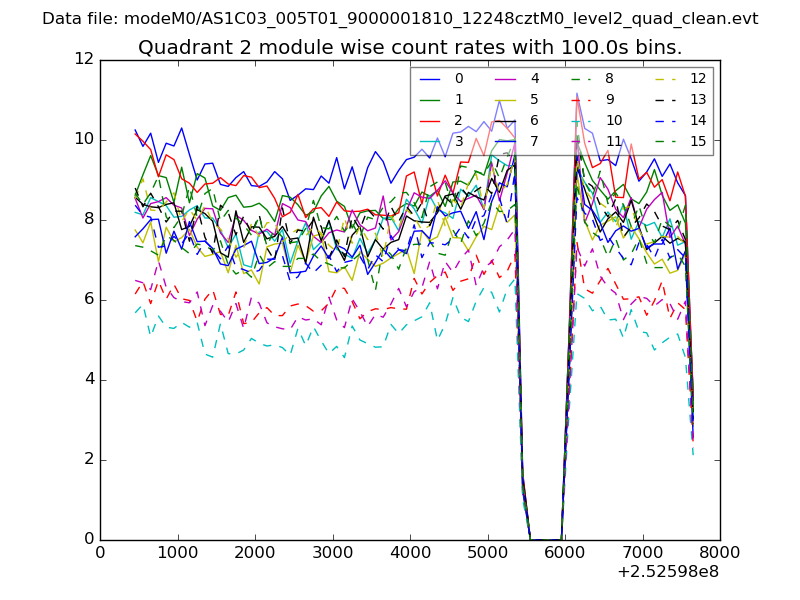
| Module-wise count rates for Quadrant B Data is divided into 100 sec bins |
 |
 |
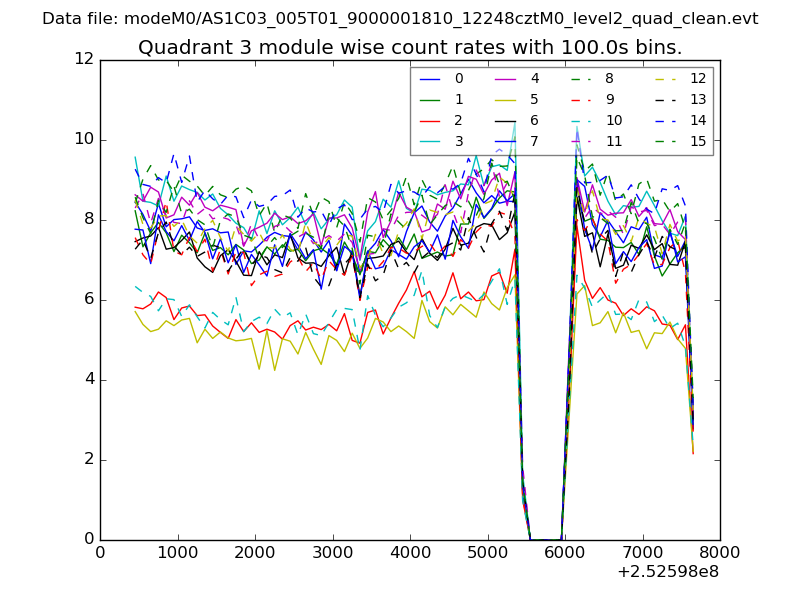
| Module-wise count rates for Quadrant C Data is divided into 100 sec bins |
 |
 |
| Module-wise count rates for Quadrant D Data is divided into 100 sec bins |
 |
 |
| Parameter | Plot |
|---|---|
| CZT HV Monitor | 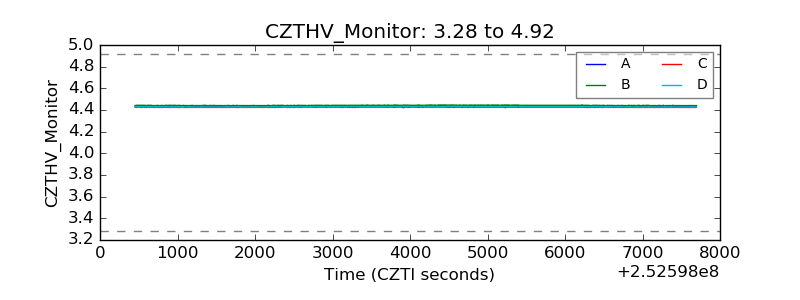 |
| D_VDD | 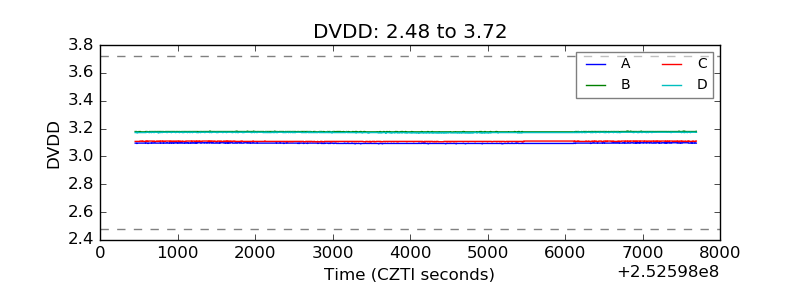 |
| Temperature 1 | 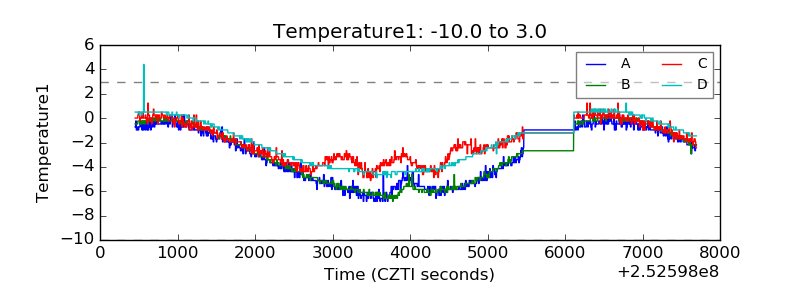 |
| Veto HV Monitor | 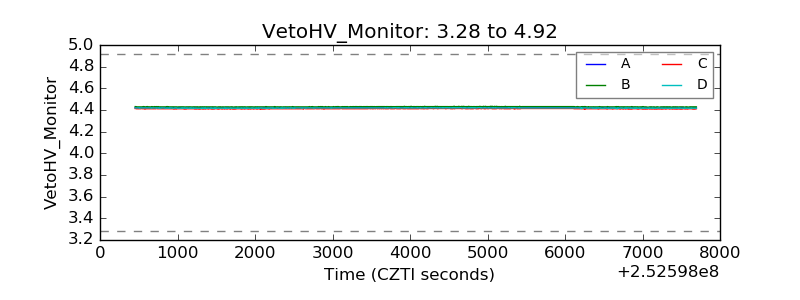 |
| Veto LLD | 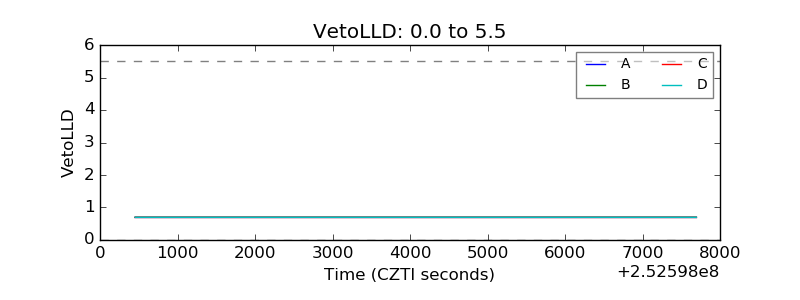 |
| Alpha Counter | 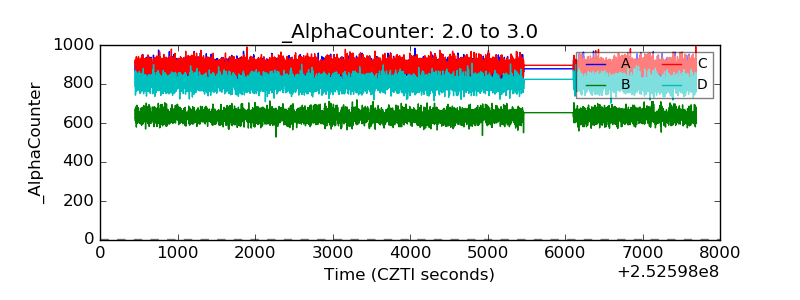 |
| _CPM_Rate | 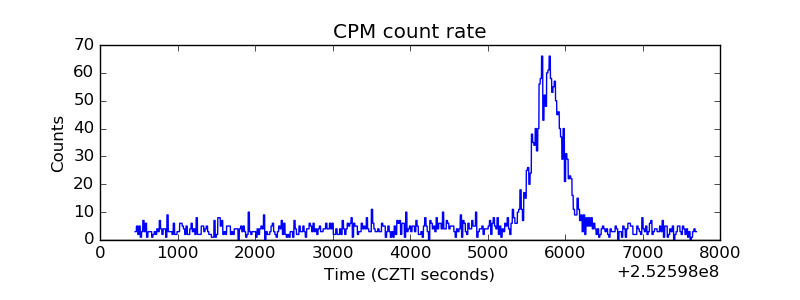 |
| CZT Counter |  |
| +2.5 Volts monitor | 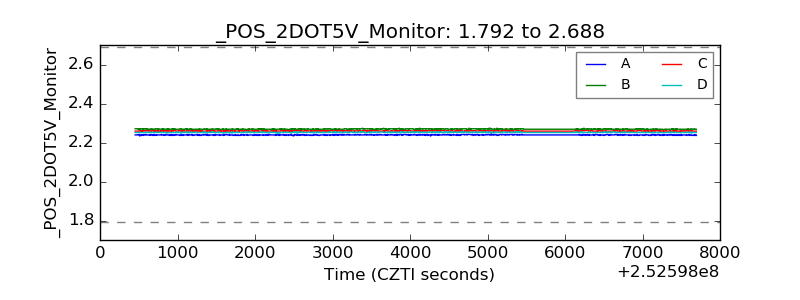 |
| +5 Volts monitor |  |
| _ROLL_ROT | 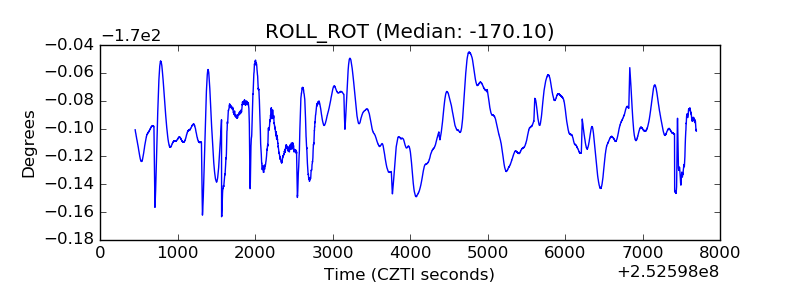 |
| _Roll_DEC | 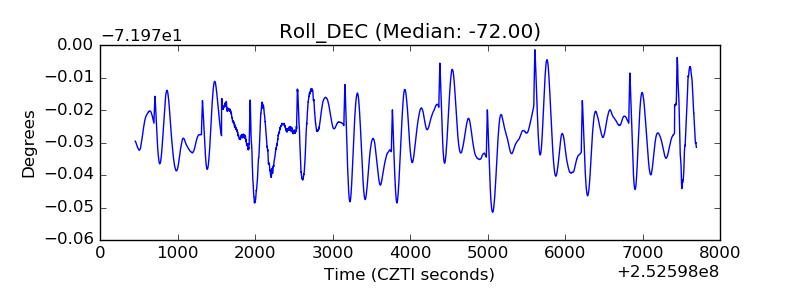 |
| _Roll_RA | 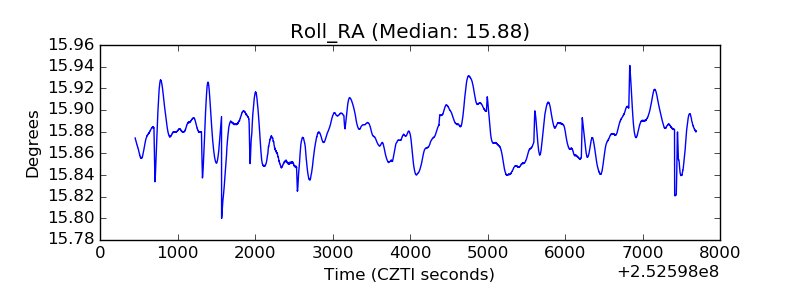 |
| Veto Counter | 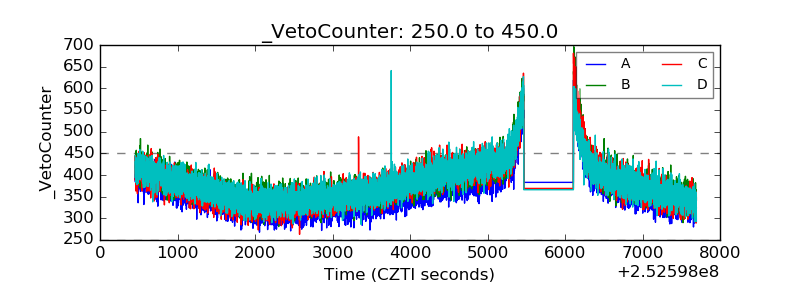 |