| Param | Original file | Final file |
|---|---|---|
| Filename | modeM0/AS1C03_005T01_9000001810_12249cztM0_level2.evt | modeM0/AS1C03_005T01_9000001810_12249cztM0_level2_quad_clean.evt |
| Size (bytes) | 540,622,080 | 129,579,840 |
| Size | 515.6 MB | 123.6 MB |
| Events in quadrant A | 4,467,376 | 867,306 |
| Events in quadrant B | 3,979,971 | 877,707 |
| Events in quadrant C | 3,307,899 | 862,949 |
| Events in quadrant D | 4,134,865 | 821,188 |
| Mode M0 | |||
|---|---|---|---|
| Quadrant | BADHDUFLAG | Total packets | Discarded packets |
| A | 0 | 18041 | 2 |
| B | 0 | 16457 | 1 |
| C | 0 | 14956 | 1 |
| D | 0 | 17383 | 1 |
| Mode SS | |||
|---|---|---|---|
| Quadrant | BADHDUFLAG | Total packets | Discarded packets |
| A | 0 | 144 | 0 |
| B | 0 | 144 | 0 |
| C | 0 | 144 | 0 |
| D | 0 | 144 | 0 |
| Mode M9 | |||
|---|---|---|---|
| Quadrant | BADHDUFLAG | Total packets | Discarded packets |
| A | 0 | 4 | 0 |
| B | 0 | 4 | 0 |
| C | 0 | 4 | 0 |
| D | 0 | 4 | 0 |
| Quadrant | Total seconds | Saturated seconds | Saturation percentage |
|---|---|---|---|
| A | 7123 | 133 | 1.867191% |
| B | 7123 | 148 | 2.077776% |
| C | 7123 | 41 | 0.575600% |
| D | 7123 | 267 | 3.748421% |
Noise dominated data is calculated using 1-second bins in cleaned event files. If a bin has >2000 counts, and if more than 50% of those come from <1% of pixels, then it is considered to be noise-dominated and hence unusable.
| Quadrant | # 1 sec bins | Bins with >0 counts | Bins with >2000 counts | High rate bins dominated by noise | Noise dominated (total time) | Noise dominated (detector-on time) | Marked lightcurve |
|---|---|---|---|---|---|---|---|
| A | 7434 | 7126 | 11 | 11 | 0.15% | 0.15% | 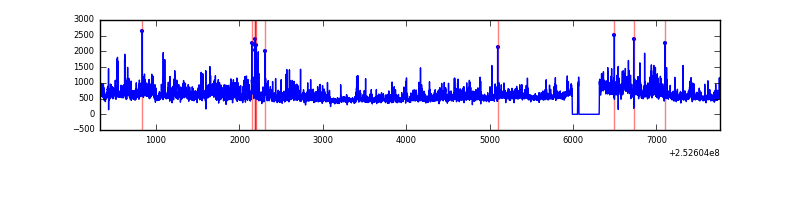 |
| B | 7434 | 7126 | 53 | 53 | 0.71% | 0.74% | 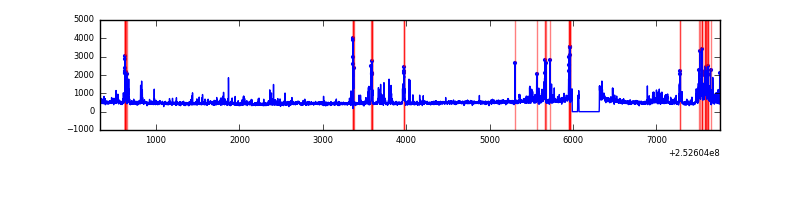 |
| C | 7434 | 7126 | 21 | 21 | 0.28% | 0.29% | 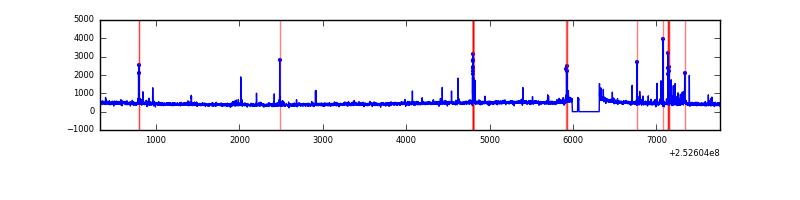 |
| D | 7434 | 7126 | 206 | 206 | 2.77% | 2.89% | 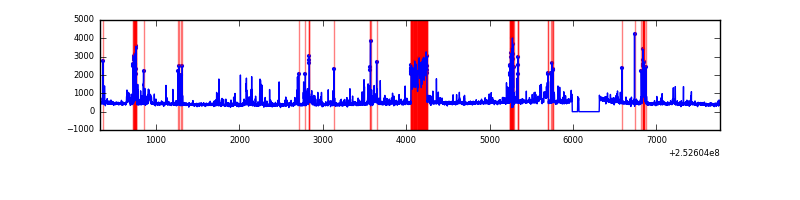 |
Top three noisy pixels from each quadrant. If the there are fewer than three noisy pixels in the level2.evt file, extra rows are filled as -1
| Pixel properties | Quadrant properties | ||||||
|---|---|---|---|---|---|---|---|
| Quadrant | DetID | PixID | Counts | Sigma | Mean | Median | Sigma |
| A | 13 | 251 | 523471 | 3171.25 | 816 | 800 | 164.8 |
| A | 1 | 162 | 204542 | 1236.18 | 816 | 800 | 164.8 |
| A | 1 | 178 | 118348 | 713.21 | 816 | 800 | 164.8 |
| B | 4 | 239 | 419844 | 2735.09 | 819 | 798 | 153.2 |
| B | 0 | 205 | 70178 | 452.84 | 819 | 798 | 153.2 |
| B | 0 | 85 | 68153 | 439.62 | 819 | 798 | 153.2 |
| C | 15 | 208 | 117436 | 644.13 | 785 | 787 | 181.1 |
| C | 1 | 16 | 81988 | 448.39 | 785 | 787 | 181.1 |
| C | 4 | 175 | 35120 | 189.58 | 785 | 787 | 181.1 |
| D | 1 | 52 | 539098 | 2849.47 | 777 | 754 | 188.9 |
| D | 13 | 104 | 266896 | 1408.7 | 777 | 754 | 188.9 |
| D | 10 | 199 | 90279 | 473.86 | 777 | 754 | 188.9 |
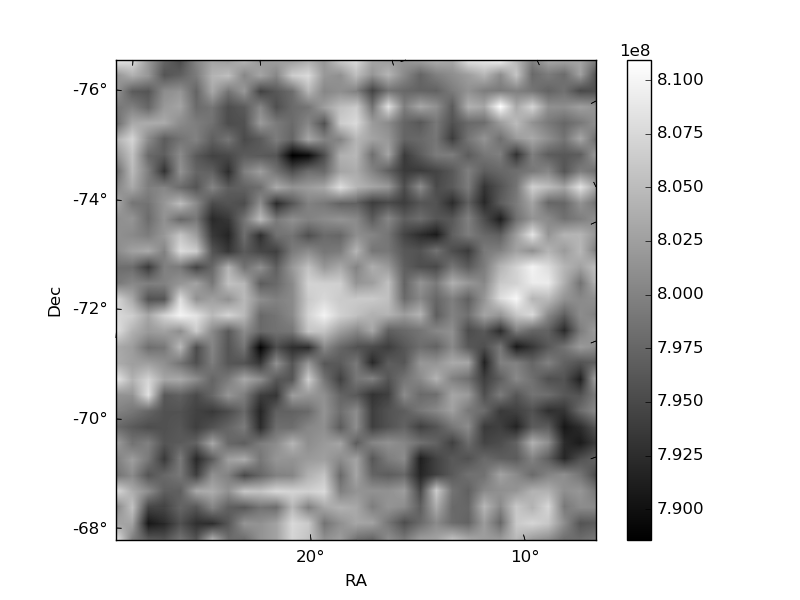
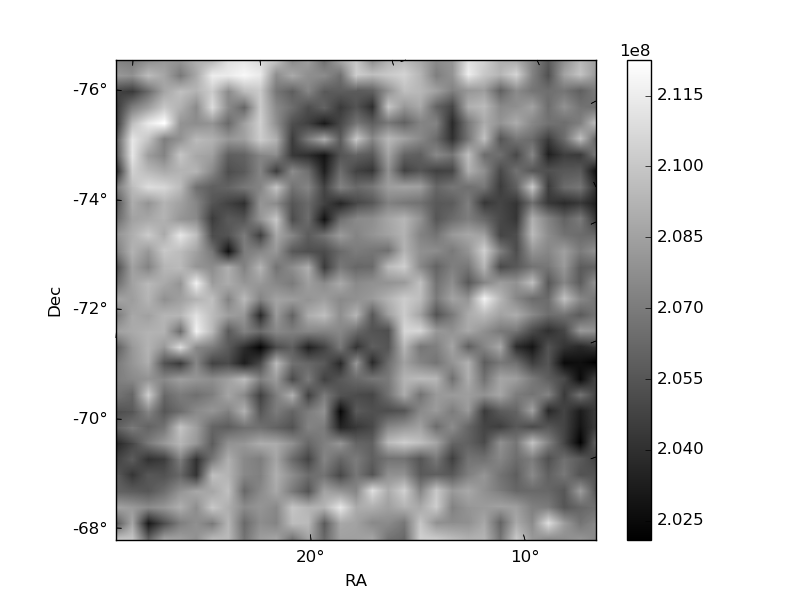
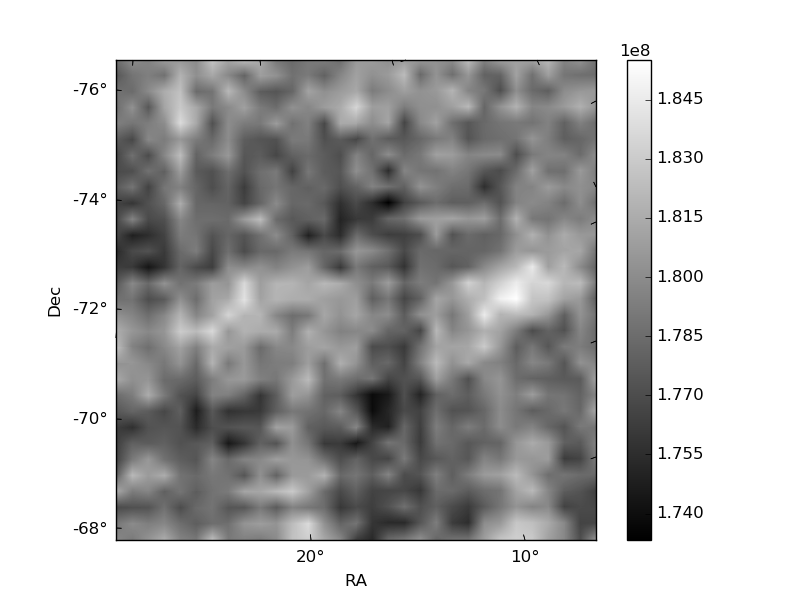
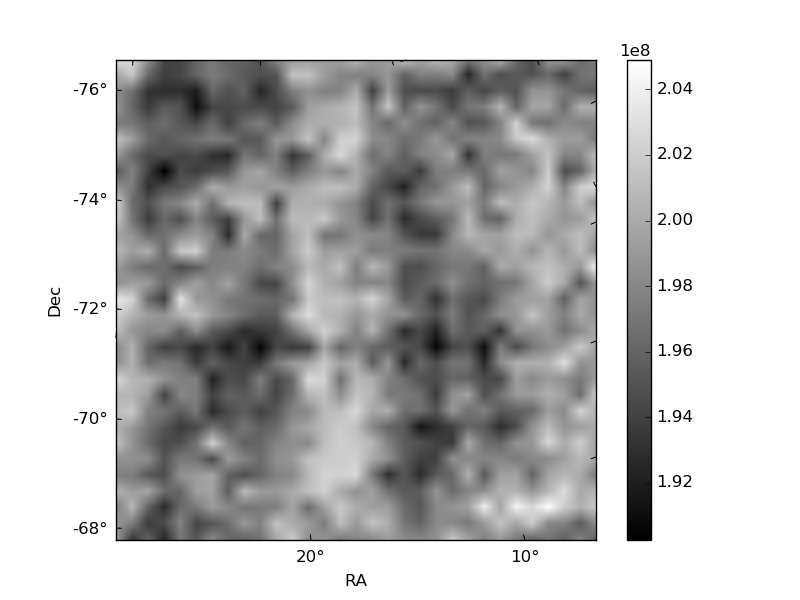
Histogram calculated using DETX and DETY for each event in the final _common_clean file
| Quadrant A | 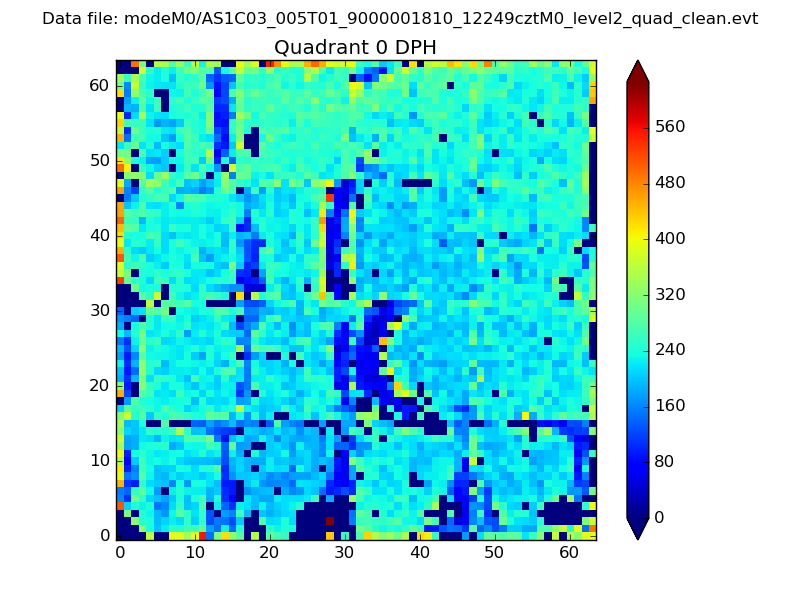 |
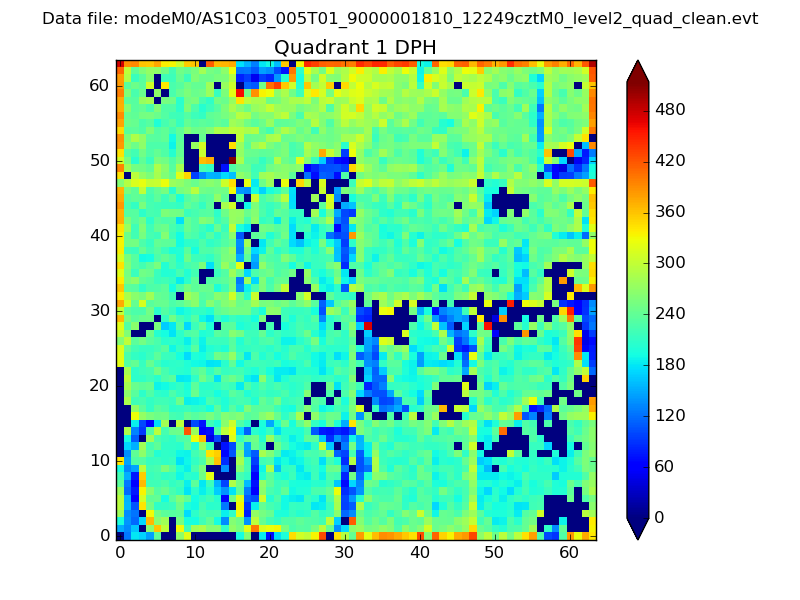 |
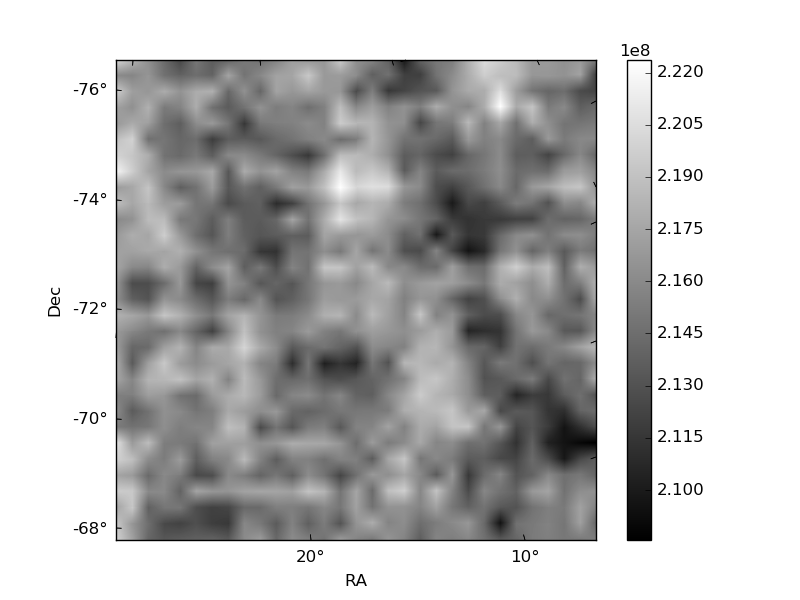
Quadrant B |
|---|---|---|---|
| Quadrant D | 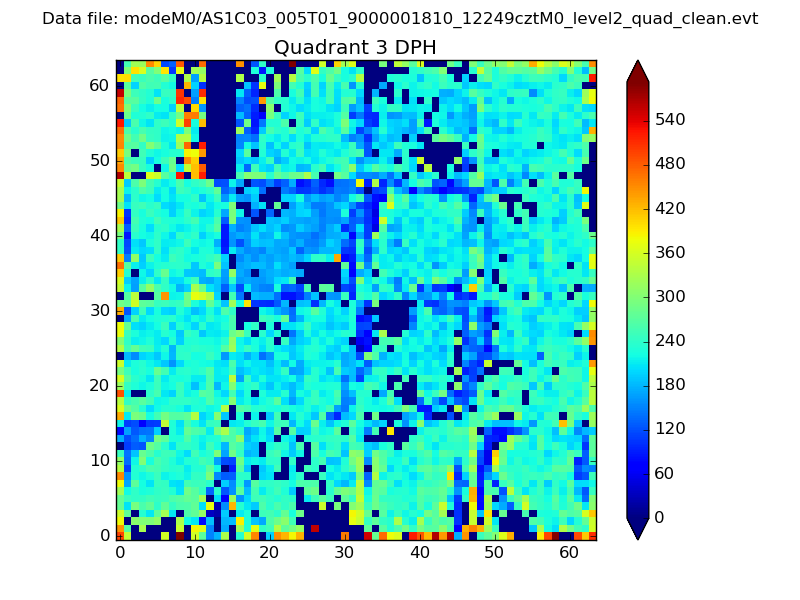 |
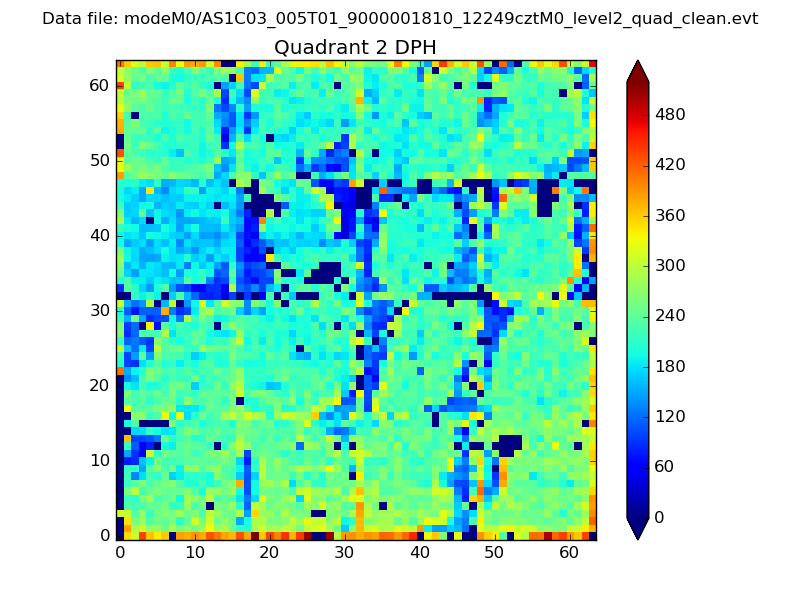 |
Quadrant C |
| Plot type | Count rate plots | Images |
|---|---|---|
| Comparison with Poisson distribution Blue bars denote a histogram of data divided into 1 sec bins. Red curve is a Poisson curve with rate = median count rate of data. |
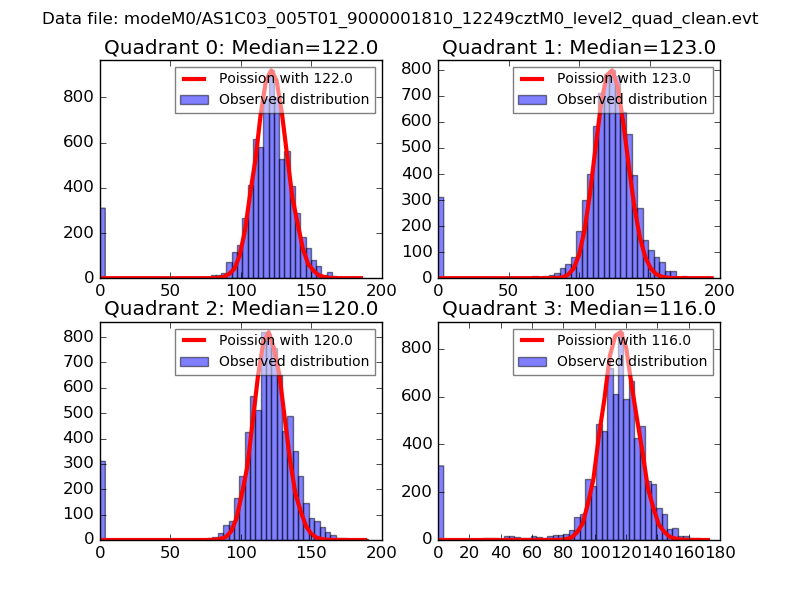 |
 |
| Quadrant-wise count rates Data is divided into 100 sec bins |
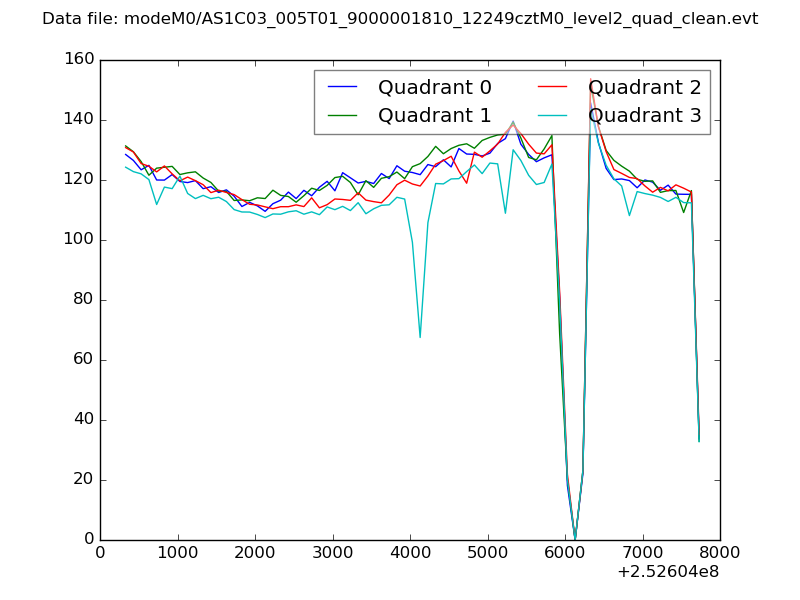 |
|
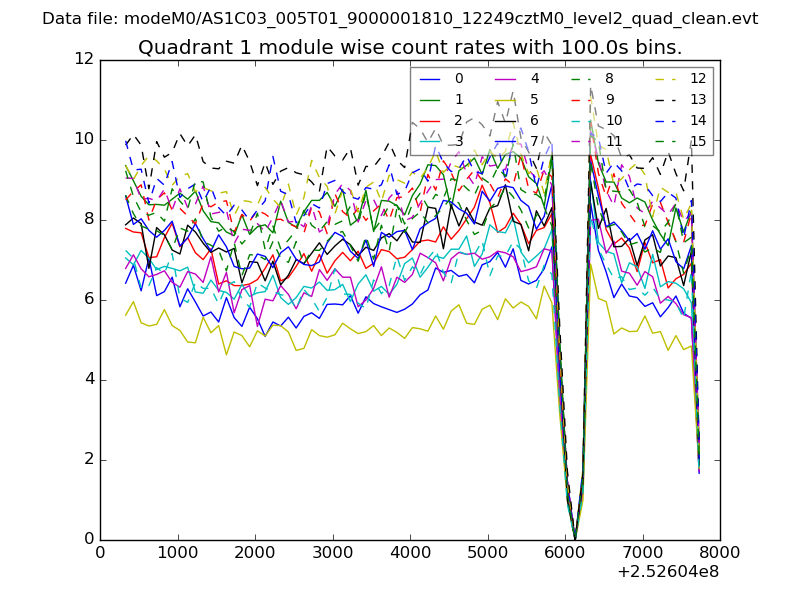
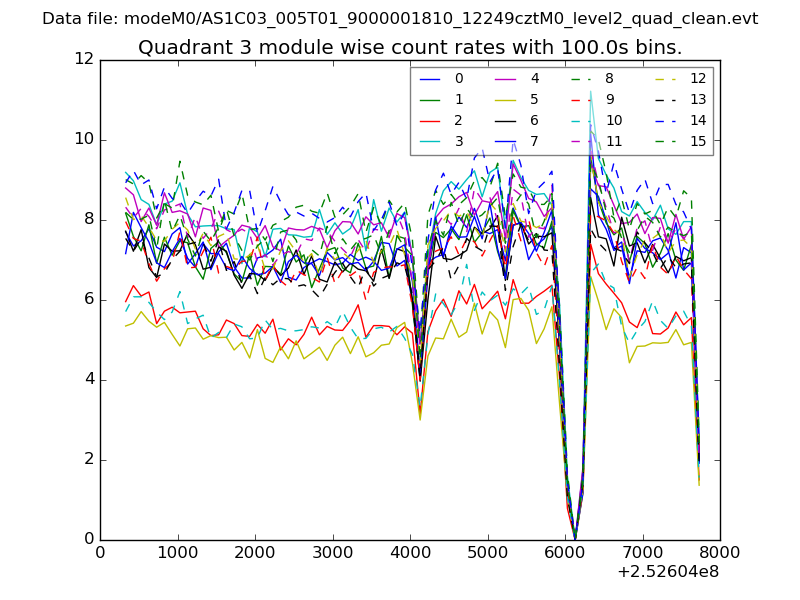
| Module-wise count rates for Quadrant A Data is divided into 100 sec bins |
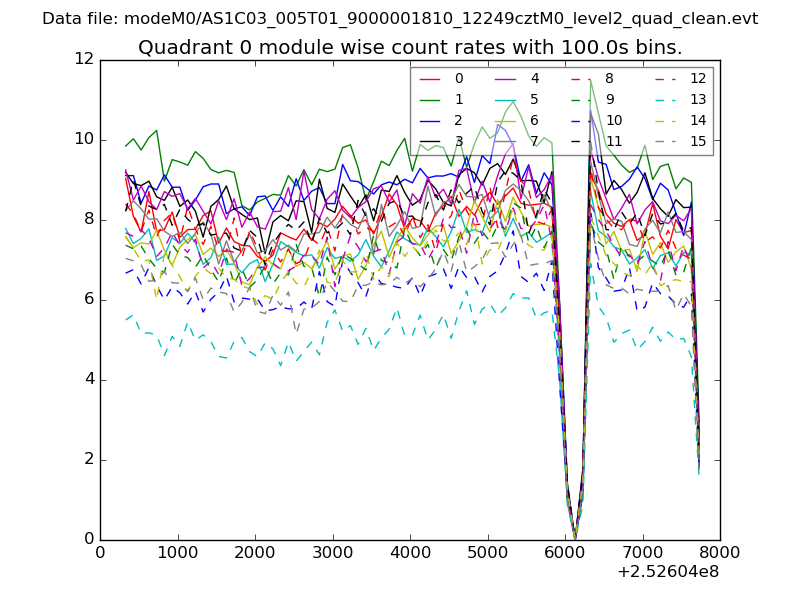 |
 |
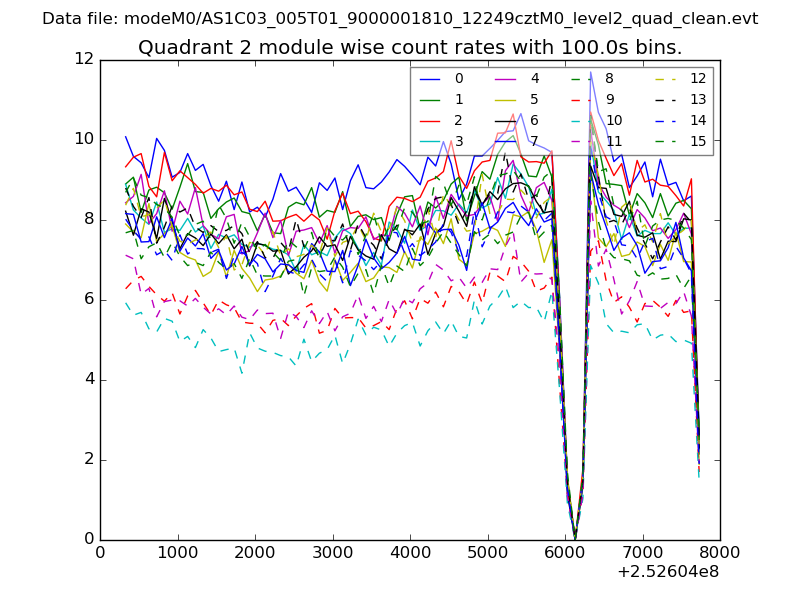
| Module-wise count rates for Quadrant B Data is divided into 100 sec bins |
 |
 |
| Module-wise count rates for Quadrant C Data is divided into 100 sec bins |
 |
 |
| Module-wise count rates for Quadrant D Data is divided into 100 sec bins |
 |
 |
| Parameter | Plot |
|---|---|
| CZT HV Monitor | 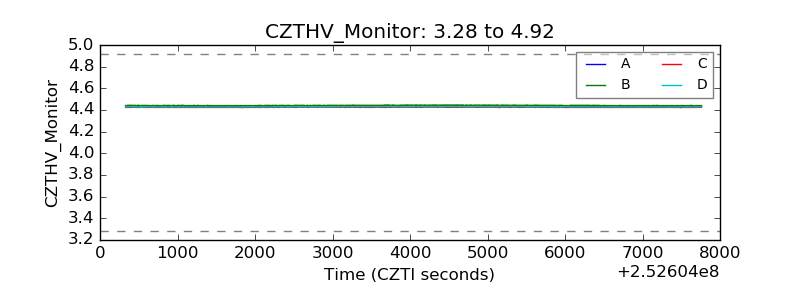 |
| D_VDD | 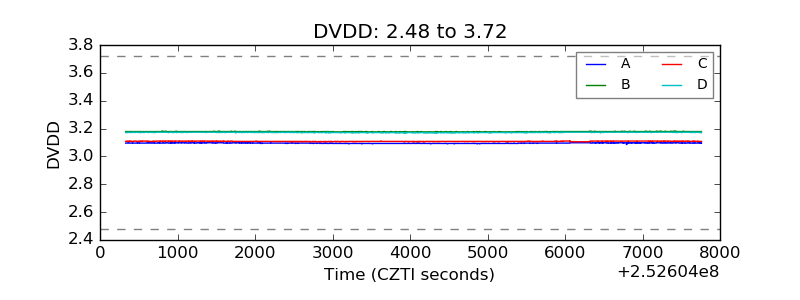 |
| Temperature 1 | 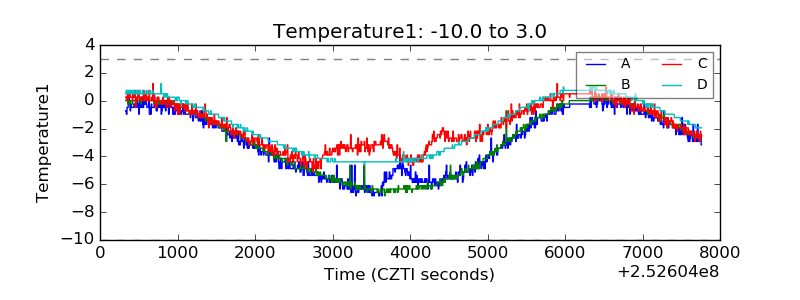 |
| Veto HV Monitor | 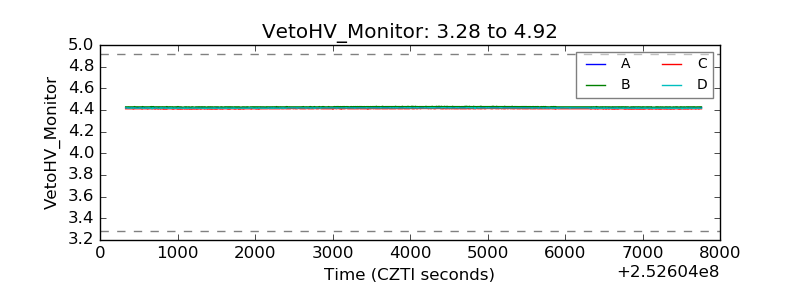 |
| Veto LLD | 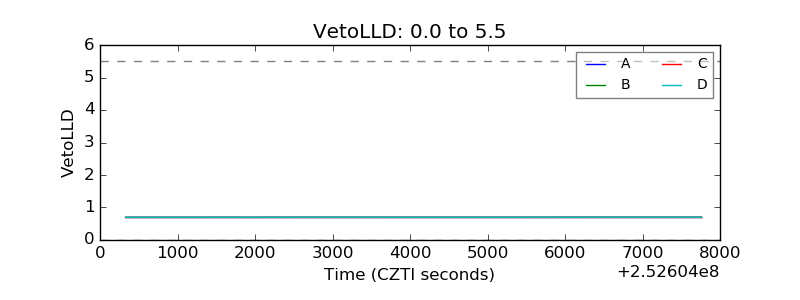 |
| Alpha Counter | 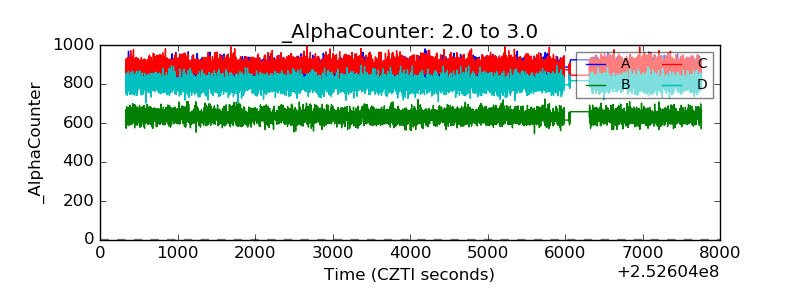 |
| _CPM_Rate | 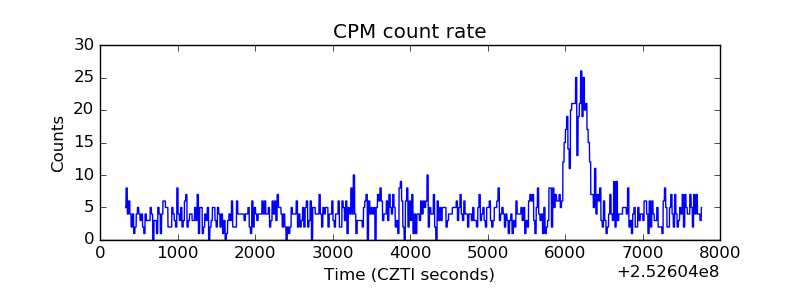 |
| CZT Counter | 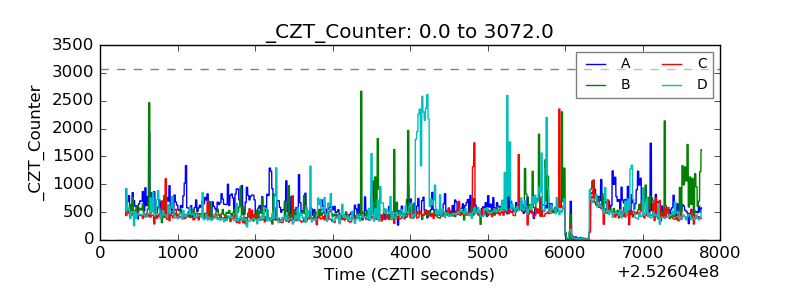 |
| +2.5 Volts monitor | 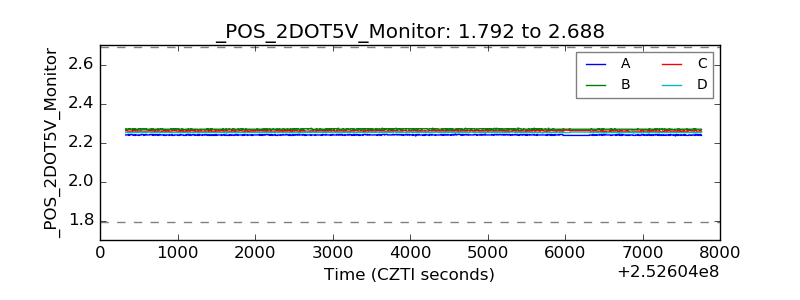 |
| +5 Volts monitor | 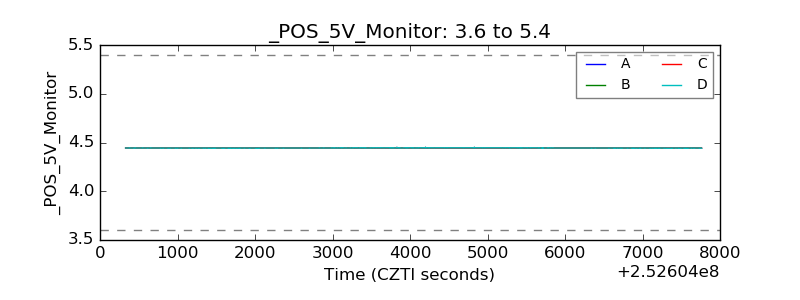 |
| _ROLL_ROT | 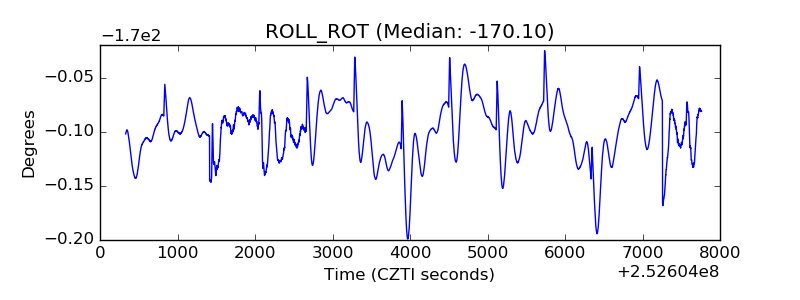 |
| _Roll_DEC | 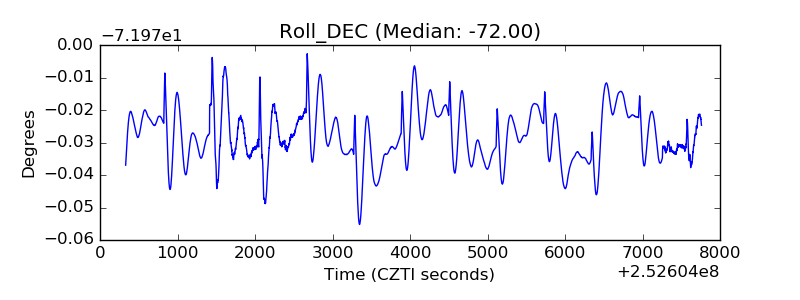 |
| _Roll_RA | 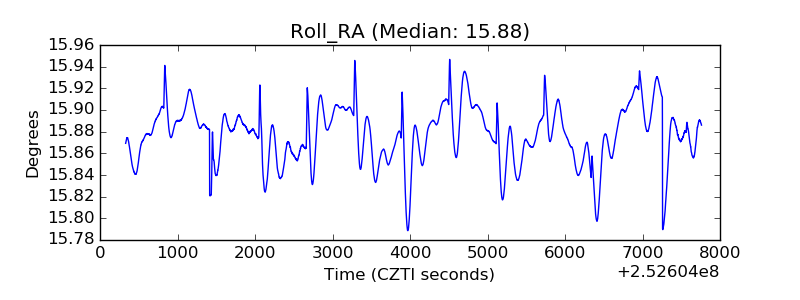 |
| Veto Counter | 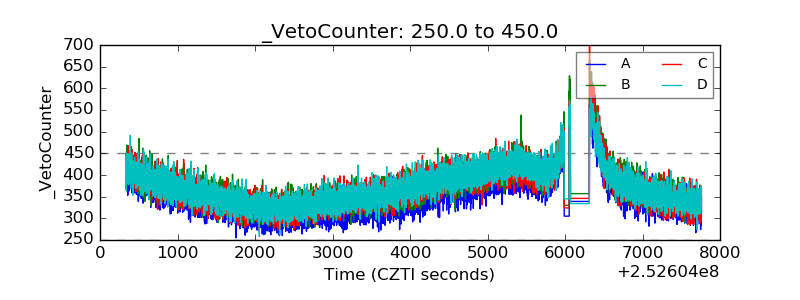 |