| Param | Original file | Final file |
|---|---|---|
| Filename | modeM0/AS1C03_005T01_9000001810_12250cztM0_level2.evt | modeM0/AS1C03_005T01_9000001810_12250cztM0_level2_quad_clean.evt |
| Size (bytes) | 579,709,440 | 137,862,720 |
| Size | 552.9 MB | 131.5 MB |
| Events in quadrant A | 4,376,630 | 924,393 |
| Events in quadrant B | 4,780,944 | 916,219 |
| Events in quadrant C | 3,583,076 | 921,741 |
| Events in quadrant D | 4,294,898 | 878,808 |
| Mode M0 | |||
|---|---|---|---|
| Quadrant | BADHDUFLAG | Total packets | Discarded packets |
| A | 0 | 18119 | 3 |
| B | 0 | 19359 | 2 |
| C | 0 | 16220 | 2 |
| D | 0 | 18264 | 2 |
| Mode SS | |||
|---|---|---|---|
| Quadrant | BADHDUFLAG | Total packets | Discarded packets |
| A | 0 | 156 | 0 |
| B | 0 | 156 | 0 |
| C | 0 | 156 | 0 |
| D | 0 | 156 | 0 |
| Mode M9 | |||
|---|---|---|---|
| Quadrant | BADHDUFLAG | Total packets | Discarded packets |
| A | 0 | 6 | 0 |
| B | 0 | 6 | 0 |
| C | 0 | 6 | 0 |
| D | 0 | 6 | 0 |
| Quadrant | Total seconds | Saturated seconds | Saturation percentage |
|---|---|---|---|
| A | 7687 | 163 | 2.120463% |
| B | 7687 | 401 | 5.216599% |
| C | 7687 | 48 | 0.624431% |
| D | 7688 | 223 | 2.900624% |
Noise dominated data is calculated using 1-second bins in cleaned event files. If a bin has >2000 counts, and if more than 50% of those come from <1% of pixels, then it is considered to be noise-dominated and hence unusable.
| Quadrant | # 1 sec bins | Bins with >0 counts | Bins with >2000 counts | High rate bins dominated by noise | Noise dominated (total time) | Noise dominated (detector-on time) | Marked lightcurve |
|---|---|---|---|---|---|---|---|
| A | 8203 | 7691 | 14 | 14 | 0.17% | 0.18% | 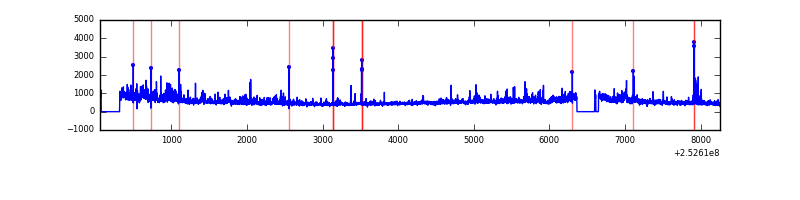 |
| B | 8203 | 7691 | 193 | 193 | 2.35% | 2.51% |  |
| C | 8203 | 7691 | 21 | 21 | 0.26% | 0.27% |  |
| D | 8204 | 7692 | 136 | 136 | 1.66% | 1.77% | 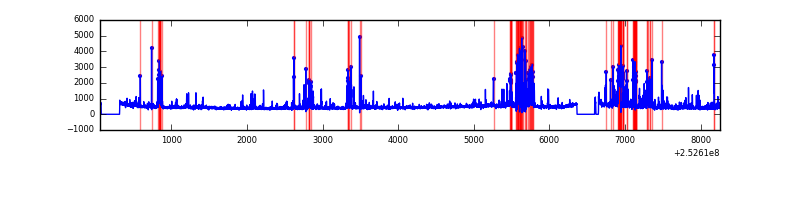 |
Top three noisy pixels from each quadrant. If the there are fewer than three noisy pixels in the level2.evt file, extra rows are filled as -1
| Pixel properties | Quadrant properties | ||||||
|---|---|---|---|---|---|---|---|
| Quadrant | DetID | PixID | Counts | Sigma | Mean | Median | Sigma |
| A | 13 | 251 | 376923 | 2073.44 | 883 | 865 | 181.4 |
| A | 1 | 162 | 127306 | 697.15 | 883 | 865 | 181.4 |
| A | 9 | 143 | 102122 | 558.29 | 883 | 865 | 181.4 |
| B | 4 | 239 | 994461 | 6059.43 | 873 | 852 | 164.0 |
| B | 0 | 219 | 140830 | 853.64 | 873 | 852 | 164.0 |
| B | 0 | 229 | 49096 | 294.21 | 873 | 852 | 164.0 |
| C | 15 | 208 | 173733 | 876.9 | 850 | 853 | 197.1 |
| C | 1 | 16 | 39852 | 197.81 | 850 | 853 | 197.1 |
| C | 4 | 175 | 34981 | 173.11 | 850 | 853 | 197.1 |
| D | 1 | 52 | 343670 | 1671.6 | 841 | 815 | 205.1 |
| D | 10 | 199 | 209469 | 1017.3 | 841 | 815 | 205.1 |
| D | 13 | 172 | 191228 | 928.37 | 841 | 815 | 205.1 |
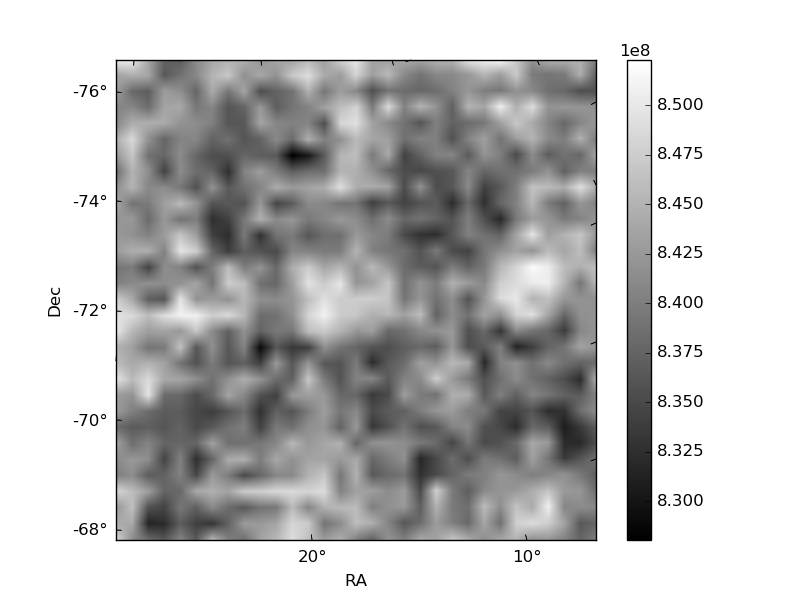
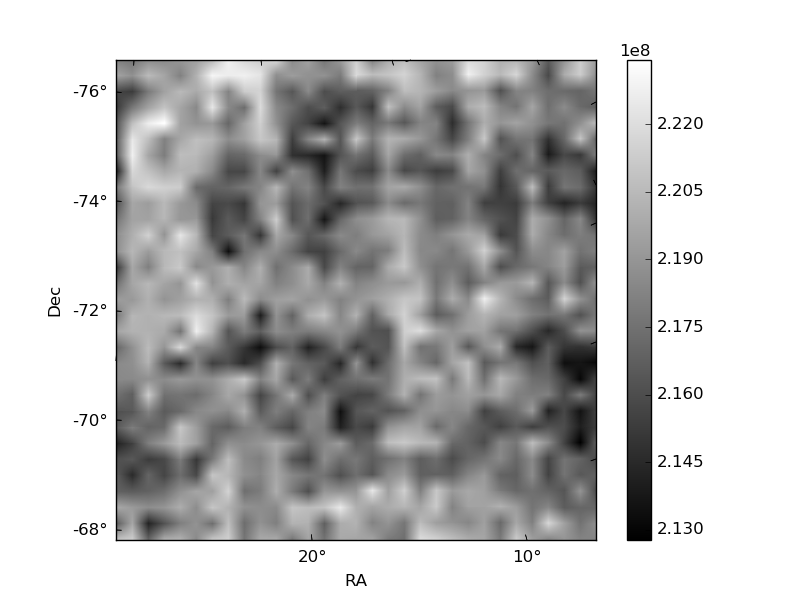
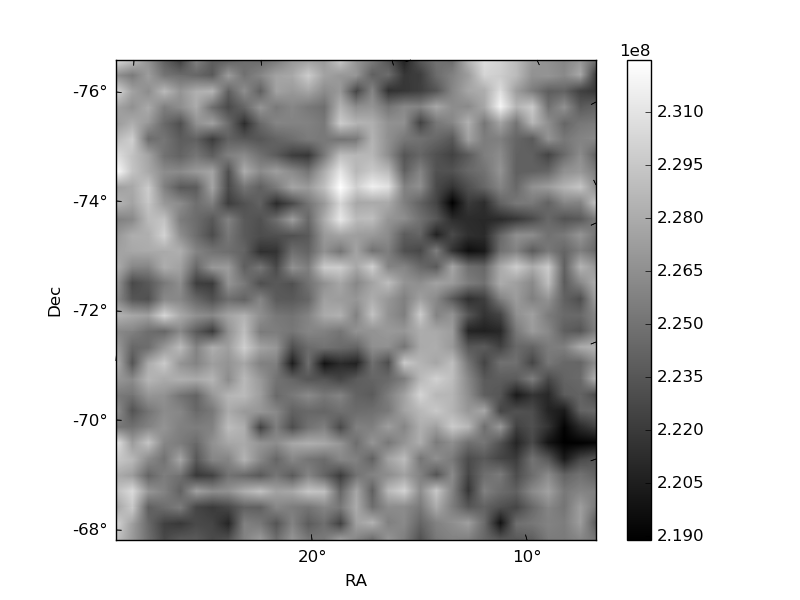
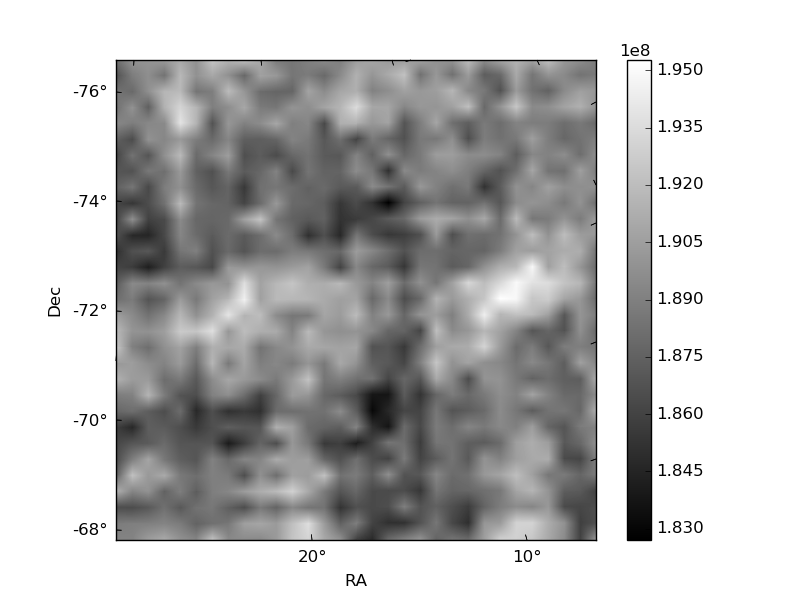
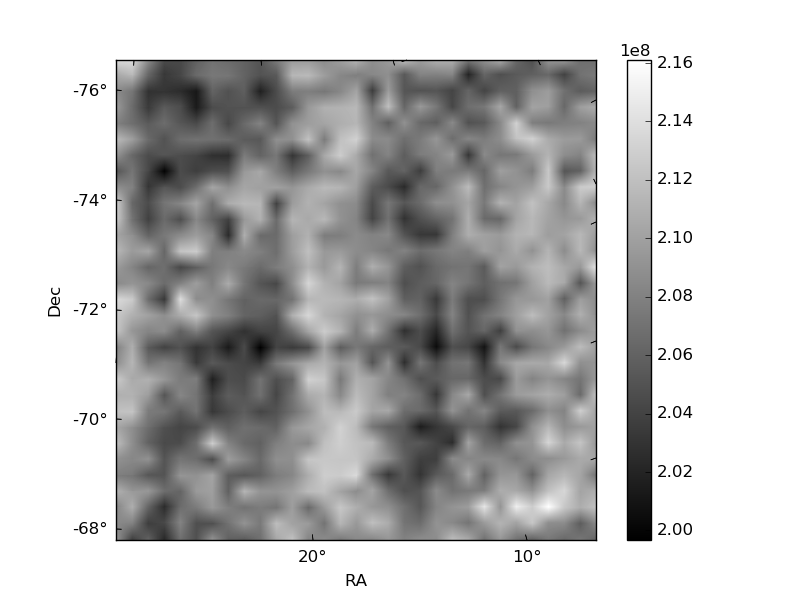
Histogram calculated using DETX and DETY for each event in the final _common_clean file
| Quadrant A |  |
 |
Quadrant B |
|---|---|---|---|
| Quadrant D | 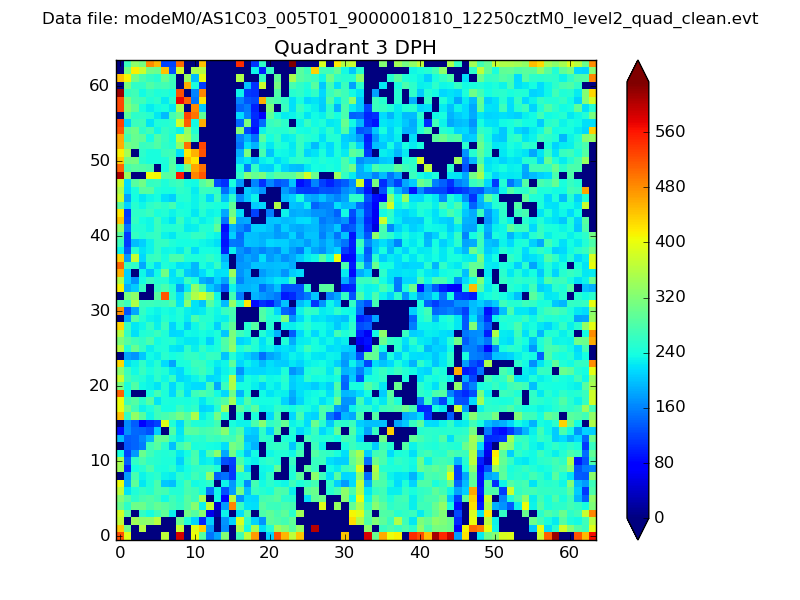 |
 |
Quadrant C |
| Plot type | Count rate plots | Images |
|---|---|---|
| Comparison with Poisson distribution Blue bars denote a histogram of data divided into 1 sec bins. Red curve is a Poisson curve with rate = median count rate of data. |
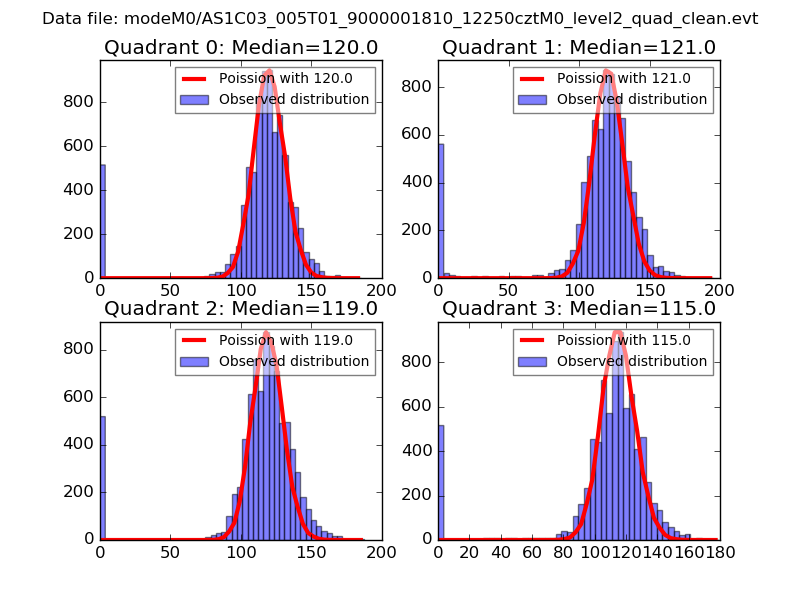 |
 |
| Quadrant-wise count rates Data is divided into 100 sec bins |
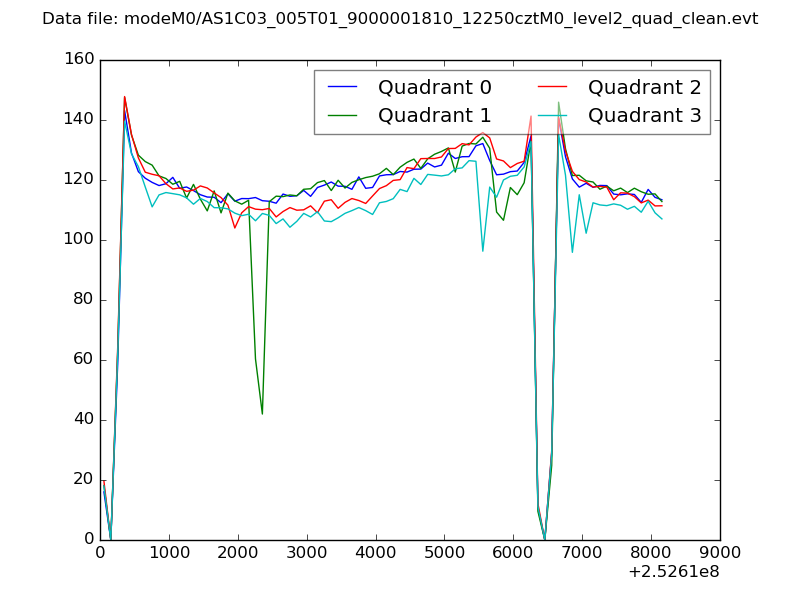 |
|
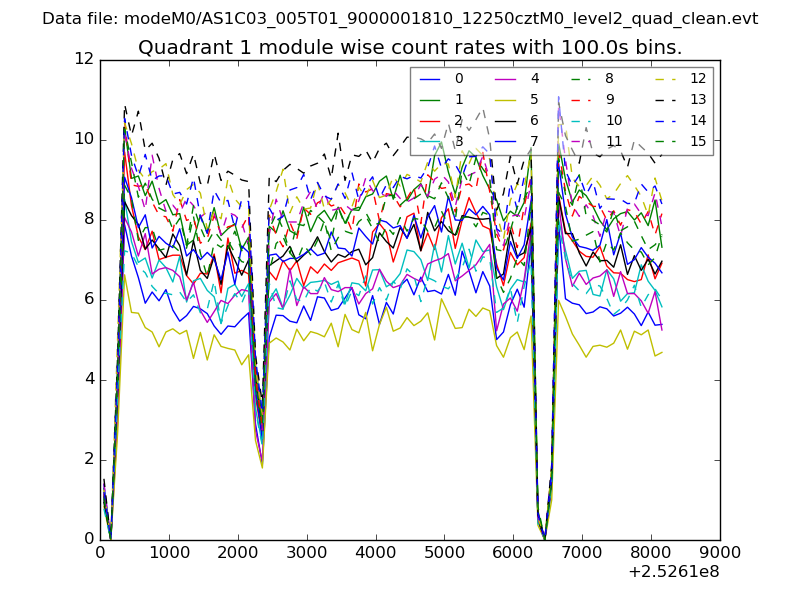
| Module-wise count rates for Quadrant A Data is divided into 100 sec bins |
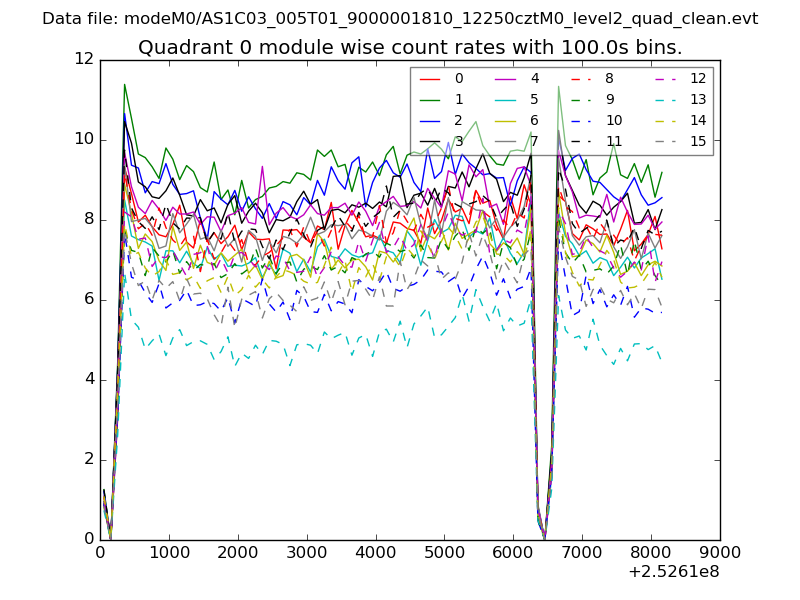 |
 |
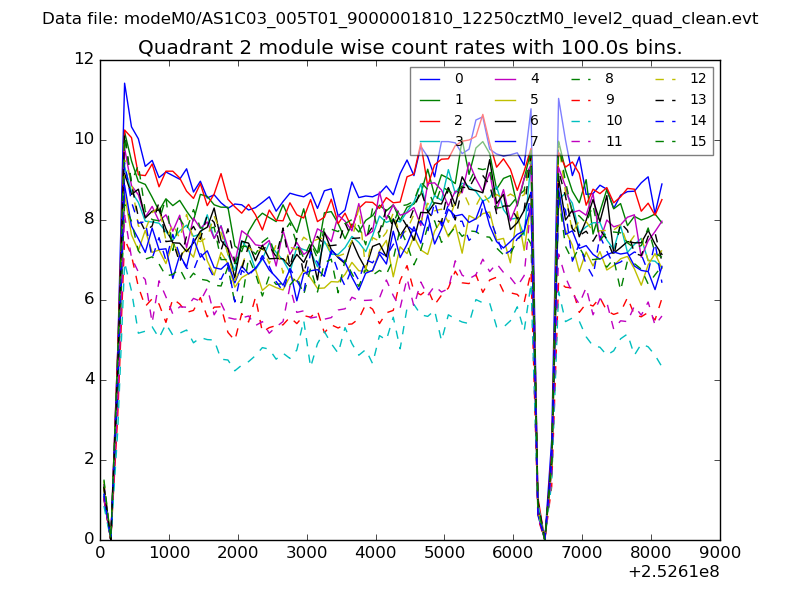
| Module-wise count rates for Quadrant B Data is divided into 100 sec bins |
 |
 |
| Module-wise count rates for Quadrant C Data is divided into 100 sec bins |
 |
 |
| Module-wise count rates for Quadrant D Data is divided into 100 sec bins |
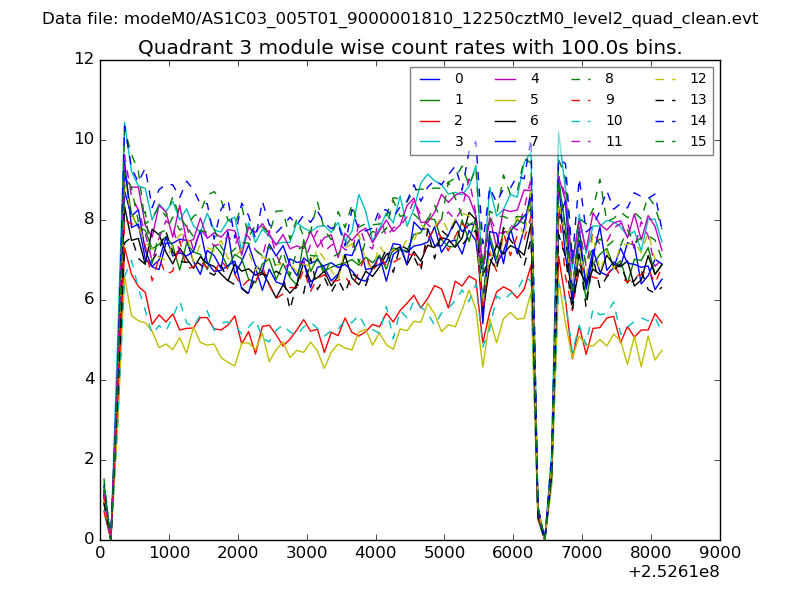 |
 |
| Parameter | Plot |
|---|---|
| CZT HV Monitor | 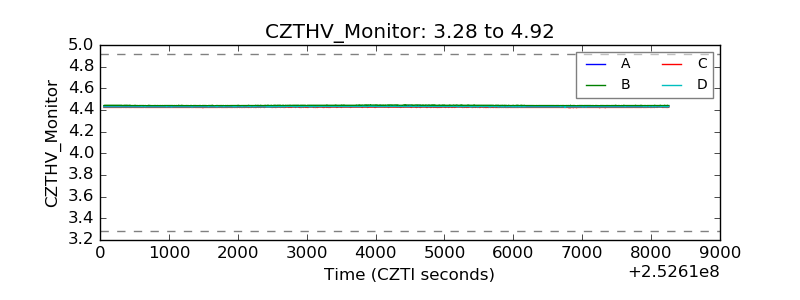 |
| D_VDD | 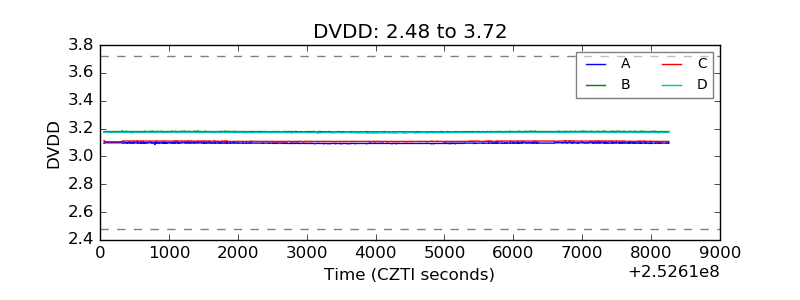 |
| Temperature 1 | 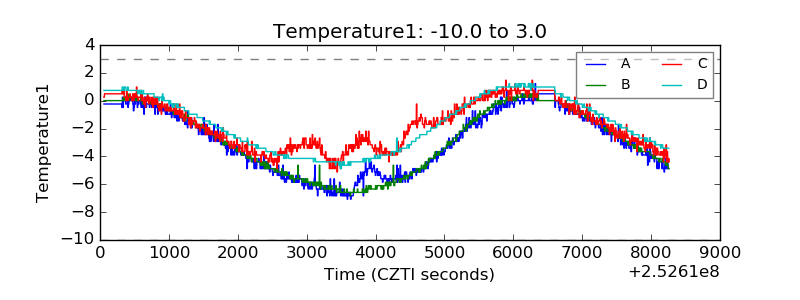 |
| Veto HV Monitor | 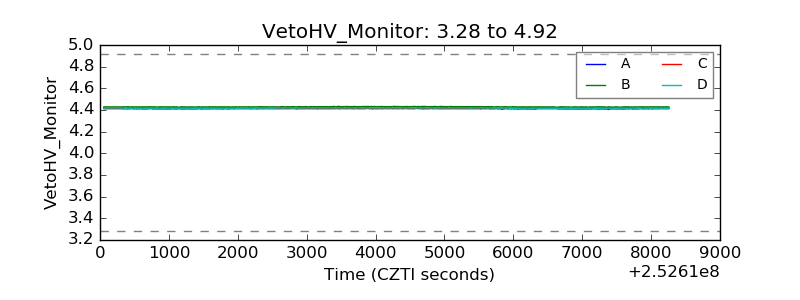 |
| Veto LLD | 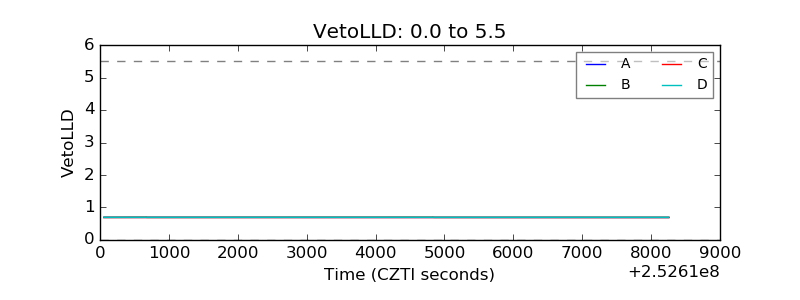 |
| Alpha Counter | 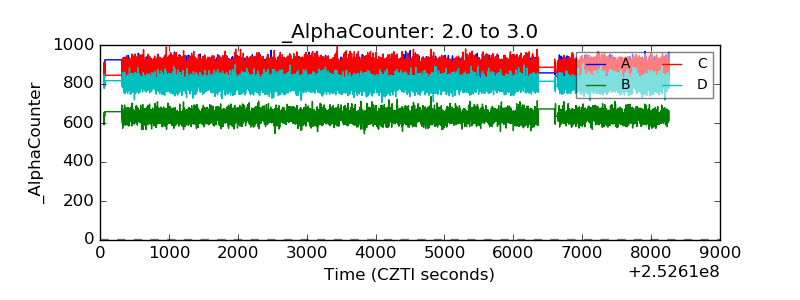 |
| _CPM_Rate | 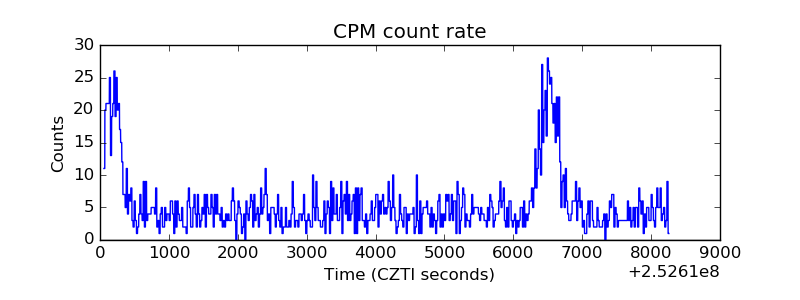 |
| CZT Counter | 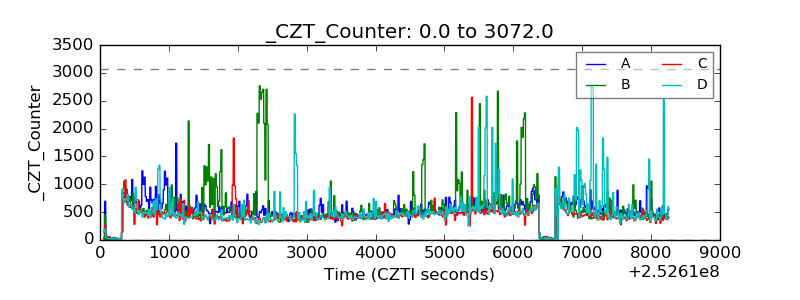 |
| +2.5 Volts monitor |  |
| +5 Volts monitor |  |
| _ROLL_ROT |  |
| _Roll_DEC | 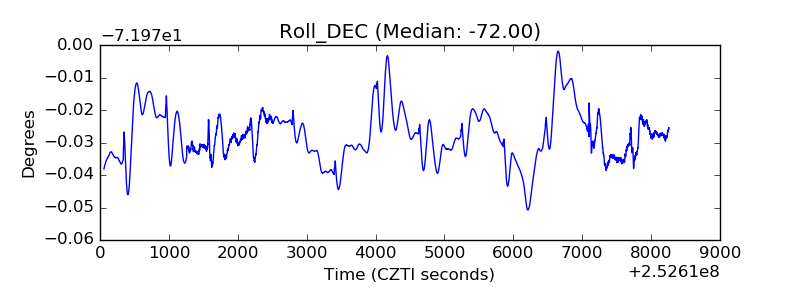 |
| _Roll_RA | 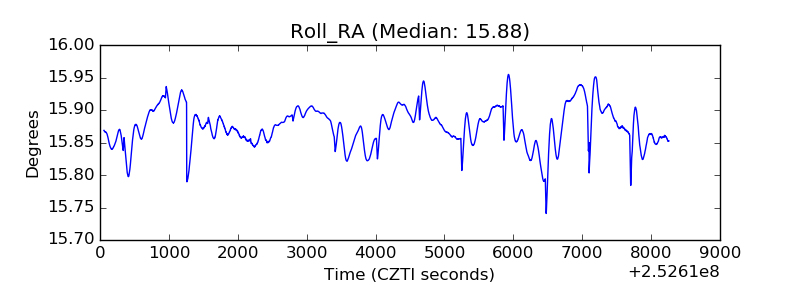 |
| Veto Counter | 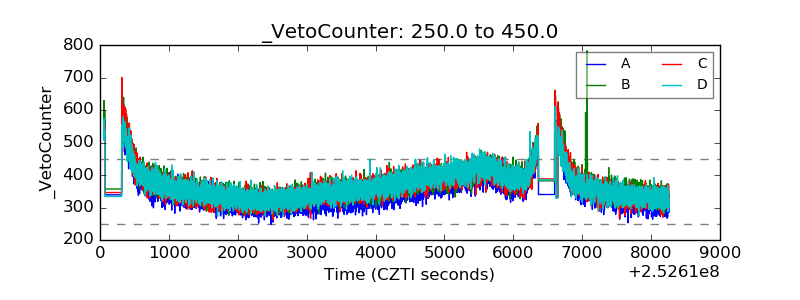 |