| Param | Original file | Final file |
|---|---|---|
| Filename | modeM0/AS1C03_005T01_9000001810_12253cztM0_level2.evt | modeM0/AS1C03_005T01_9000001810_12253cztM0_level2_quad_clean.evt |
| Size (bytes) | 906,598,080 | 214,683,840 |
| Size | 864.6 MB | 204.7 MB |
| Events in quadrant A | 6,535,573 | 1,443,268 |
| Events in quadrant B | 6,941,620 | 1,447,421 |
| Events in quadrant C | 6,038,897 | 1,420,248 |
| Events in quadrant D | 7,123,985 | 1,356,930 |
| Mode M0 | |||
|---|---|---|---|
| Quadrant | BADHDUFLAG | Total packets | Discarded packets |
| A | 0 | 27515 | 4 |
| B | 0 | 28866 | 4 |
| C | 0 | 26473 | 4 |
| D | 0 | 29661 | 4 |
| Mode SS | |||
|---|---|---|---|
| Quadrant | BADHDUFLAG | Total packets | Discarded packets |
| A | 0 | 248 | 0 |
| B | 0 | 248 | 0 |
| C | 0 | 248 | 0 |
| D | 0 | 248 | 0 |
| Mode M9 | |||
|---|---|---|---|
| Quadrant | BADHDUFLAG | Total packets | Discarded packets |
| A | 0 | 9 | 0 |
| B | 0 | 9 | 0 |
| C | 0 | 9 | 0 |
| D | 0 | 10 | 0 |
| Quadrant | Total seconds | Saturated seconds | Saturation percentage |
|---|---|---|---|
| A | 12060 | 159 | 1.318408% |
| B | 12060 | 376 | 3.117745% |
| C | 12060 | 133 | 1.102819% |
| D | 12060 | 440 | 3.648425% |
Noise dominated data is calculated using 1-second bins in cleaned event files. If a bin has >2000 counts, and if more than 50% of those come from <1% of pixels, then it is considered to be noise-dominated and hence unusable.
| Quadrant | # 1 sec bins | Bins with >0 counts | Bins with >2000 counts | High rate bins dominated by noise | Noise dominated (total time) | Noise dominated (detector-on time) | Marked lightcurve |
|---|---|---|---|---|---|---|---|
| A | 13101 | 12065 | 10 | 10 | 0.08% | 0.08% | 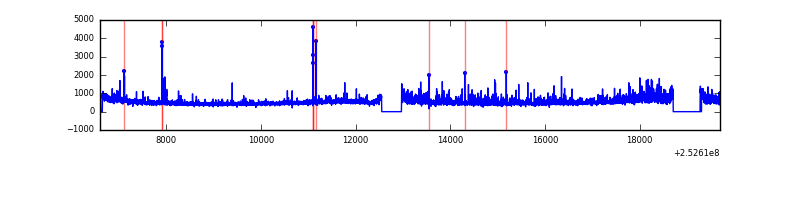 |
| B | 13101 | 12065 | 140 | 140 | 1.07% | 1.16% | 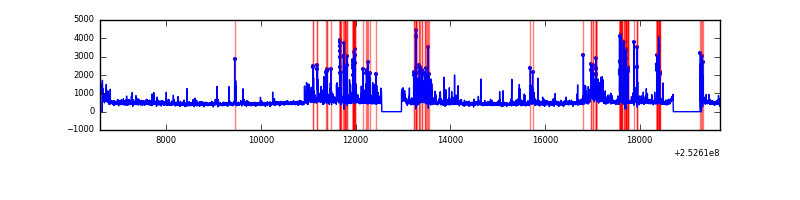 |
| C | 13101 | 12065 | 57 | 57 | 0.44% | 0.47% | 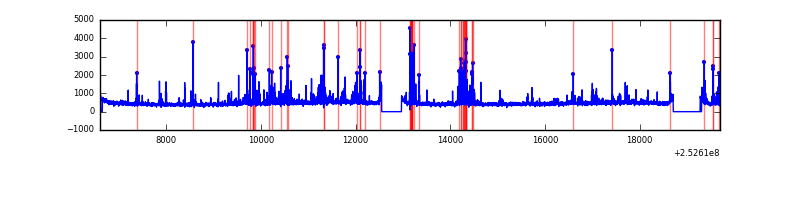 |
| D | 13101 | 12065 | 314 | 314 | 2.40% | 2.60% | 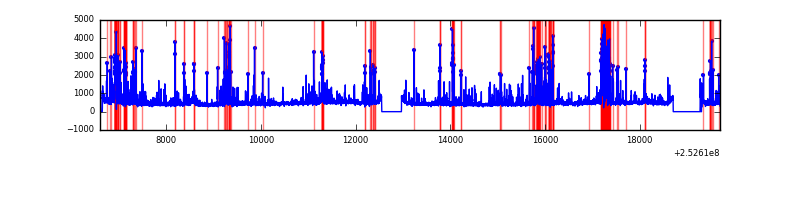 |
Top three noisy pixels from each quadrant. If the there are fewer than three noisy pixels in the level2.evt file, extra rows are filled as -1
| Pixel properties | Quadrant properties | ||||||
|---|---|---|---|---|---|---|---|
| Quadrant | DetID | PixID | Counts | Sigma | Mean | Median | Sigma |
| A | 1 | 162 | 298033 | 1062.4 | 1381 | 1354 | 279.3 |
| A | 13 | 251 | 226347 | 805.69 | 1381 | 1354 | 279.3 |
| A | 1 | 178 | 176292 | 626.45 | 1381 | 1354 | 279.3 |
| B | 4 | 239 | 887540 | 3446.39 | 1375 | 1342 | 257.1 |
| B | 0 | 229 | 134362 | 517.31 | 1375 | 1342 | 257.1 |
| B | 15 | 52 | 104791 | 402.31 | 1375 | 1342 | 257.1 |
| C | 15 | 208 | 654885 | 2125.92 | 1332 | 1337 | 307.4 |
| C | 1 | 16 | 102436 | 328.86 | 1332 | 1337 | 307.4 |
| C | 4 | 175 | 45064 | 142.24 | 1332 | 1337 | 307.4 |
| D | 1 | 52 | 1064029 | 3340.59 | 1320 | 1281 | 318.1 |
| D | 13 | 104 | 199926 | 624.41 | 1320 | 1281 | 318.1 |
| D | 13 | 172 | 192428 | 600.84 | 1320 | 1281 | 318.1 |
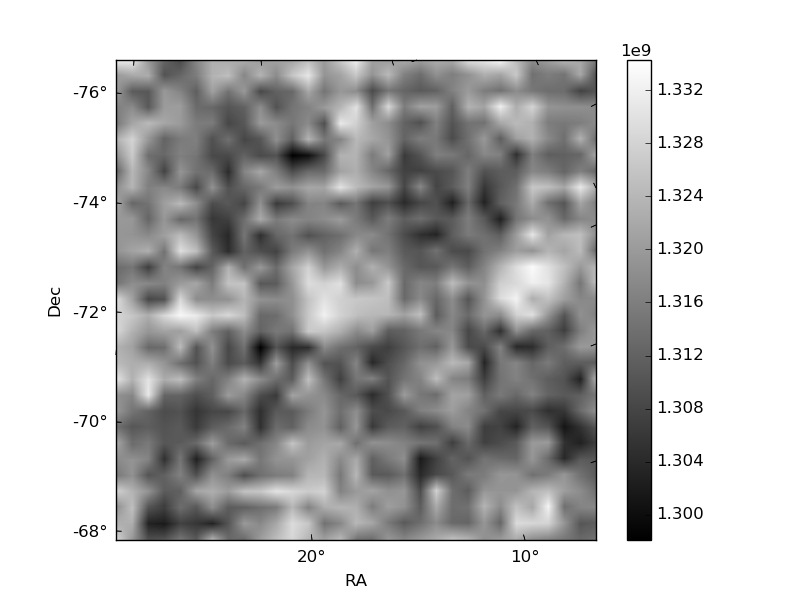
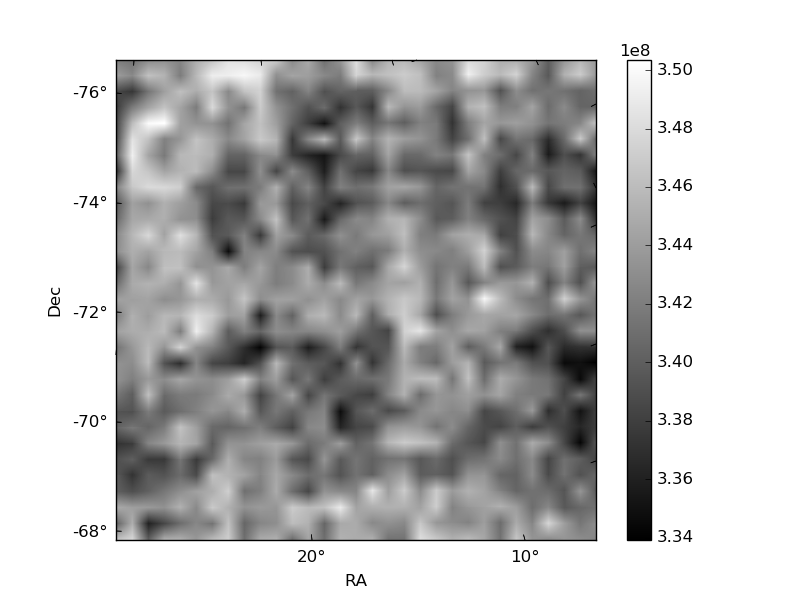
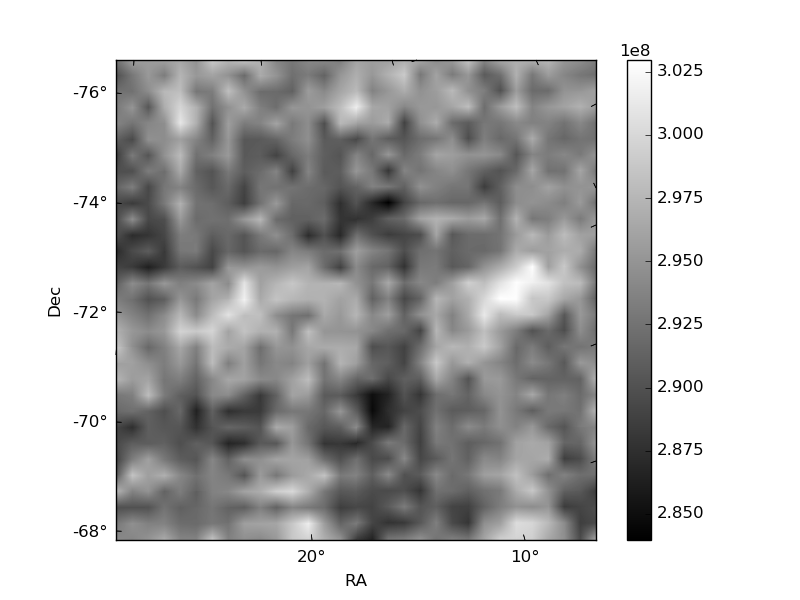
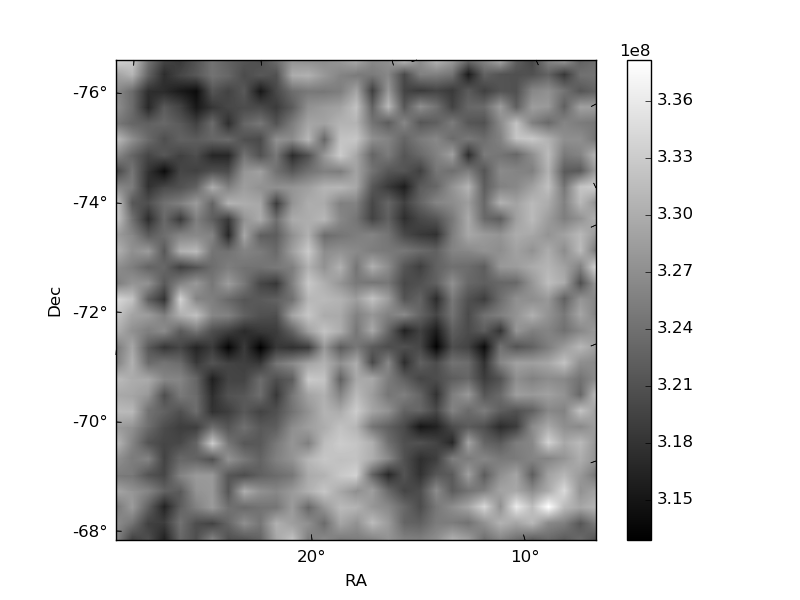
Histogram calculated using DETX and DETY for each event in the final _common_clean file
| Quadrant A | 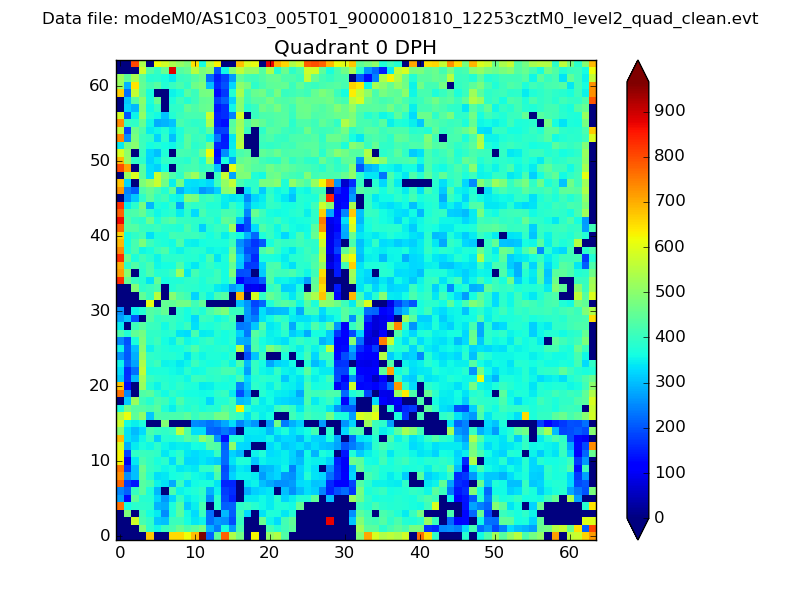 |
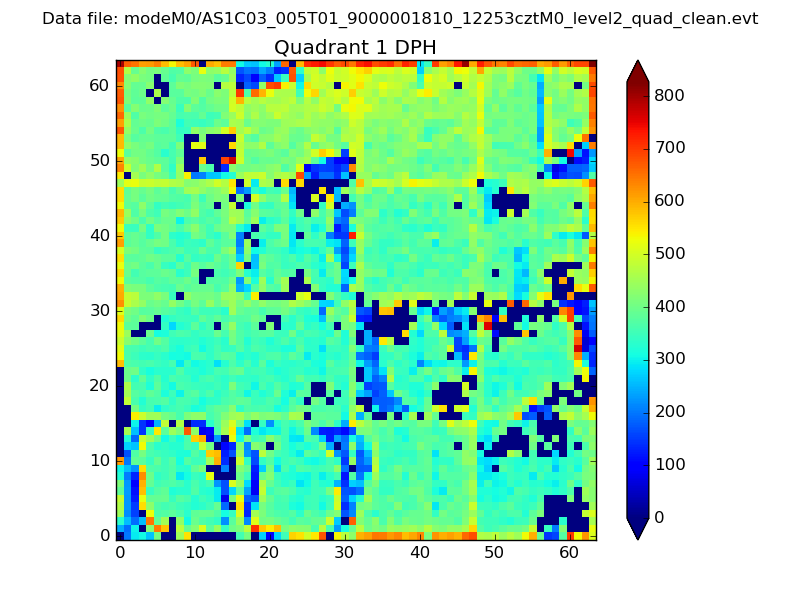 |
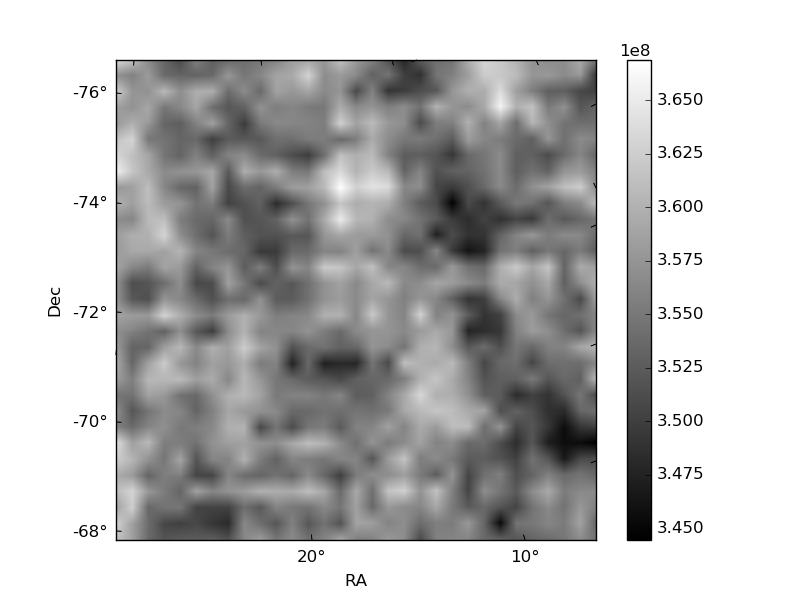
Quadrant B |
|---|---|---|---|
| Quadrant D | 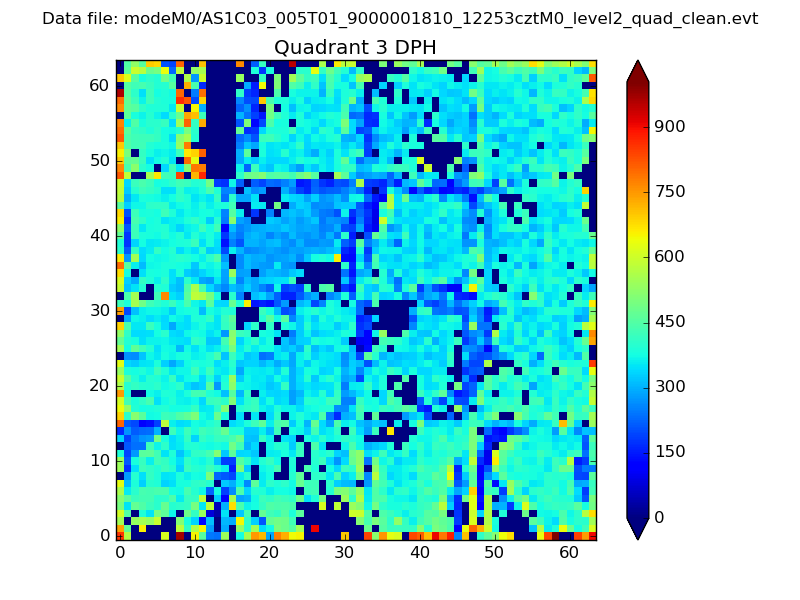 |
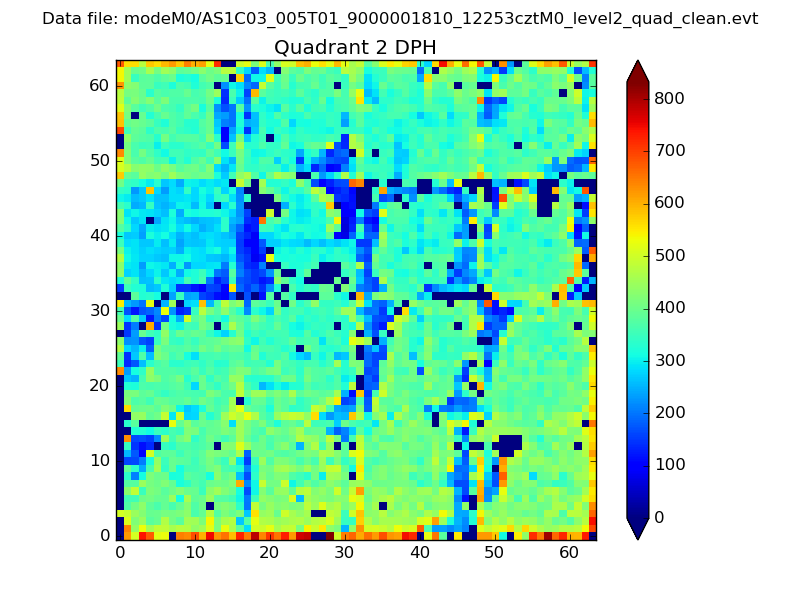 |
Quadrant C |
| Plot type | Count rate plots | Images |
|---|---|---|
| Comparison with Poisson distribution Blue bars denote a histogram of data divided into 1 sec bins. Red curve is a Poisson curve with rate = median count rate of data. |
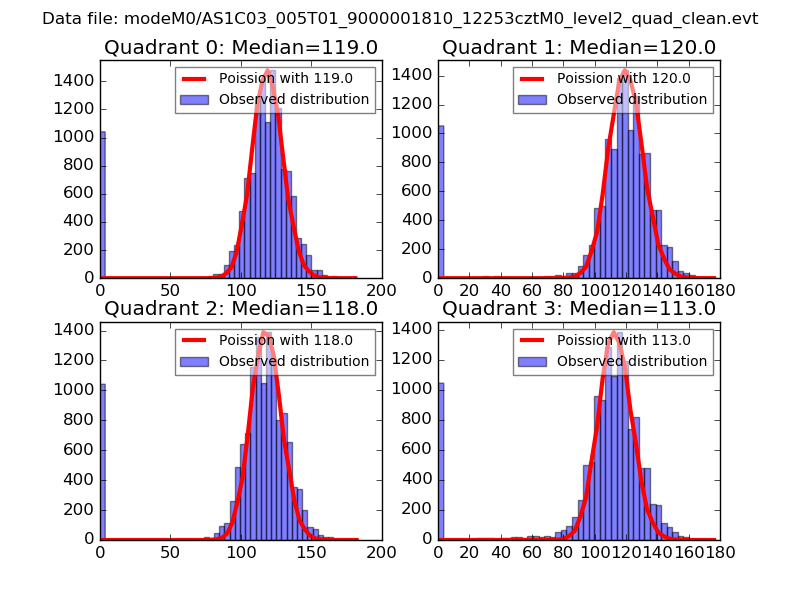 |
 |
| Quadrant-wise count rates Data is divided into 100 sec bins |
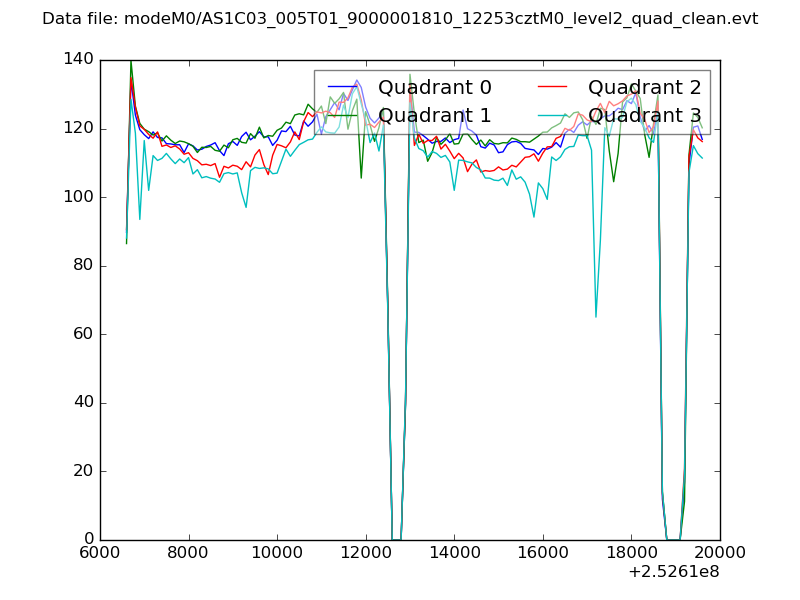 |
|
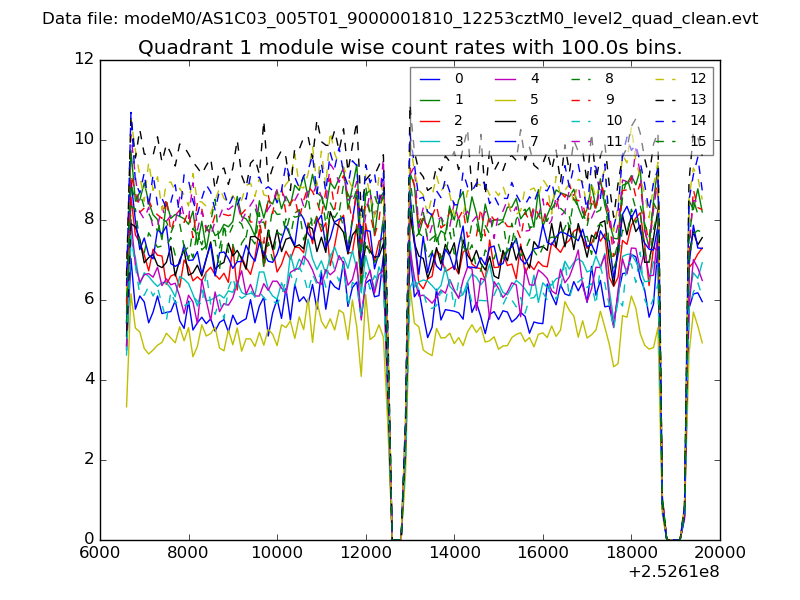
| Module-wise count rates for Quadrant A Data is divided into 100 sec bins |
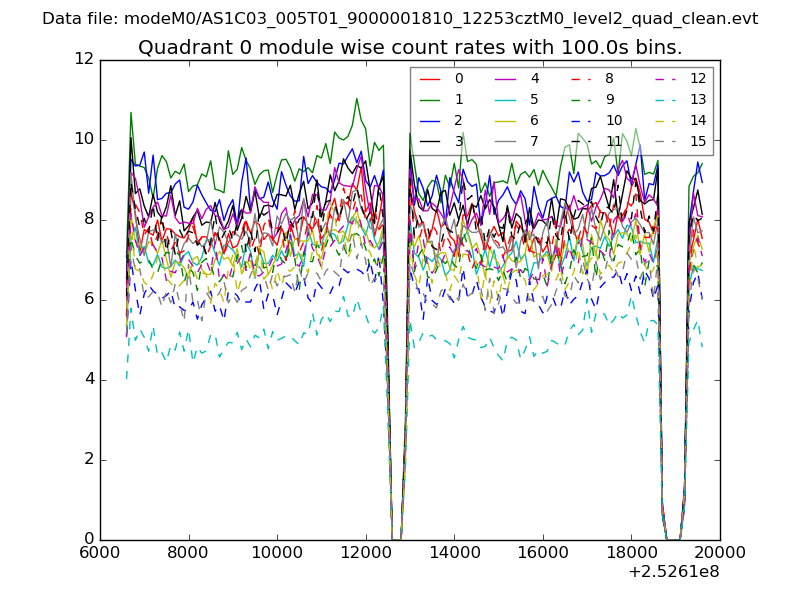 |
 |
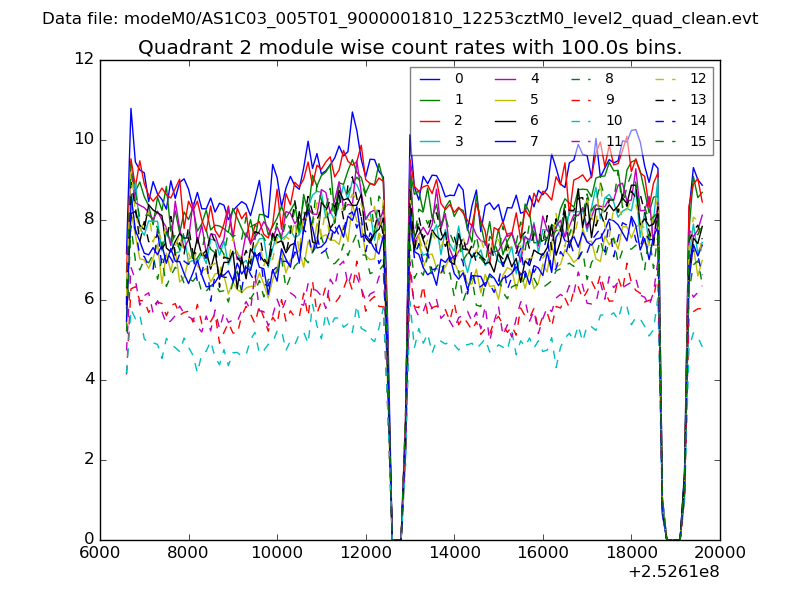
| Module-wise count rates for Quadrant B Data is divided into 100 sec bins |
 |
 |
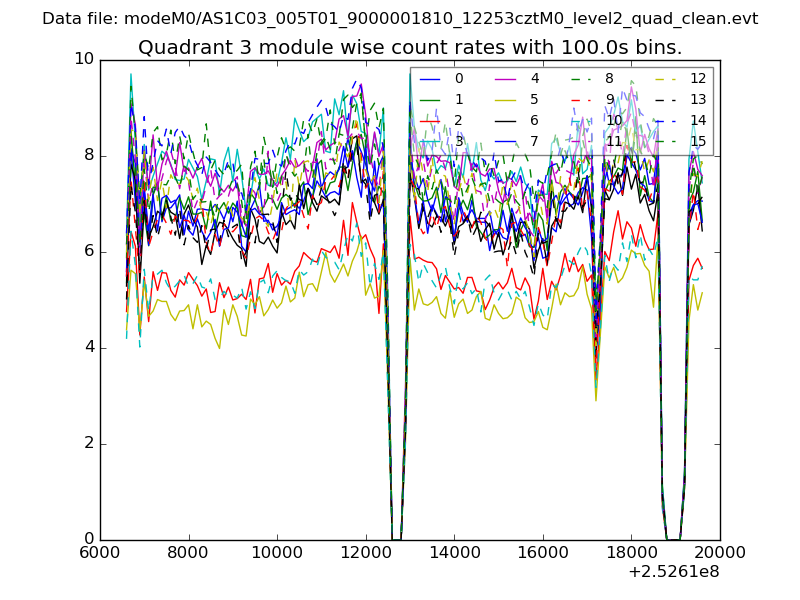
| Module-wise count rates for Quadrant C Data is divided into 100 sec bins |
 |
 |
| Module-wise count rates for Quadrant D Data is divided into 100 sec bins |
 |
 |
| Parameter | Plot |
|---|---|
| CZT HV Monitor | 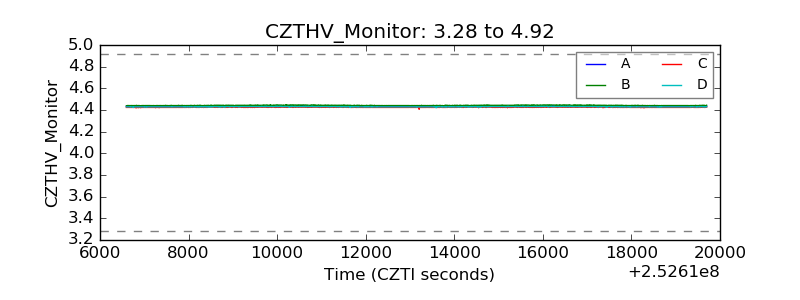 |
| D_VDD | 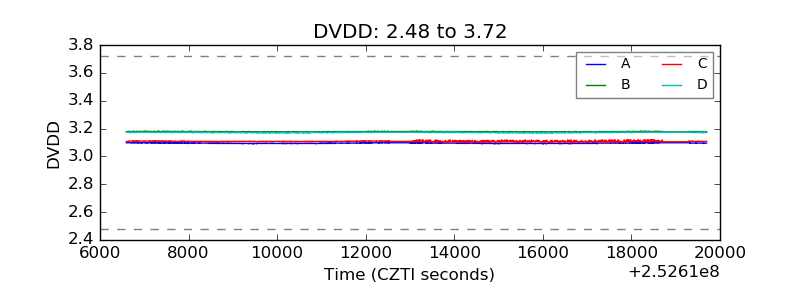 |
| Temperature 1 | 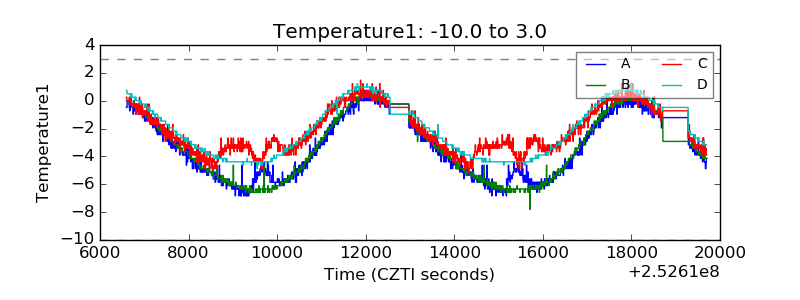 |
| Veto HV Monitor | 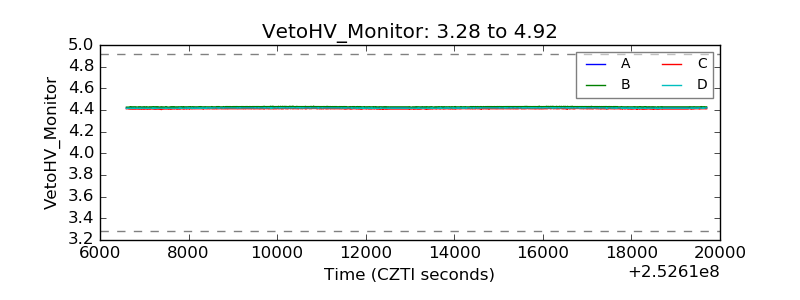 |
| Veto LLD | 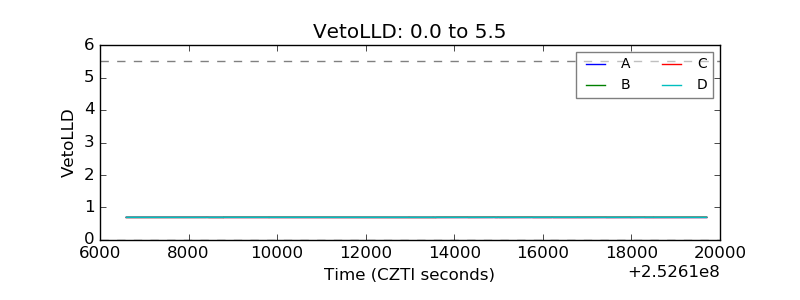 |
| Alpha Counter | 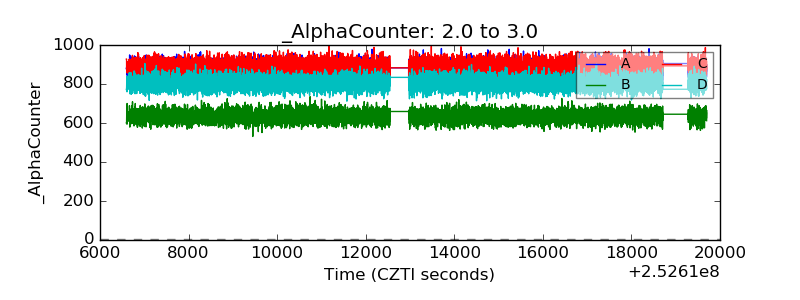 |
| _CPM_Rate | 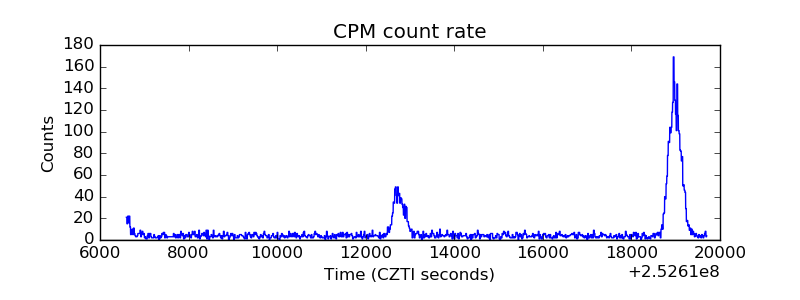 |
| CZT Counter | 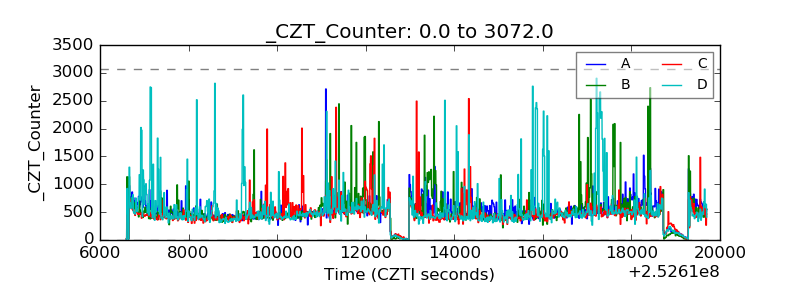 |
| +2.5 Volts monitor |  |
| +5 Volts monitor |  |
| _ROLL_ROT | 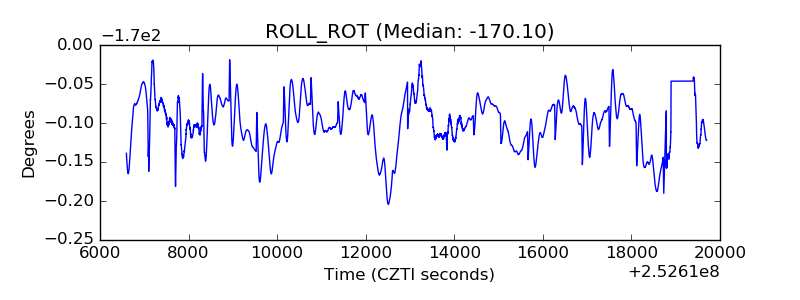 |
| _Roll_DEC | 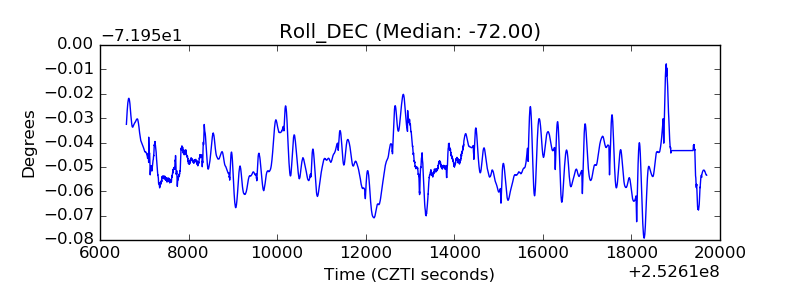 |
| _Roll_RA | 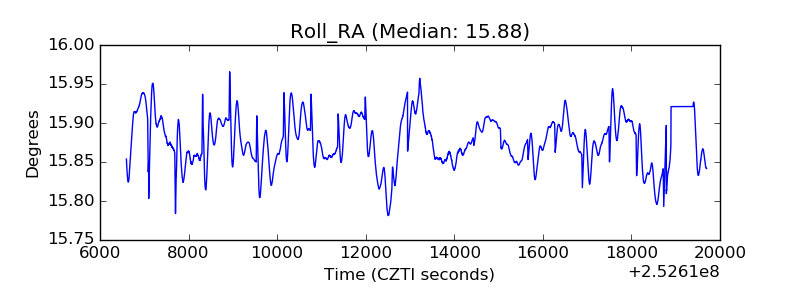 |
| Veto Counter | 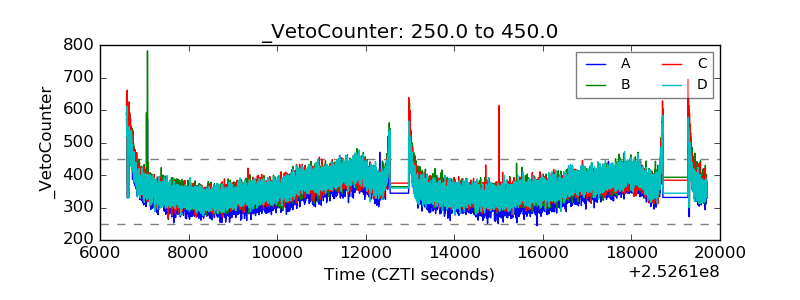 |