| Param | Original file | Final file |
|---|---|---|
| Filename | modeM0/AS1G08_006T04_9000001812_12253cztM0_level2.evt | modeM0/AS1G08_006T04_9000001812_12253cztM0_level2_quad_clean.evt |
| Size (bytes) | 360,820,800 | 84,764,160 |
| Size | 344.1 MB | 80.8 MB |
| Events in quadrant A | 2,514,318 | 568,344 |
| Events in quadrant B | 3,361,768 | 564,084 |
| Events in quadrant C | 2,377,765 | 558,942 |
| Events in quadrant D | 2,347,369 | 539,105 |
| Mode M0 | |||
|---|---|---|---|
| Quadrant | BADHDUFLAG | Total packets | Discarded packets |
| A | 0 | 10656 | 1 |
| B | 0 | 13315 | 0 |
| C | 0 | 10474 | 0 |
| D | 0 | 10352 | 0 |
| Mode SS | |||
|---|---|---|---|
| Quadrant | BADHDUFLAG | Total packets | Discarded packets |
| A | 0 | 96 | 0 |
| B | 0 | 96 | 0 |
| C | 0 | 96 | 0 |
| D | 0 | 96 | 0 |
| Quadrant | Total seconds | Saturated seconds | Saturation percentage |
|---|---|---|---|
| A | 4792 | 56 | 1.168614% |
| B | 4792 | 191 | 3.985810% |
| C | 4792 | 51 | 1.064274% |
| D | 4792 | 47 | 0.980801% |
Noise dominated data is calculated using 1-second bins in cleaned event files. If a bin has >2000 counts, and if more than 50% of those come from <1% of pixels, then it is considered to be noise-dominated and hence unusable.
| Quadrant | # 1 sec bins | Bins with >0 counts | Bins with >2000 counts | High rate bins dominated by noise | Noise dominated (total time) | Noise dominated (detector-on time) | Marked lightcurve |
|---|---|---|---|---|---|---|---|
| A | 4793 | 4793 | 7 | 7 | 0.15% | 0.15% | 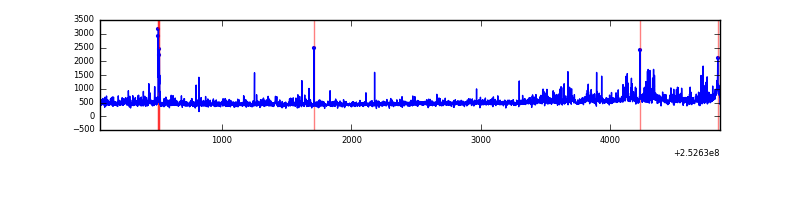 |
| B | 4793 | 4793 | 103 | 103 | 2.15% | 2.15% |  |
| C | 4793 | 4793 | 22 | 22 | 0.46% | 0.46% | 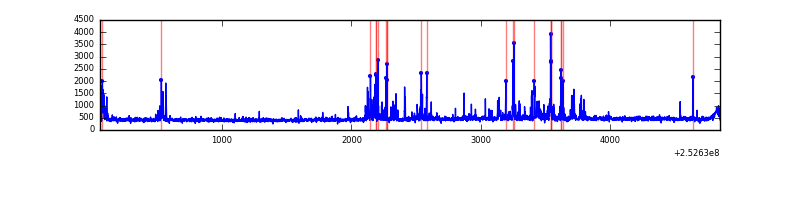 |
| D | 4793 | 4793 | 22 | 22 | 0.46% | 0.46% |  |
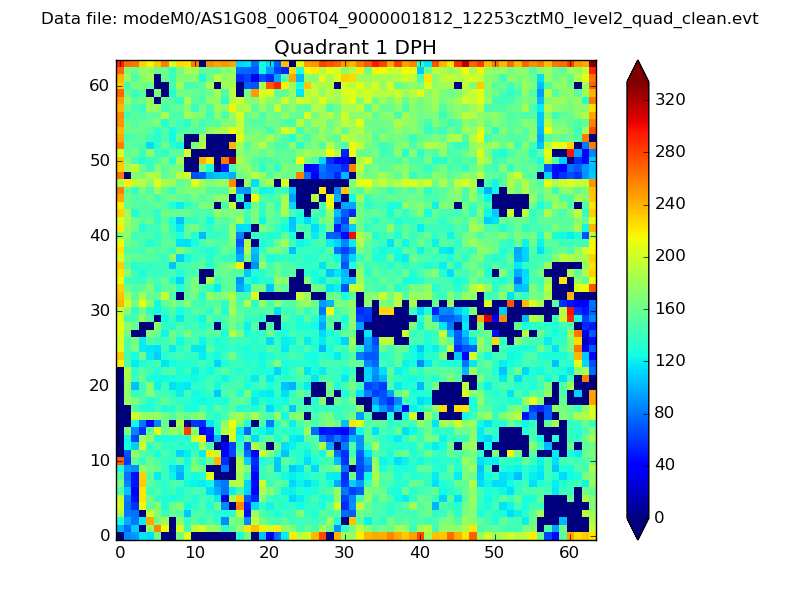
Top three noisy pixels from each quadrant. If the there are fewer than three noisy pixels in the level2.evt file, extra rows are filled as -1
| Pixel properties | Quadrant properties | ||||||
|---|---|---|---|---|---|---|---|
| Quadrant | DetID | PixID | Counts | Sigma | Mean | Median | Sigma |
| A | 1 | 162 | 90005 | 787.89 | 541 | 529 | 113.6 |
| A | 7 | 16 | 63810 | 557.23 | 541 | 529 | 113.6 |
| A | 1 | 178 | 52141 | 454.48 | 541 | 529 | 113.6 |
| B | 4 | 239 | 816130 | 7953.64 | 537 | 524 | 102.5 |
| B | 4 | 206 | 123120 | 1195.53 | 537 | 524 | 102.5 |
| B | 11 | 51 | 114977 | 1116.13 | 537 | 524 | 102.5 |
| C | 15 | 208 | 299003 | 2436.18 | 524 | 526 | 122.5 |
| C | 4 | 175 | 14995 | 118.1 | 524 | 526 | 122.5 |
| C | 0 | 207 | 7251 | 54.89 | 524 | 526 | 122.5 |
| D | 1 | 52 | 201648 | 1599.4 | 525 | 510 | 125.8 |
| D | 13 | 249 | 32821 | 256.93 | 525 | 510 | 125.8 |
| D | 7 | 71 | 29025 | 226.74 | 525 | 510 | 125.8 |
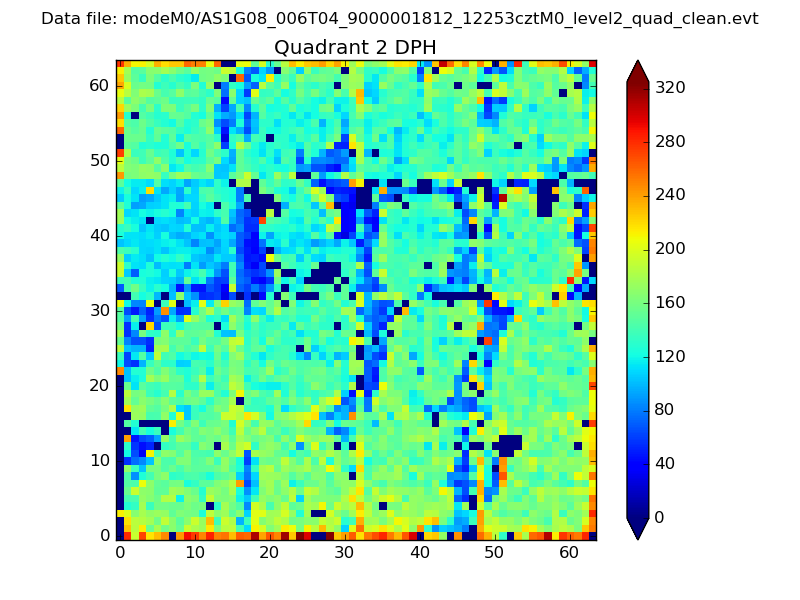
Histogram calculated using DETX and DETY for each event in the final _common_clean file
| Quadrant A | 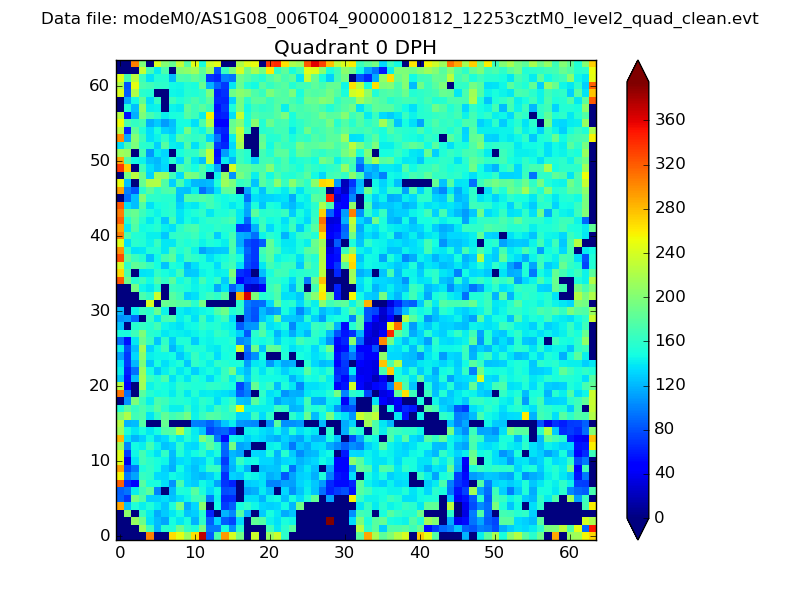 |
 |
Quadrant B |
|---|---|---|---|
| Quadrant D | 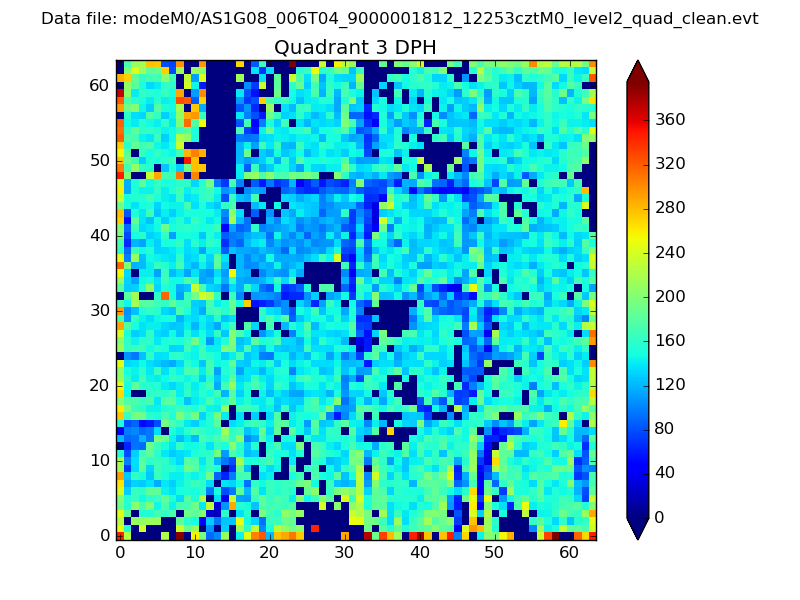 |
 |
Quadrant C |
| Plot type | Count rate plots | Images |
|---|---|---|
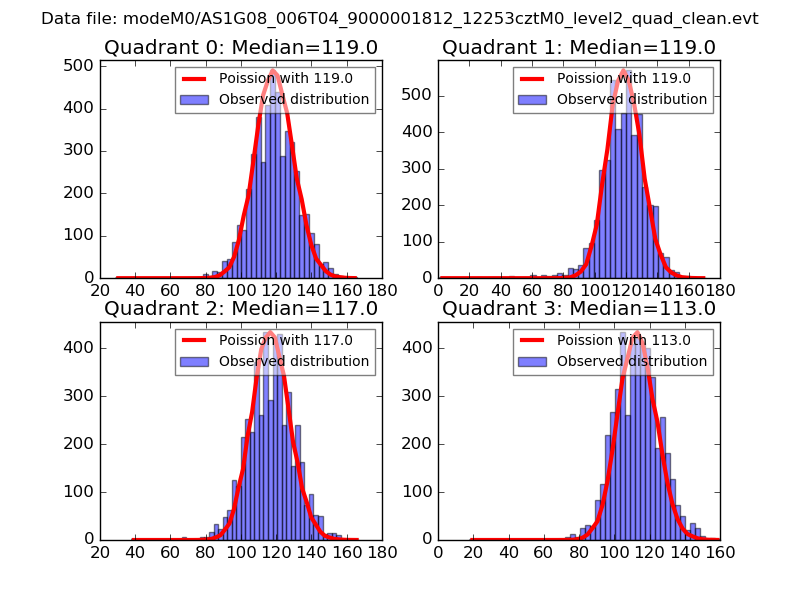
| Comparison with Poisson distribution Blue bars denote a histogram of data divided into 1 sec bins. Red curve is a Poisson curve with rate = median count rate of data. |
 |
 |
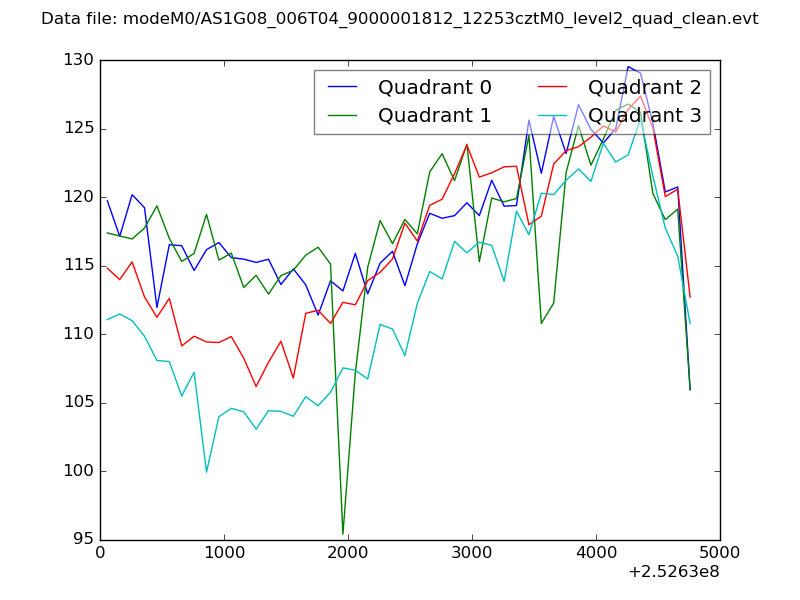
| Quadrant-wise count rates Data is divided into 100 sec bins |
 |
|
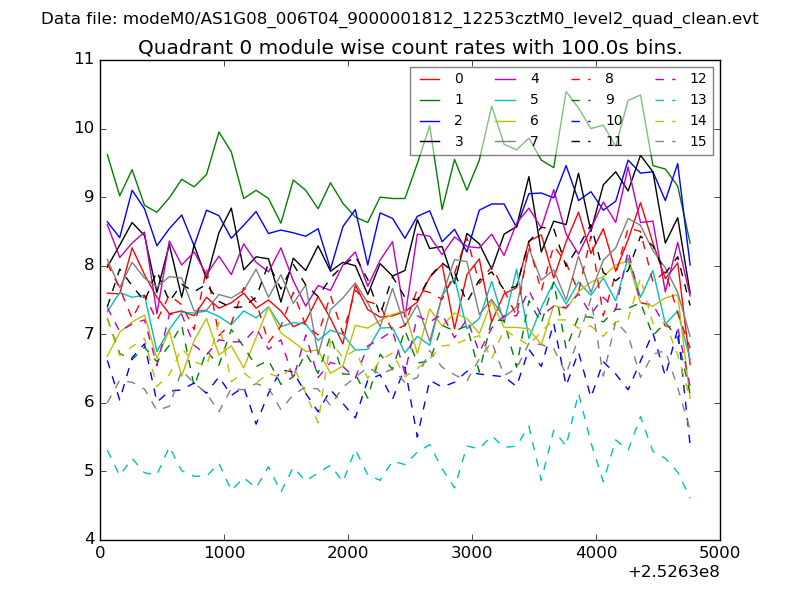
| Module-wise count rates for Quadrant A Data is divided into 100 sec bins |
 |
 |
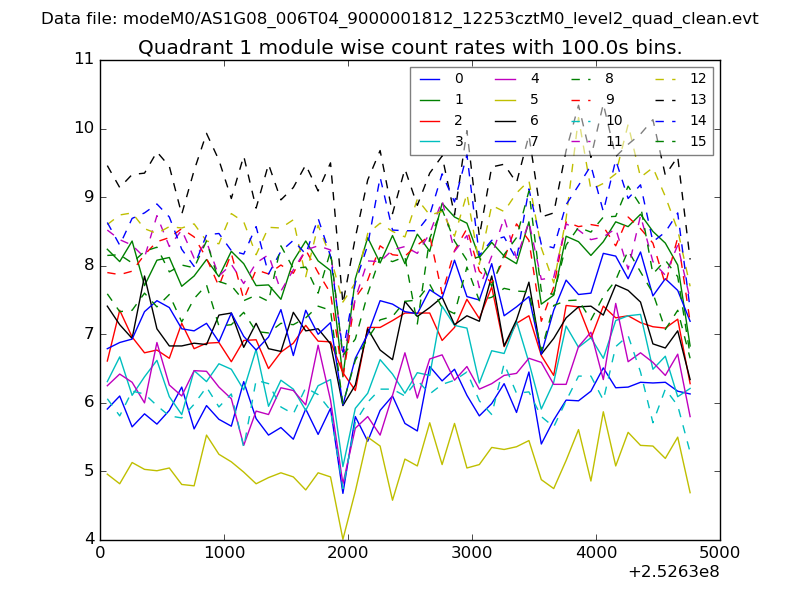
| Module-wise count rates for Quadrant B Data is divided into 100 sec bins |
 |
 |
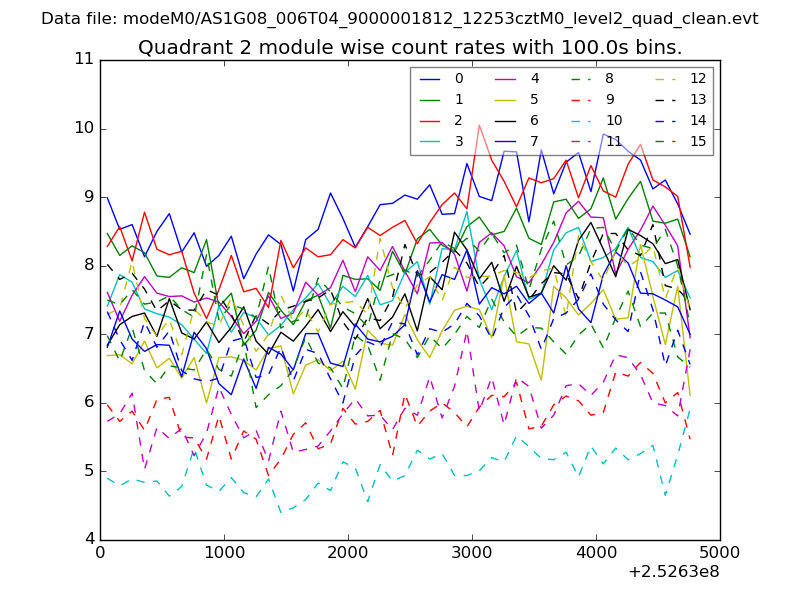
| Module-wise count rates for Quadrant C Data is divided into 100 sec bins |
 |
 |
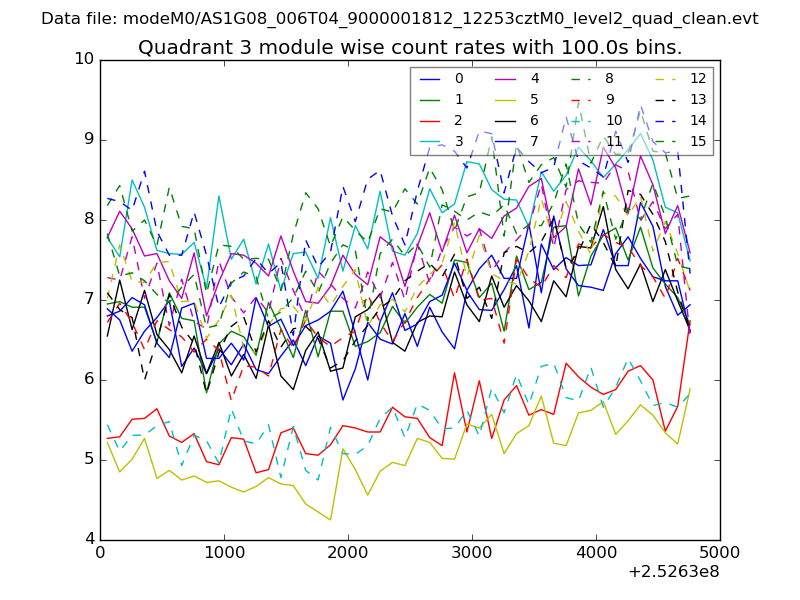
| Module-wise count rates for Quadrant D Data is divided into 100 sec bins |
 |
 |
| Parameter | Plot |
|---|---|
| CZT HV Monitor |  |
| D_VDD | 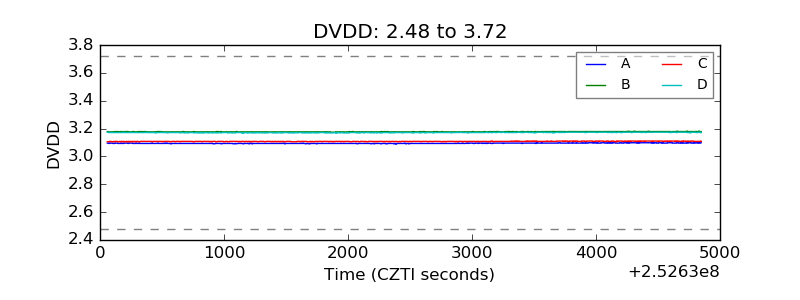 |
| Temperature 1 | 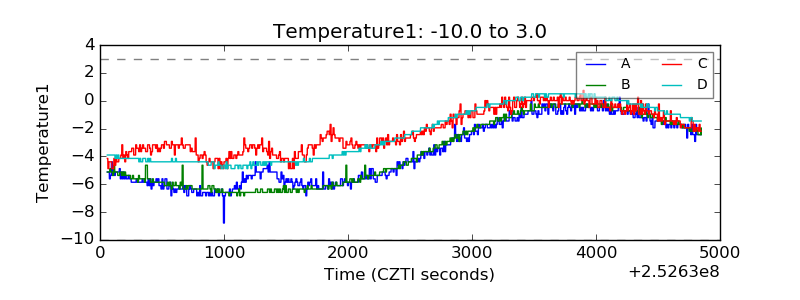 |
| Veto HV Monitor | 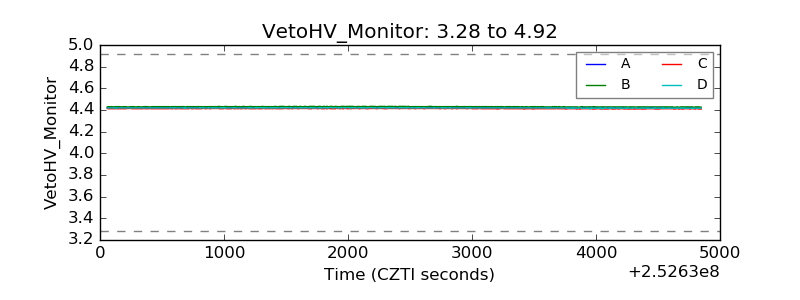 |
| Veto LLD |  |
| Alpha Counter | 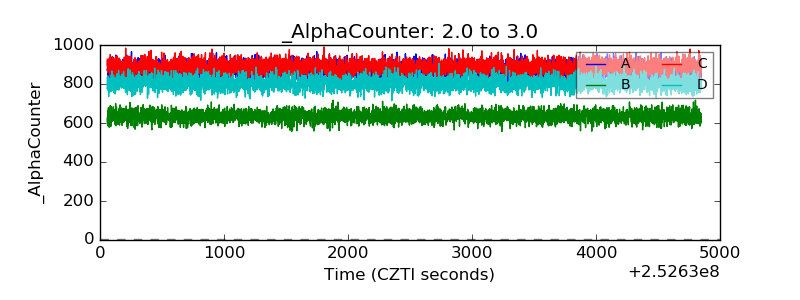 |
| _CPM_Rate | 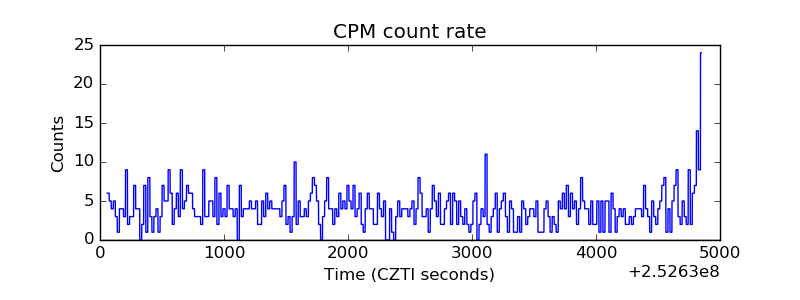 |
| CZT Counter | 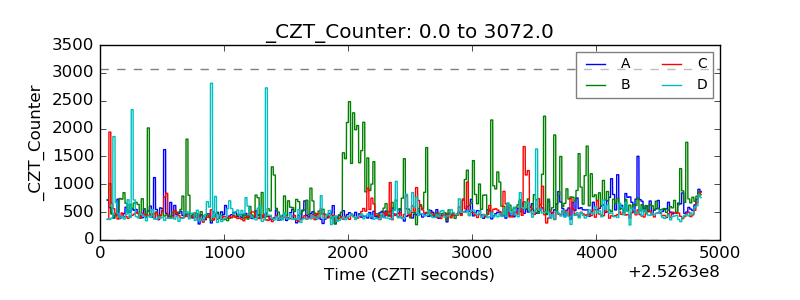 |
| +2.5 Volts monitor |  |
| +5 Volts monitor |  |
| _ROLL_ROT | 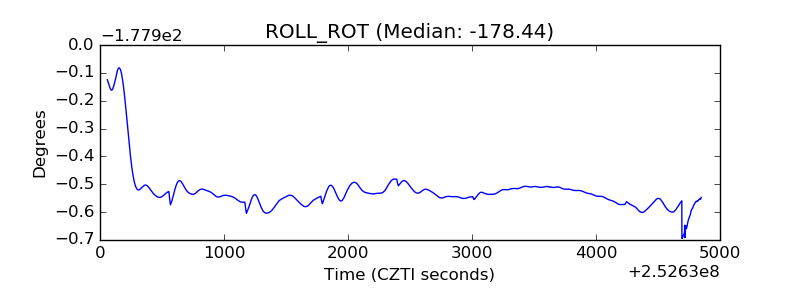 |
| _Roll_DEC | 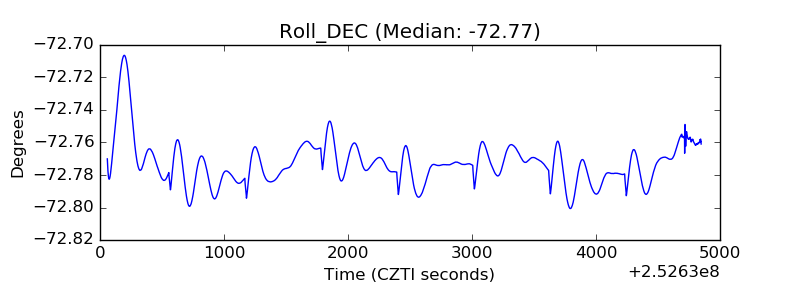 |
| _Roll_RA | 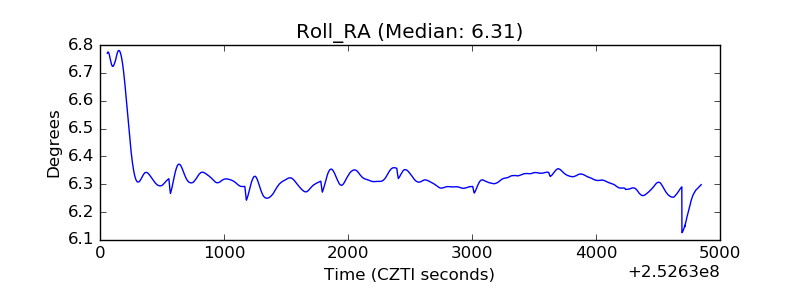 |
| Veto Counter | 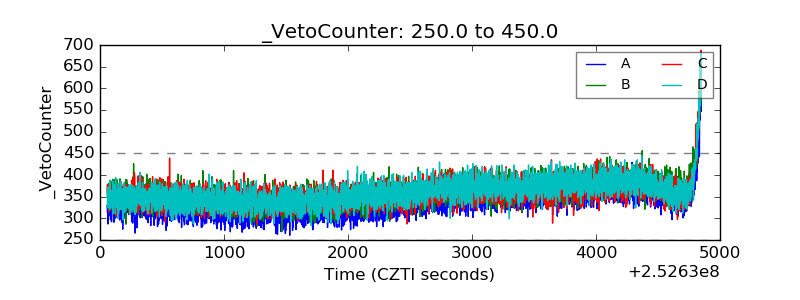 |