| Param | Original file | Final file |
|---|---|---|
| Filename | modeM0/AS1G08_006T04_9000001812_12254cztM0_level2.evt | modeM0/AS1G08_006T04_9000001812_12254cztM0_level2_quad_clean.evt |
| Size (bytes) | 579,107,520 | 129,242,880 |
| Size | 552.3 MB | 123.3 MB |
| Events in quadrant A | 3,812,476 | 872,938 |
| Events in quadrant B | 5,866,248 | 862,501 |
| Events in quadrant C | 3,911,066 | 855,504 |
| Events in quadrant D | 3,470,063 | 831,549 |
| Mode M9 | |||
|---|---|---|---|
| Quadrant | BADHDUFLAG | Total packets | Discarded packets |
| A | 0 | 17 | 0 |
| B | 0 | 17 | 0 |
| C | 0 | 17 | 0 |
| D | 0 | 17 | 0 |
| Mode M0 | |||
|---|---|---|---|
| Quadrant | BADHDUFLAG | Total packets | Discarded packets |
| A | 0 | 15839 | 3 |
| B | 0 | 22358 | 2 |
| C | 0 | 16414 | 2 |
| D | 0 | 15249 | 2 |
| Mode SS | |||
|---|---|---|---|
| Quadrant | BADHDUFLAG | Total packets | Discarded packets |
| A | 0 | 144 | 0 |
| B | 0 | 144 | 0 |
| C | 0 | 144 | 0 |
| D | 0 | 144 | 0 |
| Quadrant | Total seconds | Saturated seconds | Saturation percentage |
|---|---|---|---|
| A | 7067 | 109 | 1.542380% |
| B | 7067 | 316 | 4.471487% |
| C | 7067 | 163 | 2.306495% |
| D | 7067 | 76 | 1.075421% |
Noise dominated data is calculated using 1-second bins in cleaned event files. If a bin has >2000 counts, and if more than 50% of those come from <1% of pixels, then it is considered to be noise-dominated and hence unusable.
| Quadrant | # 1 sec bins | Bins with >0 counts | Bins with >2000 counts | High rate bins dominated by noise | Noise dominated (total time) | Noise dominated (detector-on time) | Marked lightcurve |
|---|---|---|---|---|---|---|---|
| A | 8743 | 7070 | 16 | 16 | 0.18% | 0.23% | 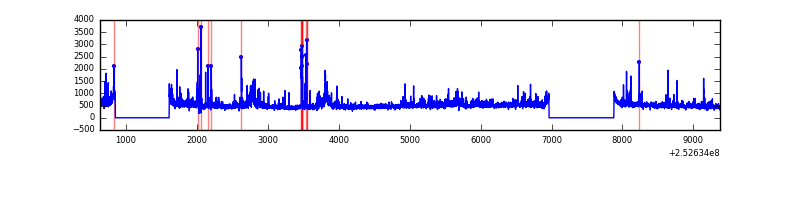 |
| B | 8743 | 7070 | 136 | 136 | 1.56% | 1.92% | 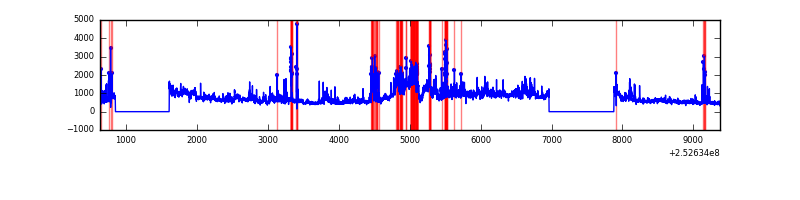 |
| C | 8743 | 7070 | 100 | 100 | 1.14% | 1.41% | 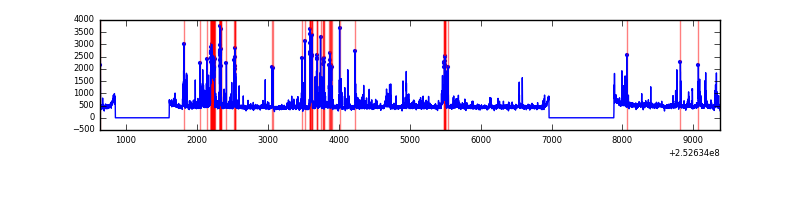 |
| D | 8743 | 7070 | 33 | 33 | 0.38% | 0.47% | 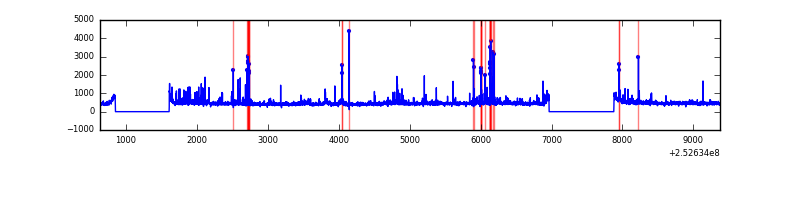 |
Top three noisy pixels from each quadrant. If the there are fewer than three noisy pixels in the level2.evt file, extra rows are filled as -1
| Pixel properties | Quadrant properties | ||||||
|---|---|---|---|---|---|---|---|
| Quadrant | DetID | PixID | Counts | Sigma | Mean | Median | Sigma |
| A | 5 | 16 | 166971 | 988.12 | 829 | 809 | 168.2 |
| A | 1 | 162 | 110154 | 650.25 | 829 | 809 | 168.2 |
| A | 1 | 178 | 66430 | 390.23 | 829 | 809 | 168.2 |
| B | 4 | 206 | 1745196 | 11291.4 | 820 | 800 | 154.5 |
| B | 4 | 239 | 587566 | 3798.11 | 820 | 800 | 154.5 |
| B | 11 | 51 | 114339 | 734.93 | 820 | 800 | 154.5 |
| C | 15 | 208 | 758649 | 4138.14 | 798 | 803 | 183.1 |
| C | 4 | 175 | 18100 | 94.45 | 798 | 803 | 183.1 |
| C | 1 | 16 | 11214 | 56.85 | 798 | 803 | 183.1 |
| D | 12 | 221 | 132405 | 678.31 | 800 | 774 | 194.1 |
| D | 1 | 52 | 95848 | 489.93 | 800 | 774 | 194.1 |
| D | 13 | 104 | 52473 | 266.41 | 800 | 774 | 194.1 |
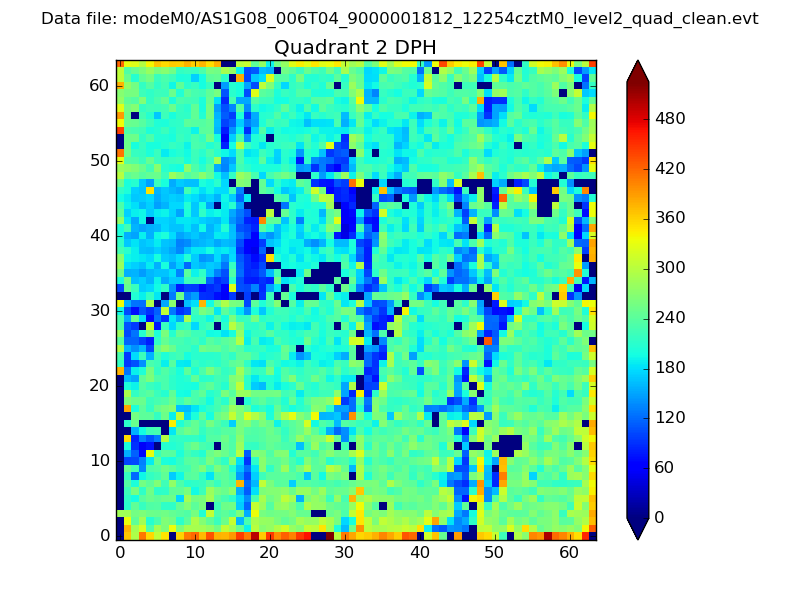
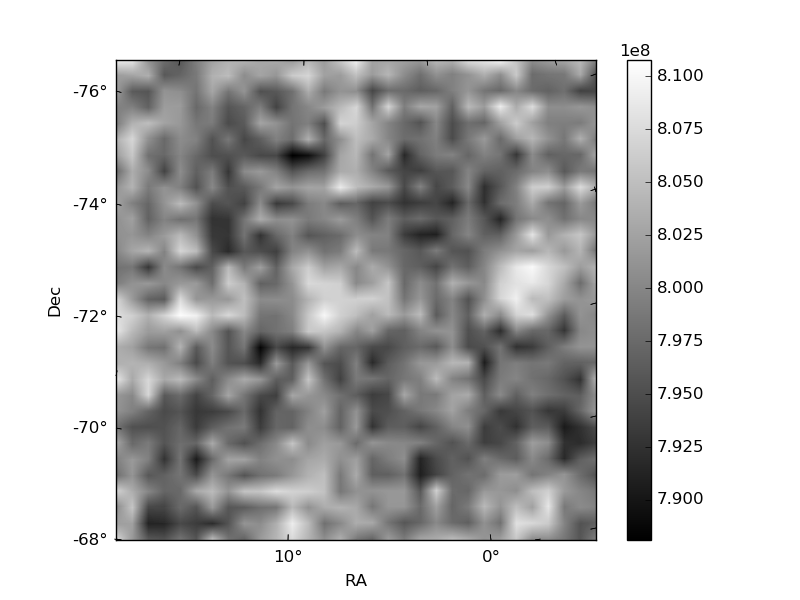
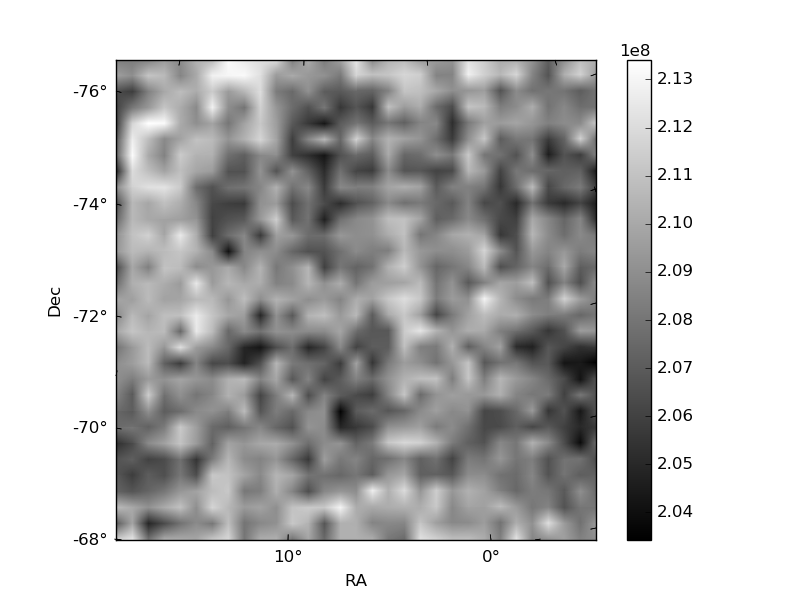
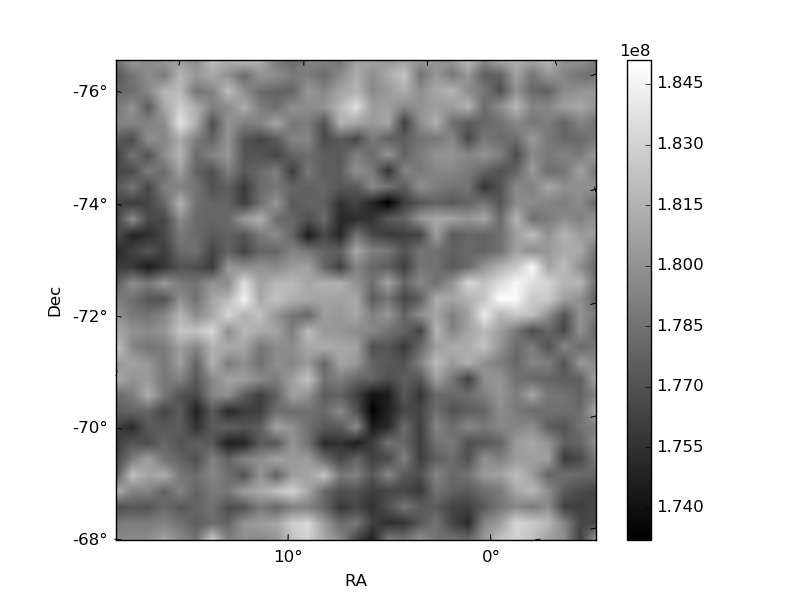
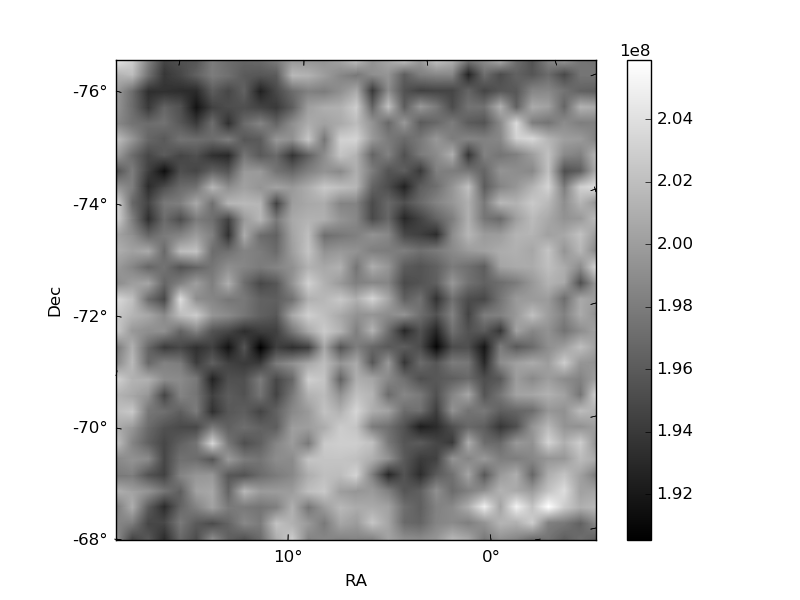
Histogram calculated using DETX and DETY for each event in the final _common_clean file
| Quadrant A | 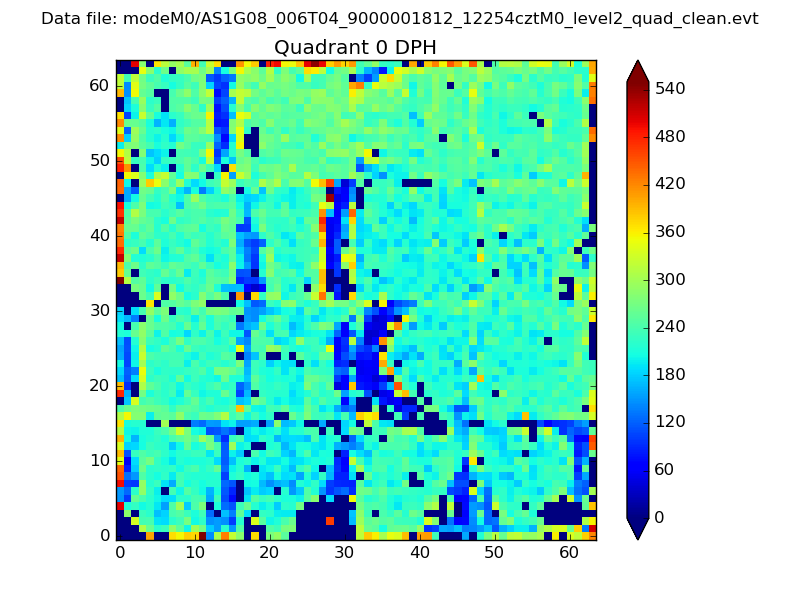 |
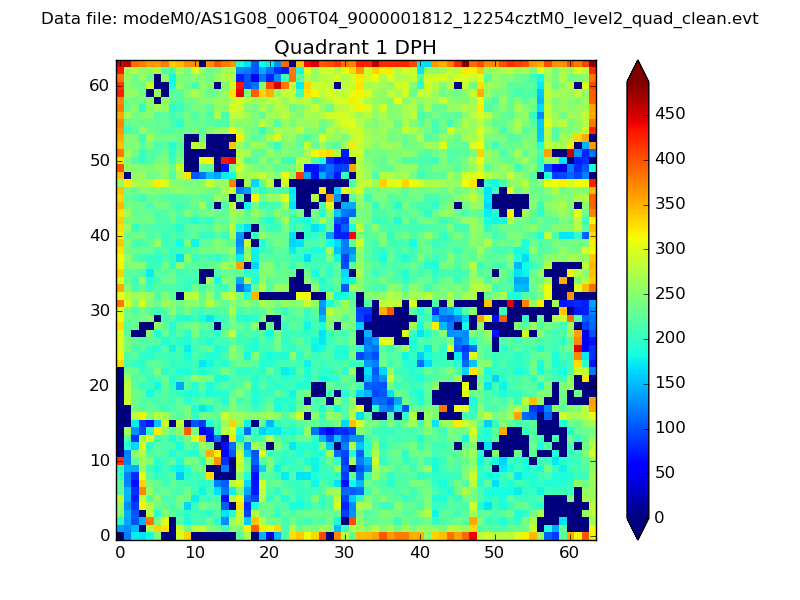 |
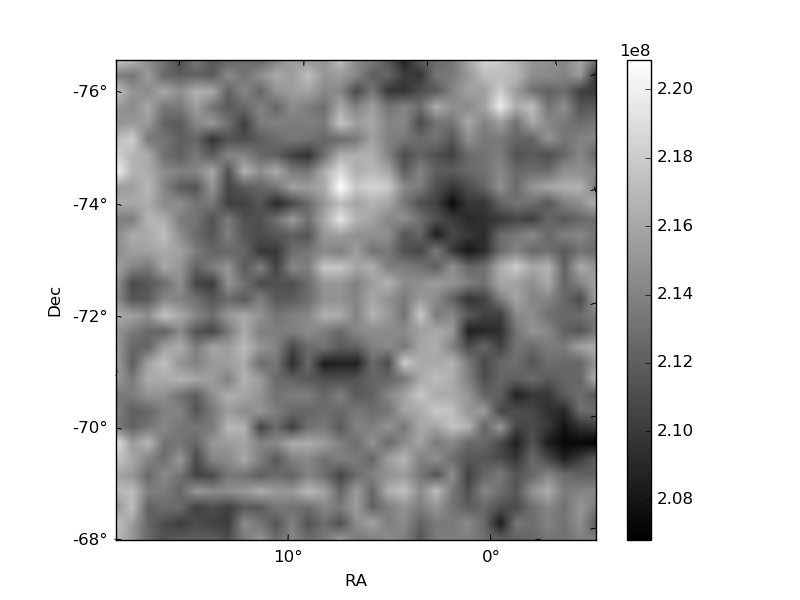
Quadrant B |
|---|---|---|---|
| Quadrant D | 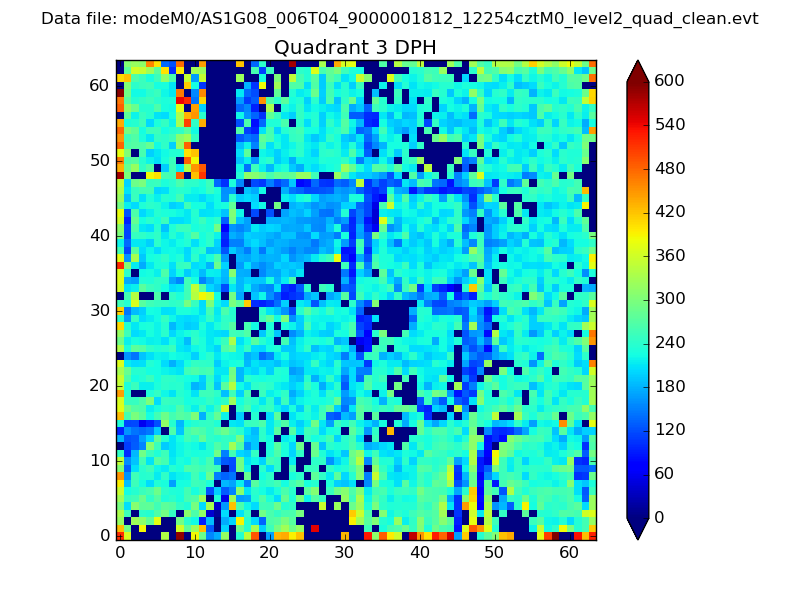 |
 |
Quadrant C |
| Plot type | Count rate plots | Images |
|---|---|---|
| Comparison with Poisson distribution Blue bars denote a histogram of data divided into 1 sec bins. Red curve is a Poisson curve with rate = median count rate of data. |
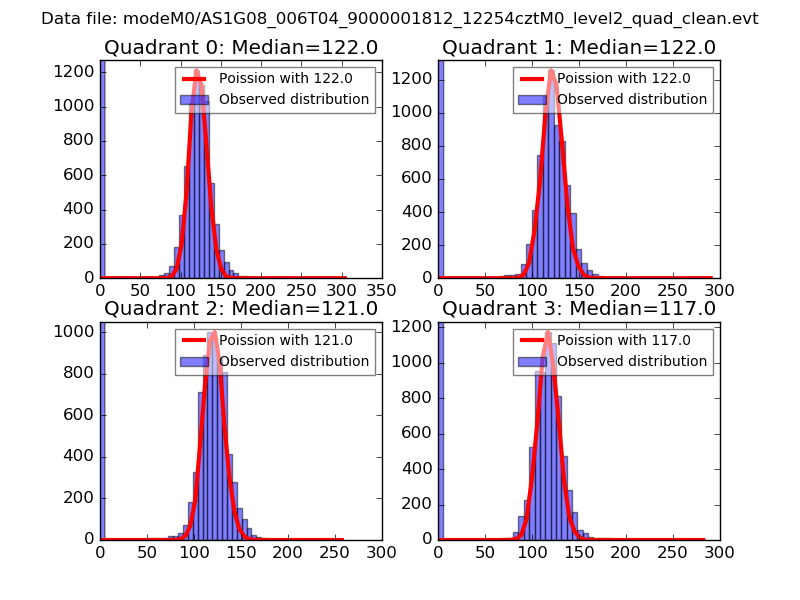 |
 |
| Quadrant-wise count rates Data is divided into 100 sec bins |
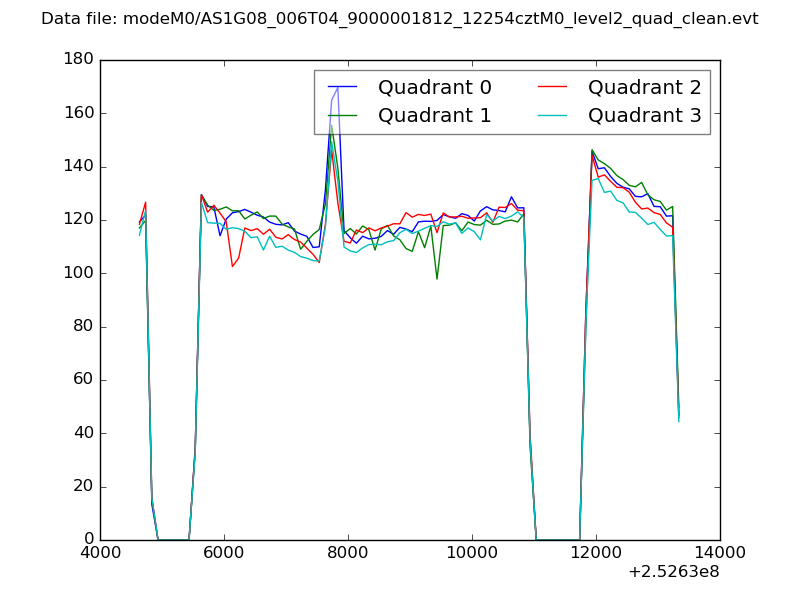 |
|
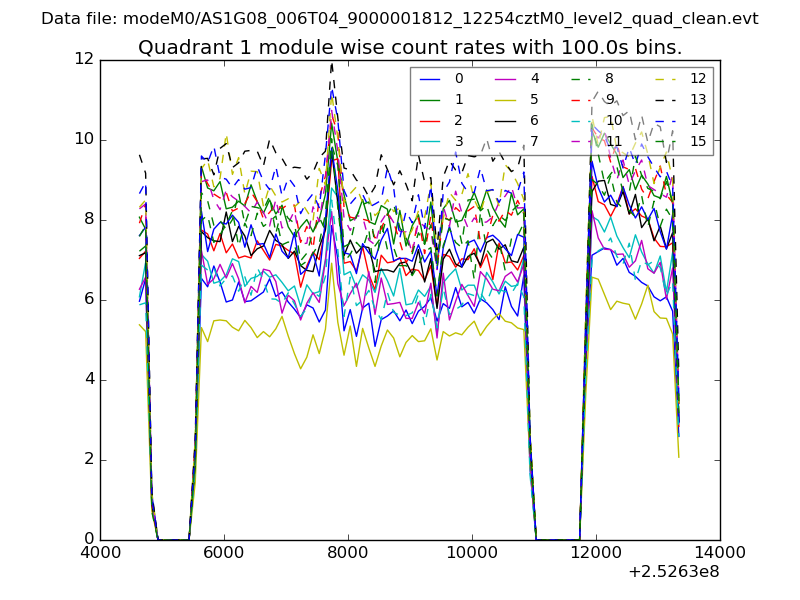
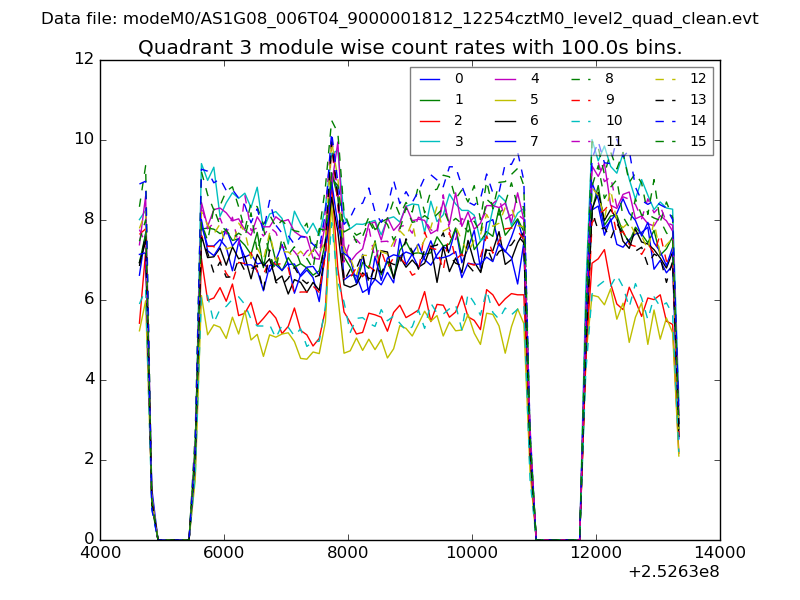
| Module-wise count rates for Quadrant A Data is divided into 100 sec bins |
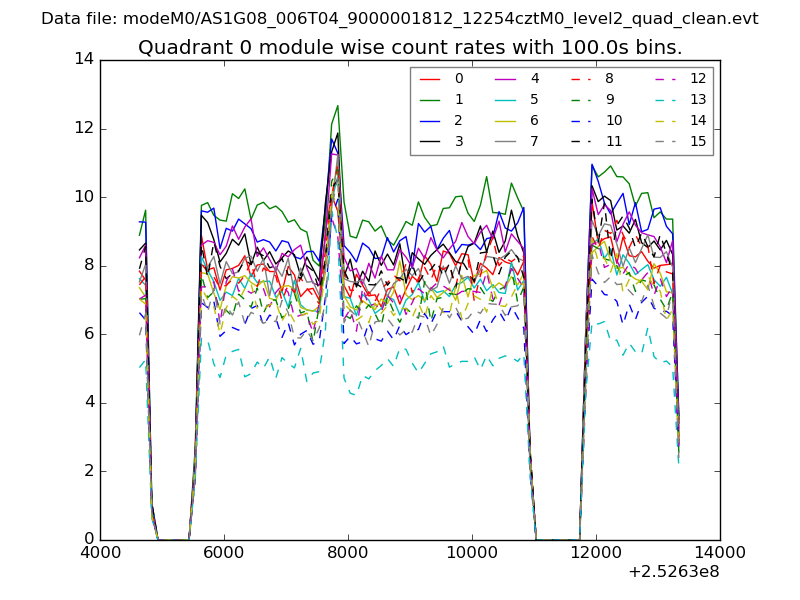 |
 |
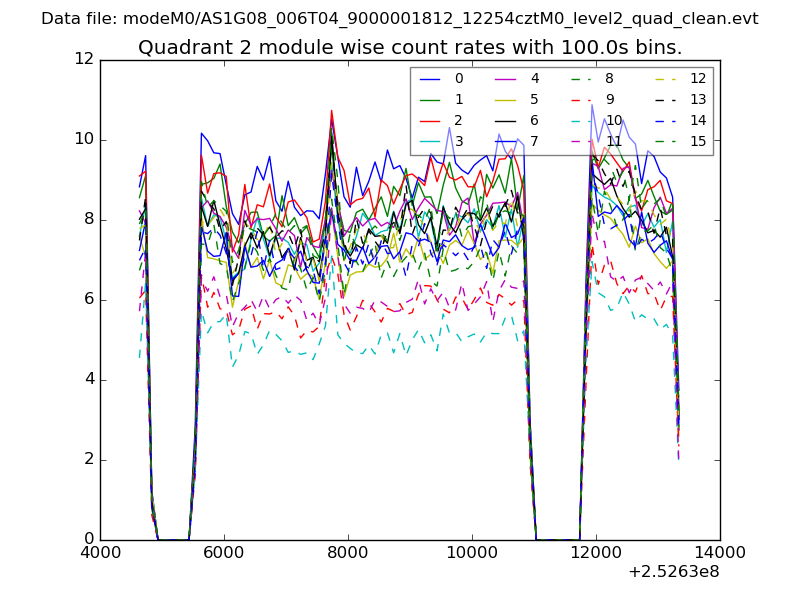
| Module-wise count rates for Quadrant B Data is divided into 100 sec bins |
 |
 |
| Module-wise count rates for Quadrant C Data is divided into 100 sec bins |
 |
 |
| Module-wise count rates for Quadrant D Data is divided into 100 sec bins |
 |
 |
| Parameter | Plot |
|---|---|
| CZT HV Monitor | 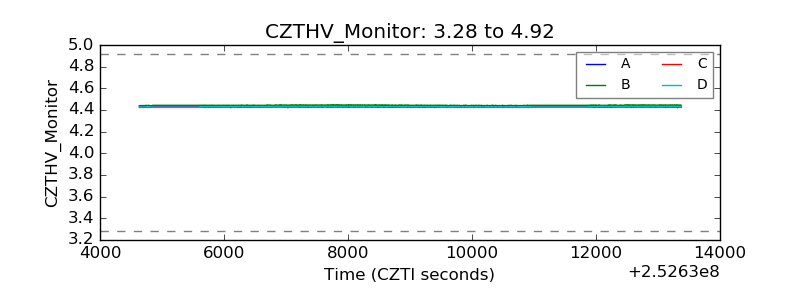 |
| D_VDD | 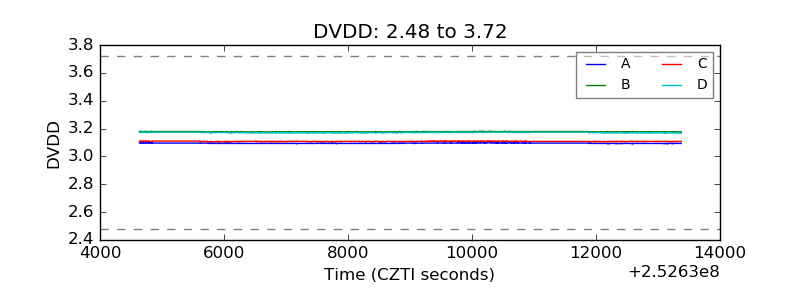 |
| Temperature 1 | 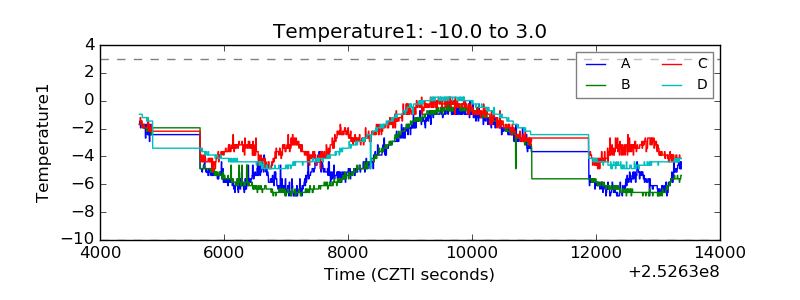 |
| Veto HV Monitor |  |
| Veto LLD | 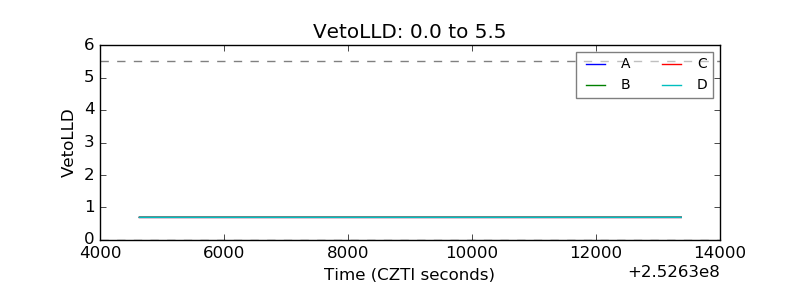 |
| Alpha Counter | 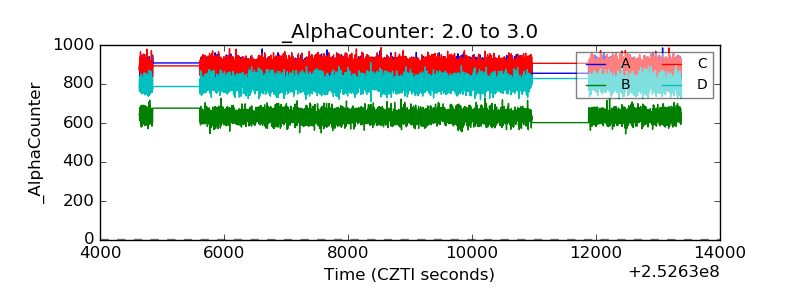 |
| _CPM_Rate | 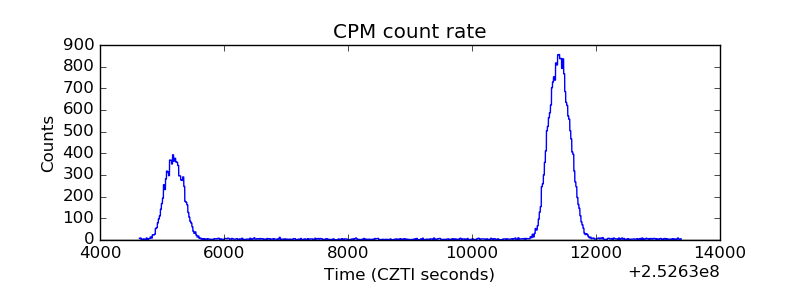 |
| CZT Counter | 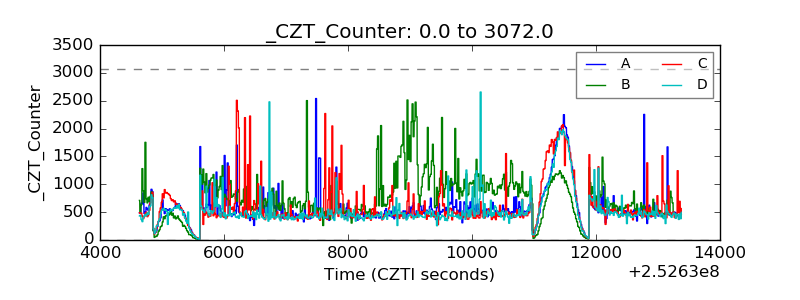 |
| +2.5 Volts monitor |  |
| +5 Volts monitor |  |
| _ROLL_ROT | 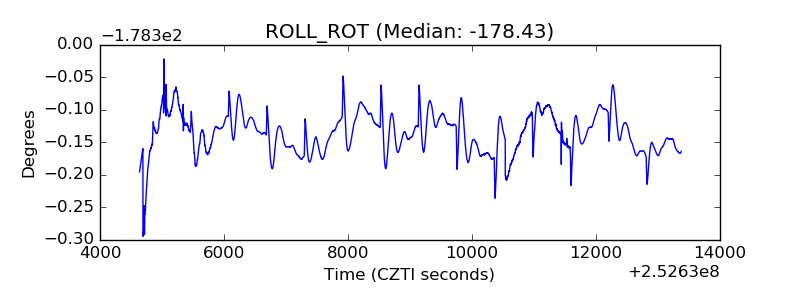 |
| _Roll_DEC | 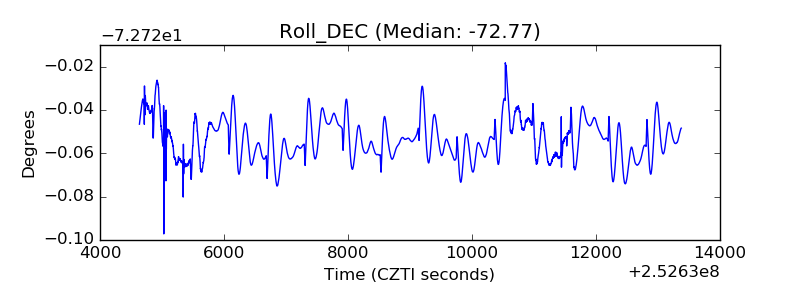 |
| _Roll_RA | 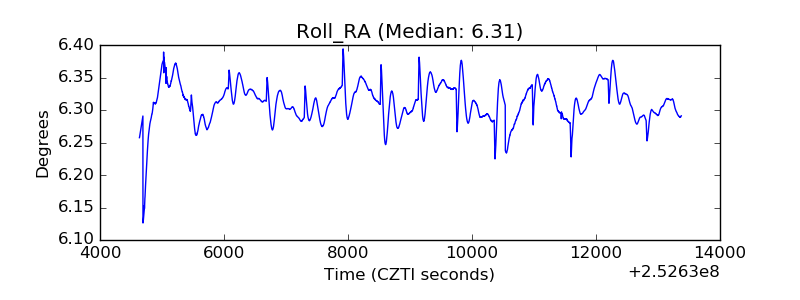 |
| Veto Counter | 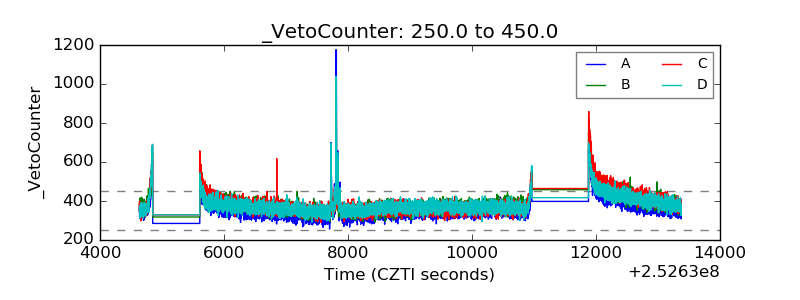 |