| Param | Original file | Final file |
|---|---|---|
| Filename | modeM0/AS1G08_006T04_9000001812_12259cztM0_level2.evt | modeM0/AS1G08_006T04_9000001812_12259cztM0_level2_quad_clean.evt |
| Size (bytes) | 560,545,920 | 127,451,520 |
| Size | 534.6 MB | 121.5 MB |
| Events in quadrant A | 4,154,227 | 871,557 |
| Events in quadrant B | 4,187,643 | 877,496 |
| Events in quadrant C | 4,203,361 | 862,734 |
| Events in quadrant D | 4,024,894 | 829,199 |
| Mode M9 | |||
|---|---|---|---|
| Quadrant | BADHDUFLAG | Total packets | Discarded packets |
| A | 0 | 13 | 0 |
| B | 0 | 13 | 0 |
| C | 0 | 13 | 0 |
| D | 0 | 13 | 0 |
| Mode M0 | |||
|---|---|---|---|
| Quadrant | BADHDUFLAG | Total packets | Discarded packets |
| A | 0 | 16395 | 2 |
| B | 0 | 16369 | 1 |
| C | 0 | 16450 | 1 |
| D | 0 | 16013 | 1 |
| Mode SS | |||
|---|---|---|---|
| Quadrant | BADHDUFLAG | Total packets | Discarded packets |
| A | 0 | 122 | 0 |
| B | 0 | 122 | 0 |
| C | 0 | 122 | 0 |
| D | 0 | 122 | 0 |
| Quadrant | Total seconds | Saturated seconds | Saturation percentage |
|---|---|---|---|
| A | 5999 | 260 | 4.334056% |
| B | 5999 | 322 | 5.367561% |
| C | 5999 | 239 | 3.983997% |
| D | 5999 | 249 | 4.150692% |
Noise dominated data is calculated using 1-second bins in cleaned event files. If a bin has >2000 counts, and if more than 50% of those come from <1% of pixels, then it is considered to be noise-dominated and hence unusable.
| Quadrant | # 1 sec bins | Bins with >0 counts | Bins with >2000 counts | High rate bins dominated by noise | Noise dominated (total time) | Noise dominated (detector-on time) | Marked lightcurve |
|---|---|---|---|---|---|---|---|
| A | 7285 | 6001 | 110 | 110 | 1.51% | 1.83% | 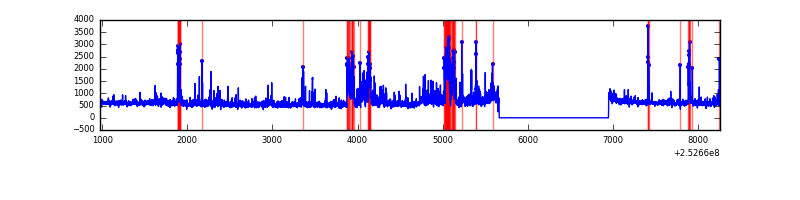 |
| B | 7285 | 6001 | 138 | 138 | 1.89% | 2.30% | 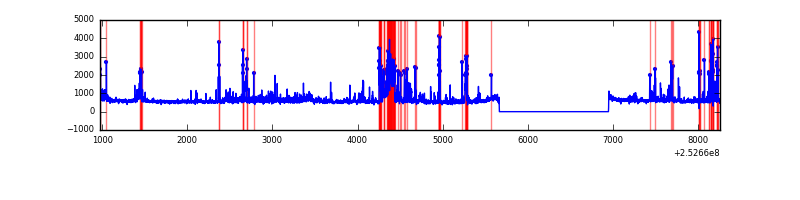 |
| C | 7285 | 6001 | 125 | 125 | 1.72% | 2.08% | 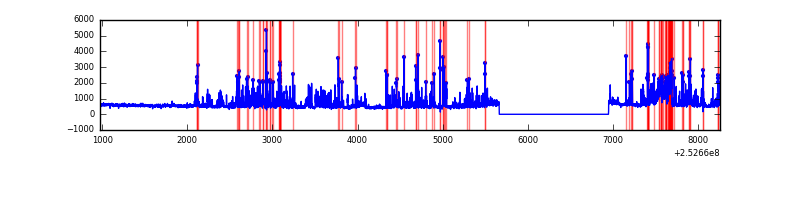 |
| D | 7285 | 6001 | 129 | 129 | 1.77% | 2.15% | 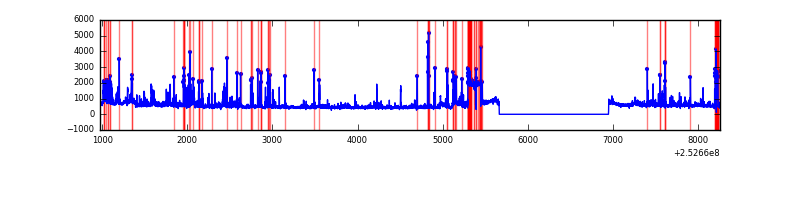 |
Top three noisy pixels from each quadrant. If the there are fewer than three noisy pixels in the level2.evt file, extra rows are filled as -1
| Pixel properties | Quadrant properties | ||||||
|---|---|---|---|---|---|---|---|
| Quadrant | DetID | PixID | Counts | Sigma | Mean | Median | Sigma |
| A | 14 | 237 | 310403 | 2025.47 | 770 | 756 | 152.9 |
| A | 5 | 16 | 263906 | 1721.32 | 770 | 756 | 152.9 |
| A | 13 | 251 | 174392 | 1135.79 | 770 | 756 | 152.9 |
| B | 4 | 239 | 714424 | 5094.84 | 763 | 748 | 140.1 |
| B | 4 | 206 | 233047 | 1658.35 | 763 | 748 | 140.1 |
| B | 11 | 51 | 137014 | 972.79 | 763 | 748 | 140.1 |
| C | 15 | 208 | 1253365 | 7429.3 | 742 | 749 | 168.6 |
| C | 4 | 175 | 24221 | 139.21 | 742 | 749 | 168.6 |
| C | 3 | 233 | 13083 | 73.15 | 742 | 749 | 168.6 |
| D | 1 | 52 | 847197 | 4768.99 | 747 | 727 | 177.5 |
| D | 10 | 199 | 117974 | 660.57 | 747 | 727 | 177.5 |
| D | 13 | 104 | 72751 | 405.78 | 747 | 727 | 177.5 |
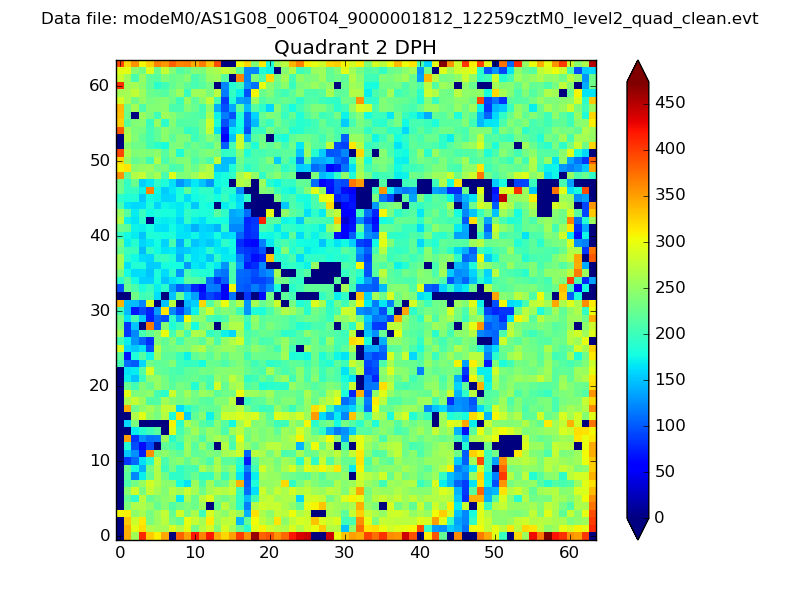
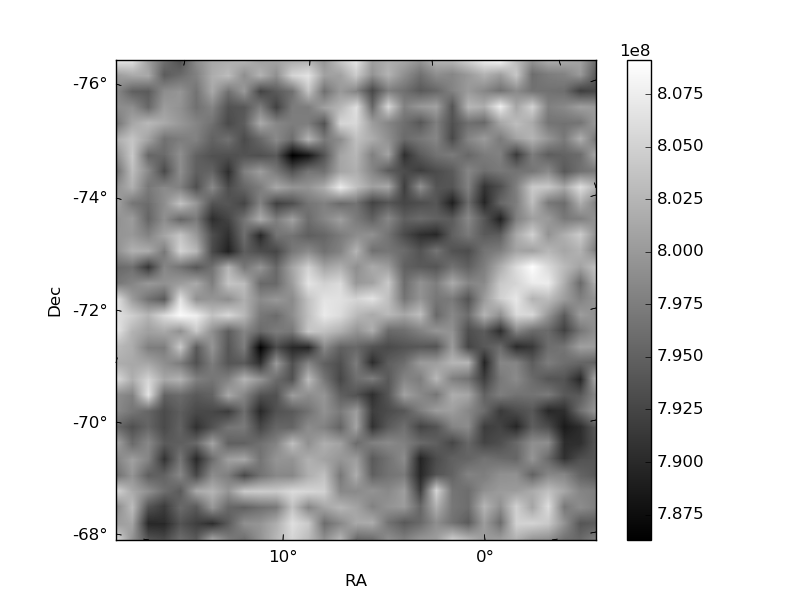
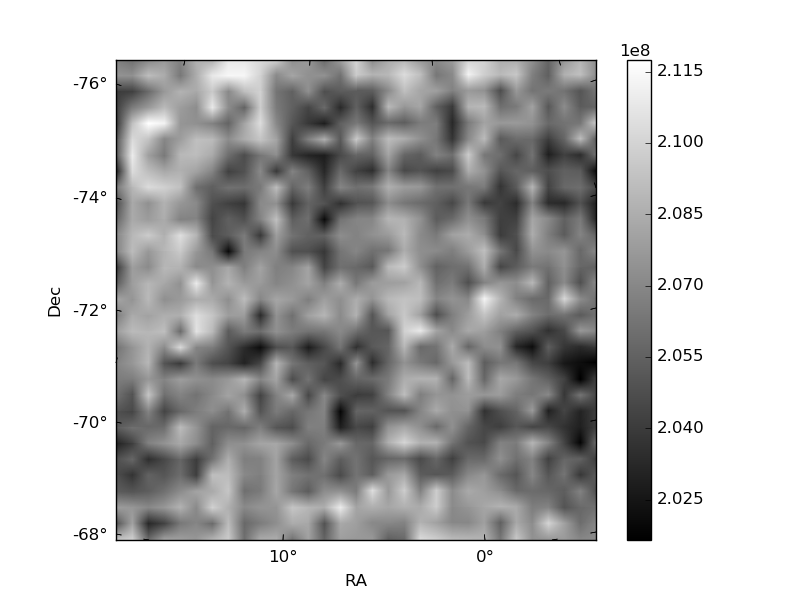
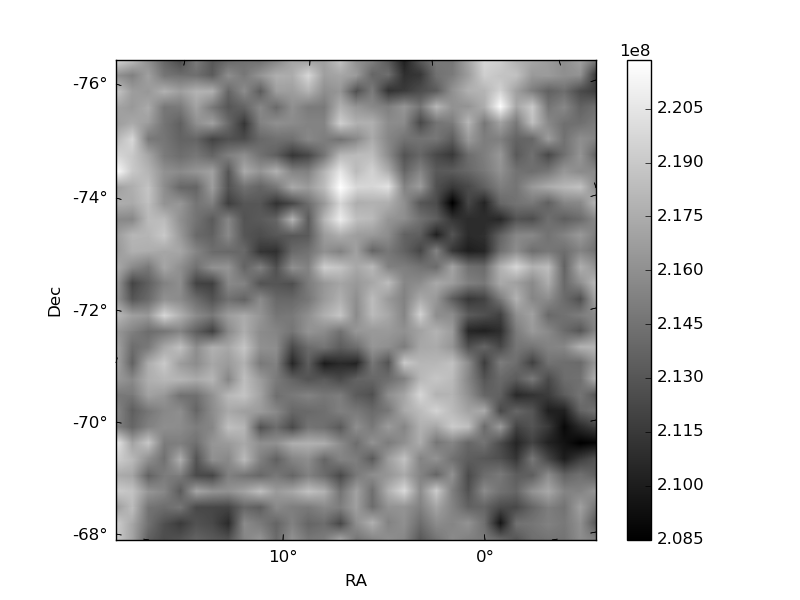
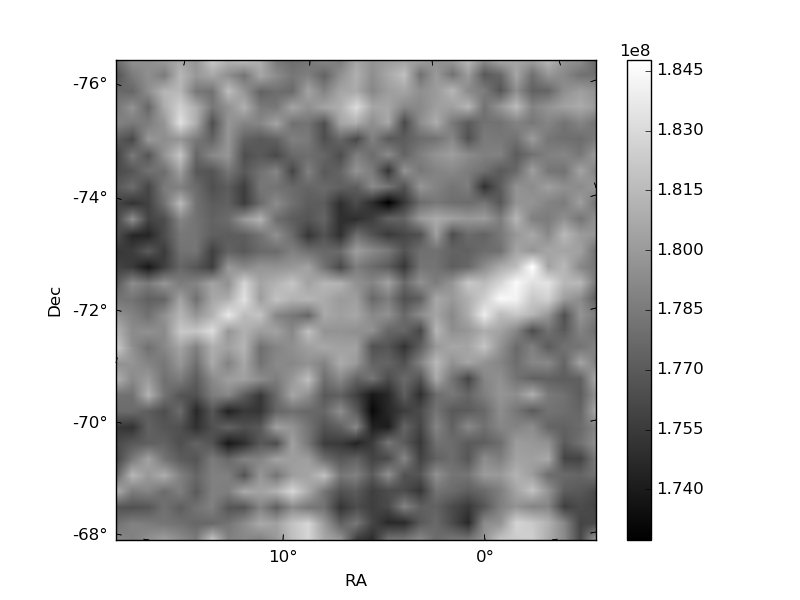
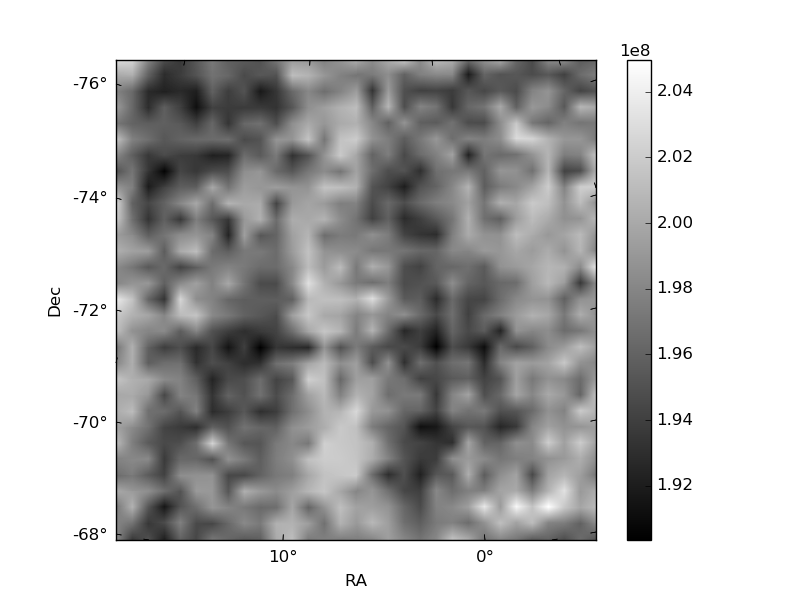
Histogram calculated using DETX and DETY for each event in the final _common_clean file
| Quadrant A | 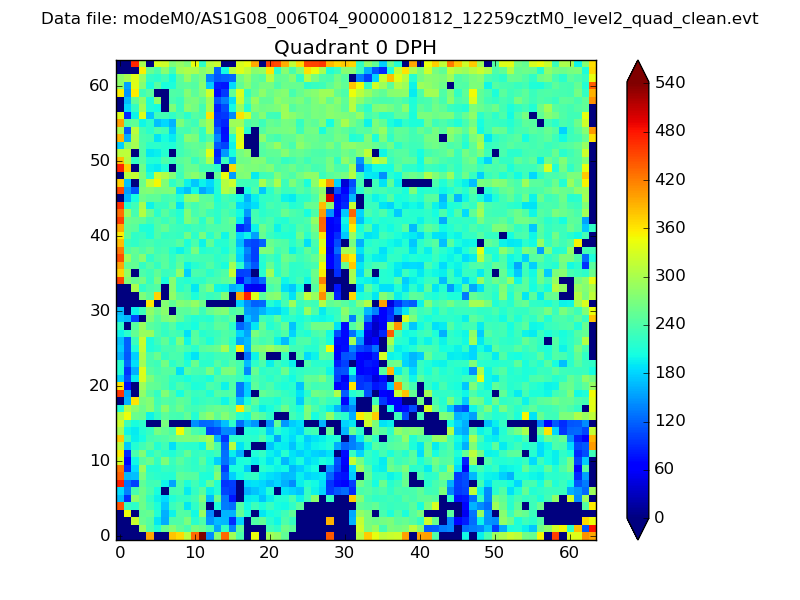 |
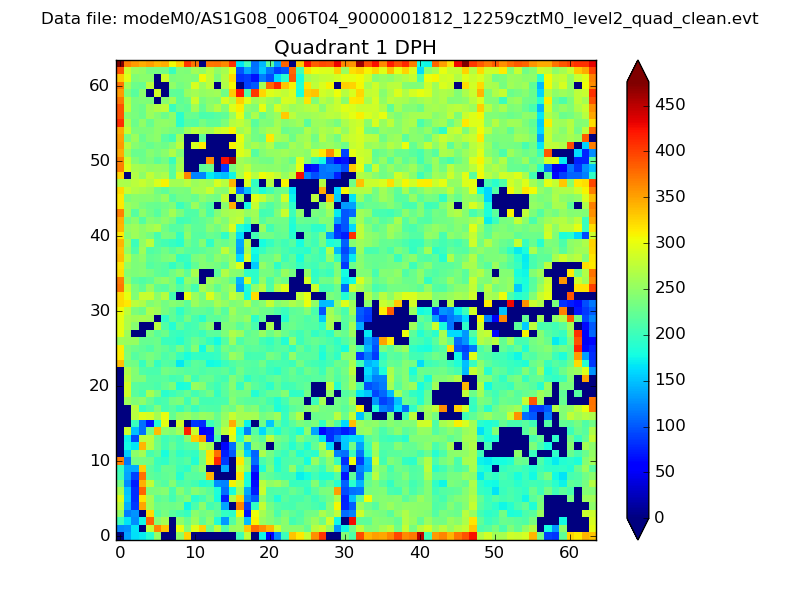 |
Quadrant B |
|---|---|---|---|
| Quadrant D | 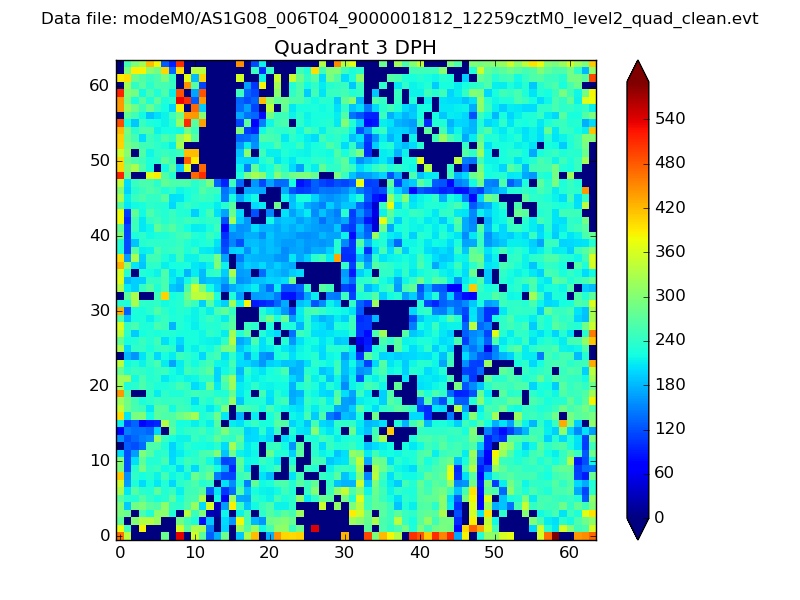 |
 |
Quadrant C |
| Plot type | Count rate plots | Images |
|---|---|---|
| Comparison with Poisson distribution Blue bars denote a histogram of data divided into 1 sec bins. Red curve is a Poisson curve with rate = median count rate of data. |
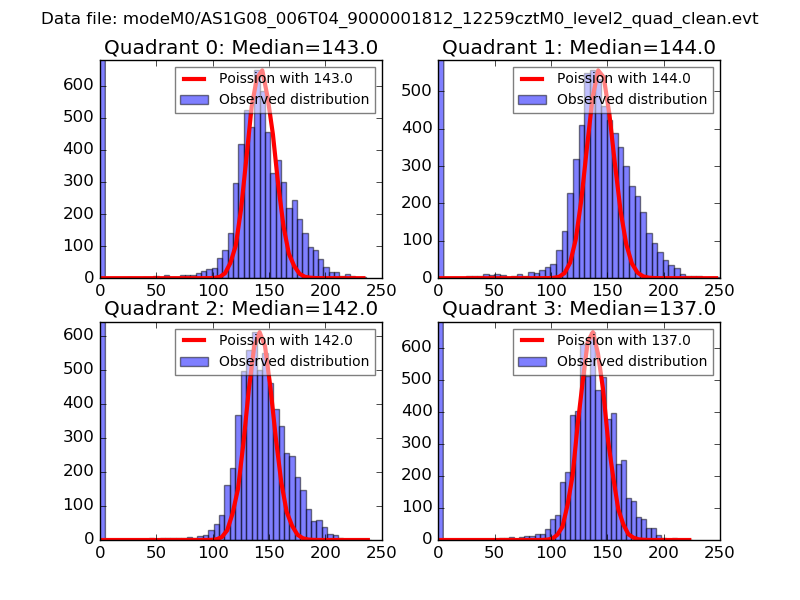 |
 |
| Quadrant-wise count rates Data is divided into 100 sec bins |
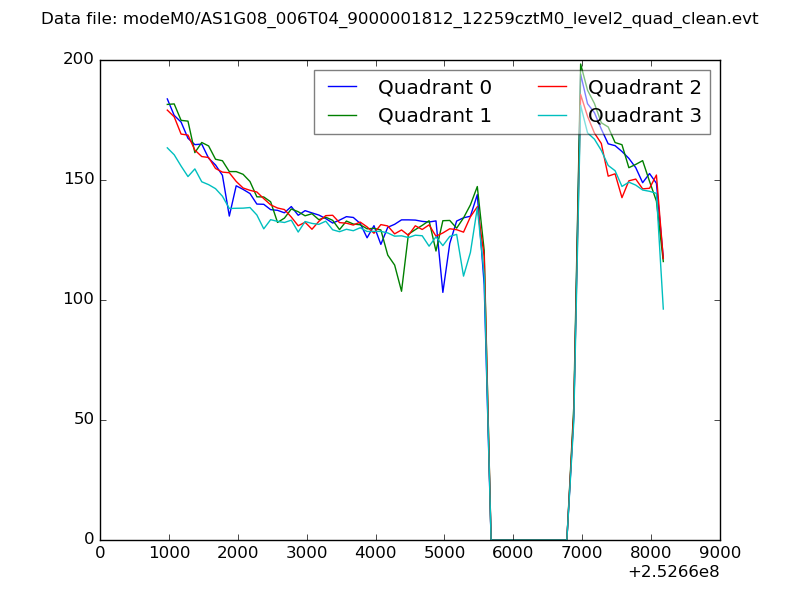 |
|
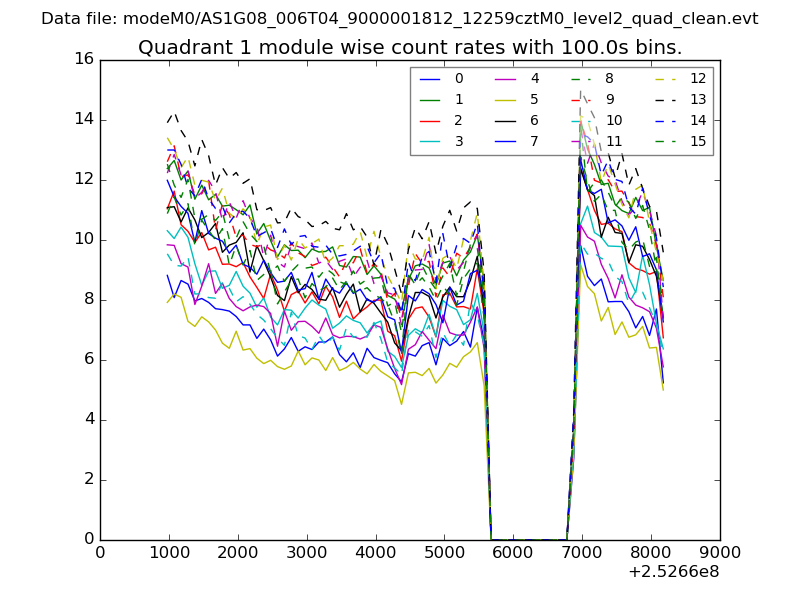
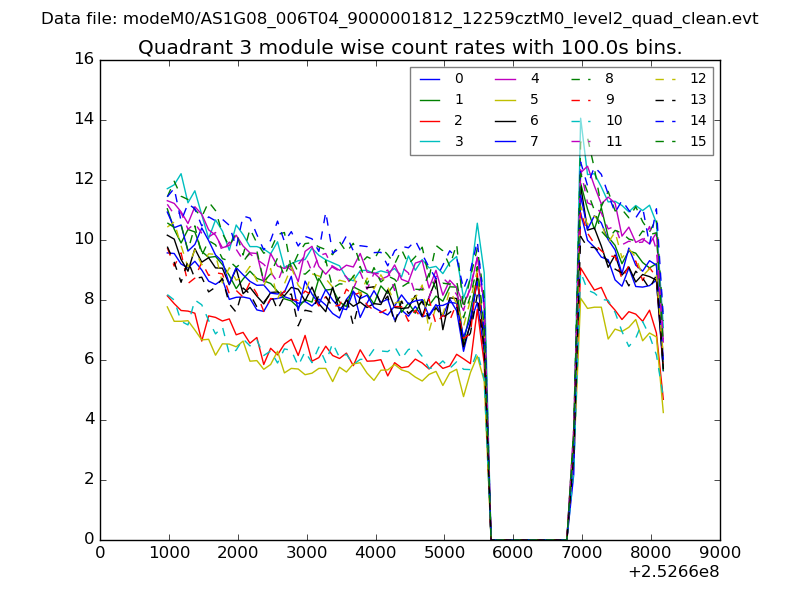
| Module-wise count rates for Quadrant A Data is divided into 100 sec bins |
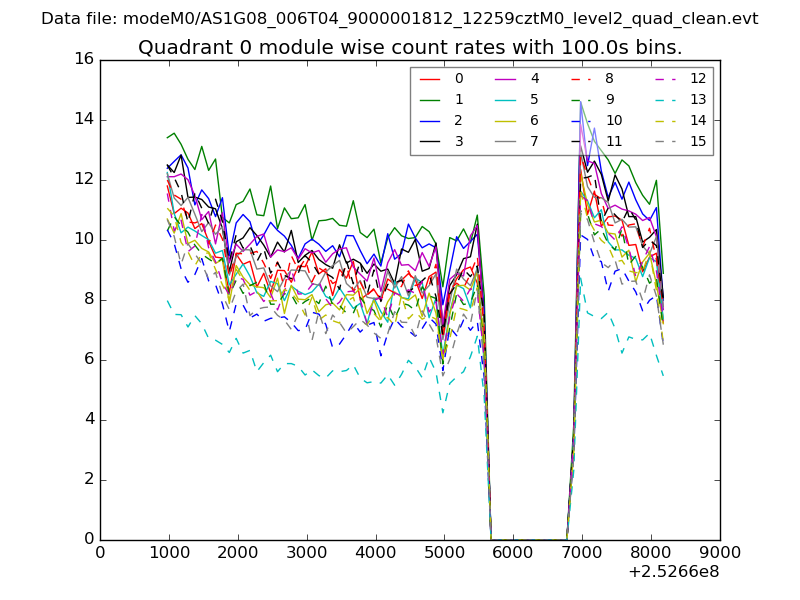 |
 |
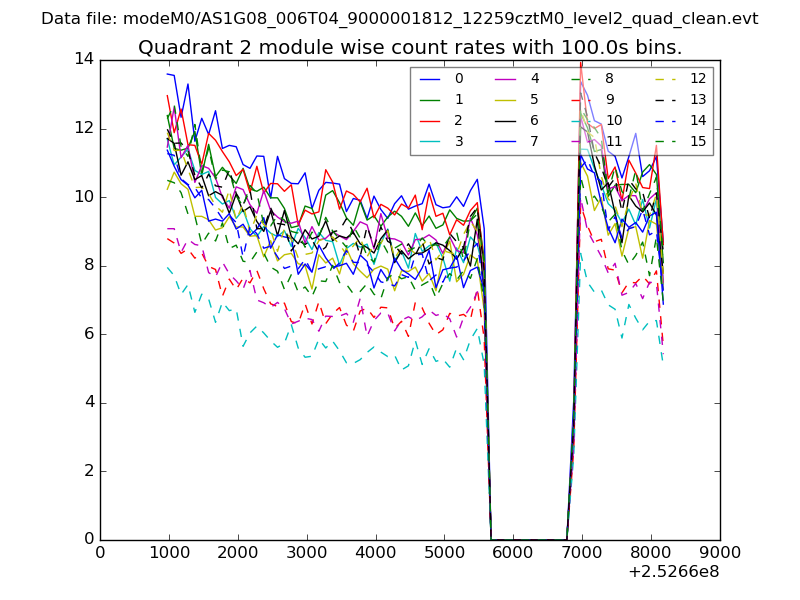
| Module-wise count rates for Quadrant B Data is divided into 100 sec bins |
 |
 |
| Module-wise count rates for Quadrant C Data is divided into 100 sec bins |
 |
 |
| Module-wise count rates for Quadrant D Data is divided into 100 sec bins |
 |
 |
| Parameter | Plot |
|---|---|
| CZT HV Monitor | 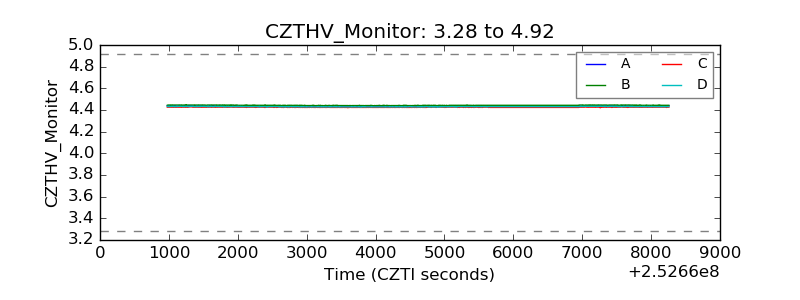 |
| D_VDD | 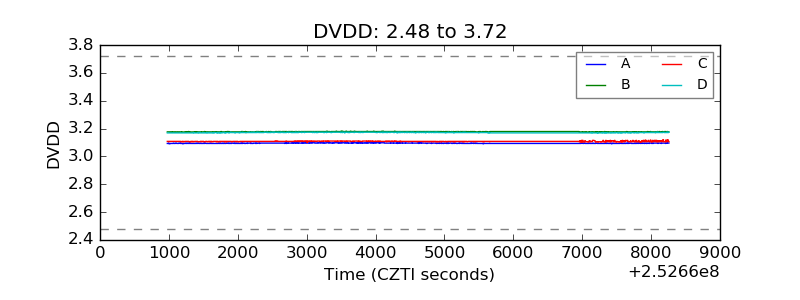 |
| Temperature 1 | 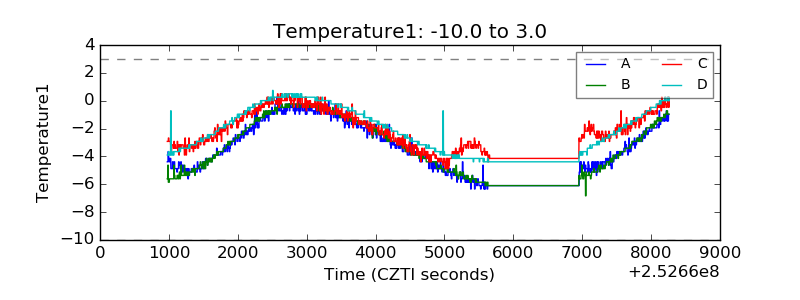 |
| Veto HV Monitor | 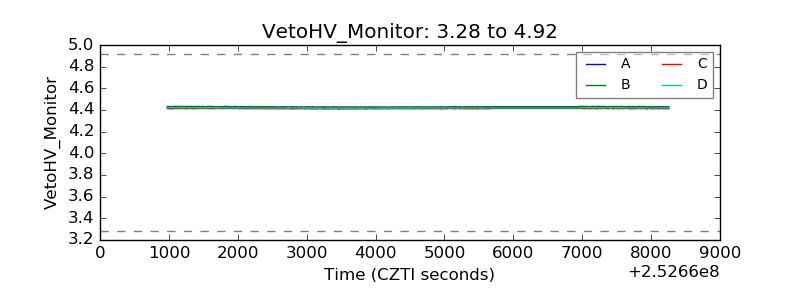 |
| Veto LLD | 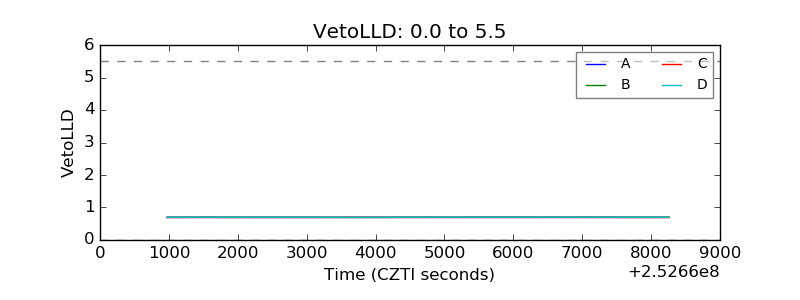 |
| Alpha Counter | 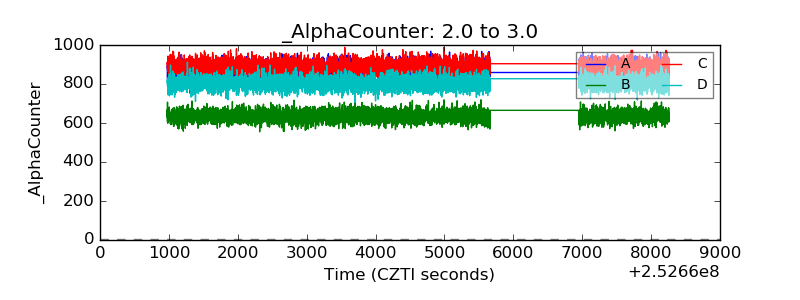 |
| _CPM_Rate | 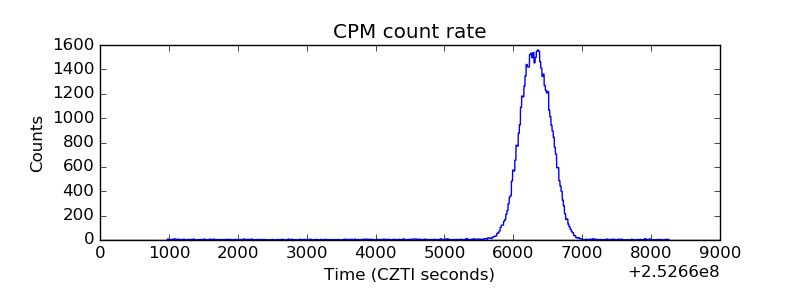 |
| CZT Counter | 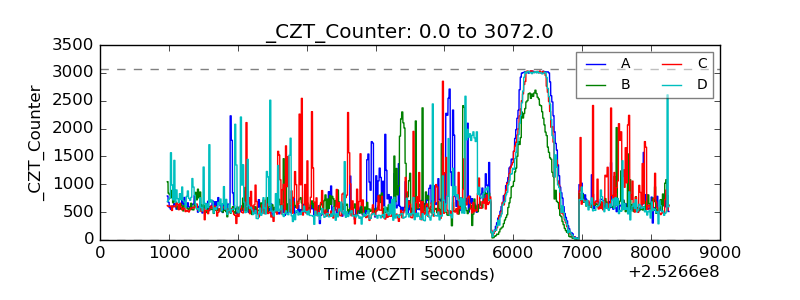 |
| +2.5 Volts monitor |  |
| +5 Volts monitor |  |
| _ROLL_ROT | 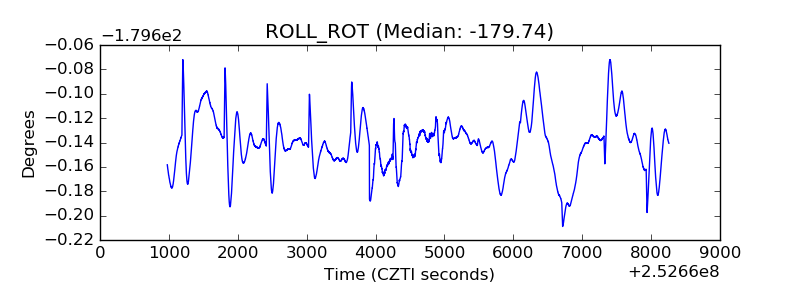 |
| _Roll_DEC | 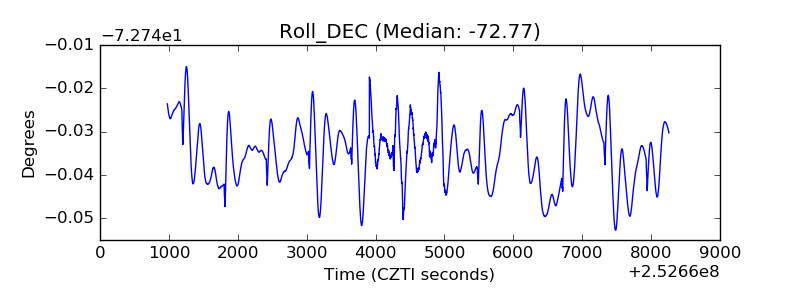 |
| _Roll_RA | 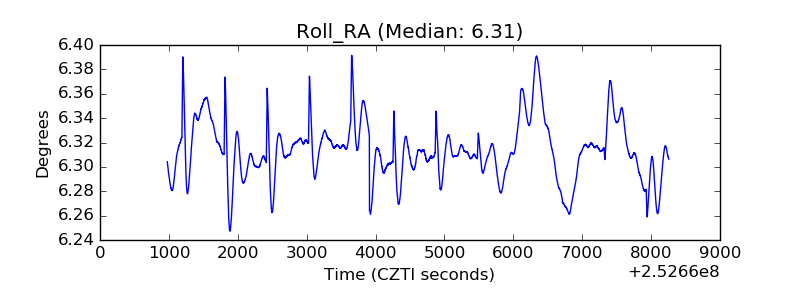 |
| Veto Counter | 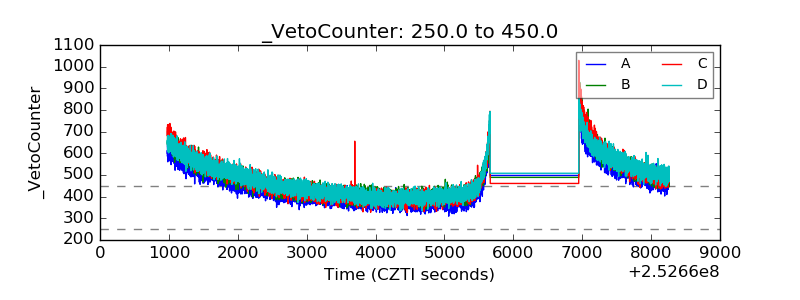 |