| Param | Original file | Final file |
|---|---|---|
| Filename | modeM0/AS1G08_006T04_9000001812_12260cztM0_level2.evt | modeM0/AS1G08_006T04_9000001812_12260cztM0_level2_quad_clean.evt |
| Size (bytes) | 692,352,000 | 117,204,480 |
| Size | 660.3 MB | 111.8 MB |
| Events in quadrant A | 8,691,403 | 662,968 |
| Events in quadrant B | 4,483,221 | 835,879 |
| Events in quadrant C | 3,744,184 | 829,215 |
| Events in quadrant D | 3,643,501 | 801,440 |
| Mode M9 | |||
|---|---|---|---|
| Quadrant | BADHDUFLAG | Total packets | Discarded packets |
| A | 0 | 13 | 0 |
| B | 0 | 13 | 0 |
| C | 0 | 13 | 0 |
| D | 0 | 13 | 0 |
| Mode M0 | |||
|---|---|---|---|
| Quadrant | BADHDUFLAG | Total packets | Discarded packets |
| A | 0 | 30014 | 1 |
| B | 0 | 17253 | 0 |
| C | 0 | 15108 | 0 |
| D | 0 | 14798 | 0 |
| Mode SS | |||
|---|---|---|---|
| Quadrant | BADHDUFLAG | Total packets | Discarded packets |
| A | 0 | 120 | 0 |
| B | 0 | 120 | 0 |
| C | 0 | 120 | 0 |
| D | 0 | 120 | 0 |
| Quadrant | Total seconds | Saturated seconds | Saturation percentage |
|---|---|---|---|
| A | 5997 | 2348 | 39.152910% |
| B | 5997 | 340 | 5.669501% |
| C | 5997 | 149 | 2.484576% |
| D | 5997 | 172 | 2.868101% |
Noise dominated data is calculated using 1-second bins in cleaned event files. If a bin has >2000 counts, and if more than 50% of those come from <1% of pixels, then it is considered to be noise-dominated and hence unusable.
| Quadrant | # 1 sec bins | Bins with >0 counts | Bins with >2000 counts | High rate bins dominated by noise | Noise dominated (total time) | Noise dominated (detector-on time) | Marked lightcurve |
|---|---|---|---|---|---|---|---|
| A | 7298 | 5999 | 1914 | 1914 | 26.23% | 31.91% | 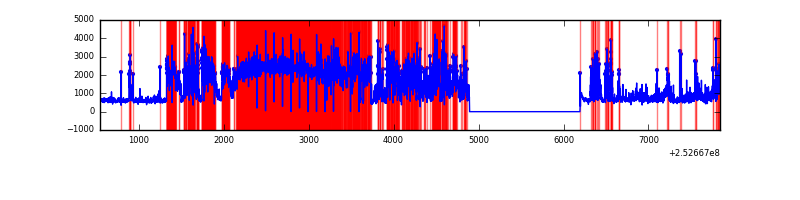 |
| B | 7298 | 5999 | 172 | 172 | 2.36% | 2.87% | 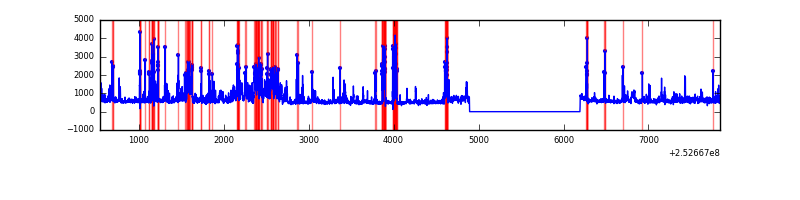 |
| C | 7298 | 5999 | 97 | 97 | 1.33% | 1.62% | 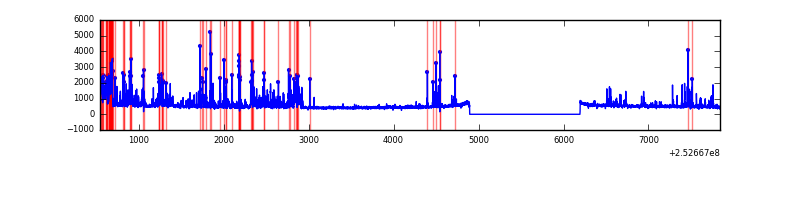 |
| D | 7298 | 5999 | 95 | 95 | 1.30% | 1.58% | 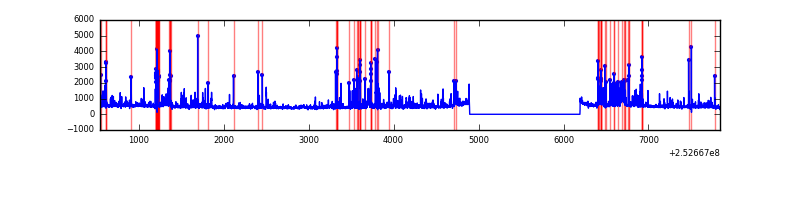 |
Top three noisy pixels from each quadrant. If the there are fewer than three noisy pixels in the level2.evt file, extra rows are filled as -1
| Pixel properties | Quadrant properties | ||||||
|---|---|---|---|---|---|---|---|
| Quadrant | DetID | PixID | Counts | Sigma | Mean | Median | Sigma |
| A | 14 | 237 | 4578753 | 36591.06 | 614 | 601 | 125.1 |
| A | 8 | 15 | 763139 | 6094.62 | 614 | 601 | 125.1 |
| A | 13 | 251 | 543768 | 4341.28 | 614 | 601 | 125.1 |
| B | 4 | 239 | 1068322 | 7939.28 | 733 | 718 | 134.5 |
| B | 4 | 206 | 160081 | 1185.11 | 733 | 718 | 134.5 |
| B | 11 | 51 | 136461 | 1009.46 | 733 | 718 | 134.5 |
| C | 15 | 208 | 909956 | 5625.28 | 711 | 714 | 161.6 |
| C | 4 | 175 | 28749 | 173.45 | 711 | 714 | 161.6 |
| C | 3 | 233 | 9827 | 56.38 | 711 | 714 | 161.6 |
| D | 1 | 52 | 440132 | 2559.08 | 719 | 700 | 171.7 |
| D | 10 | 199 | 153791 | 891.54 | 719 | 700 | 171.7 |
| D | 10 | 253 | 66845 | 385.2 | 719 | 700 | 171.7 |
Histogram calculated using DETX and DETY for each event in the final _common_clean file
| Quadrant A | 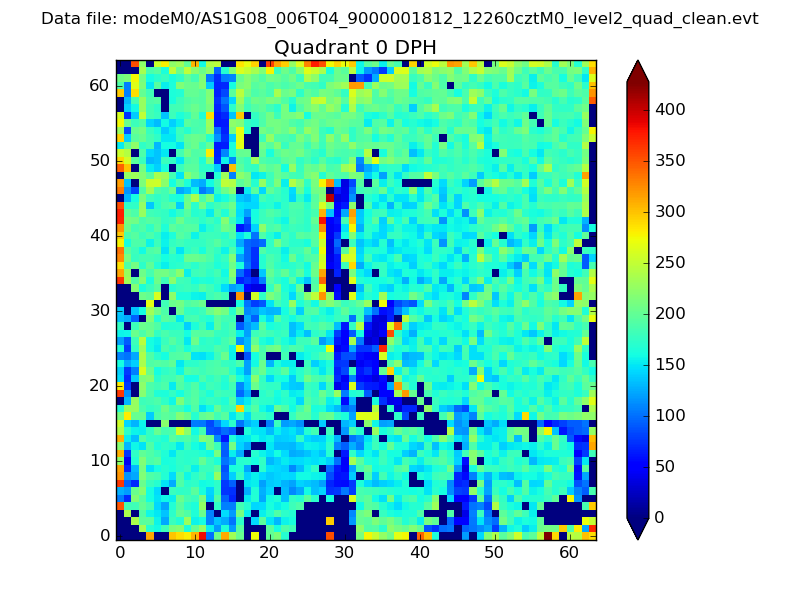 |
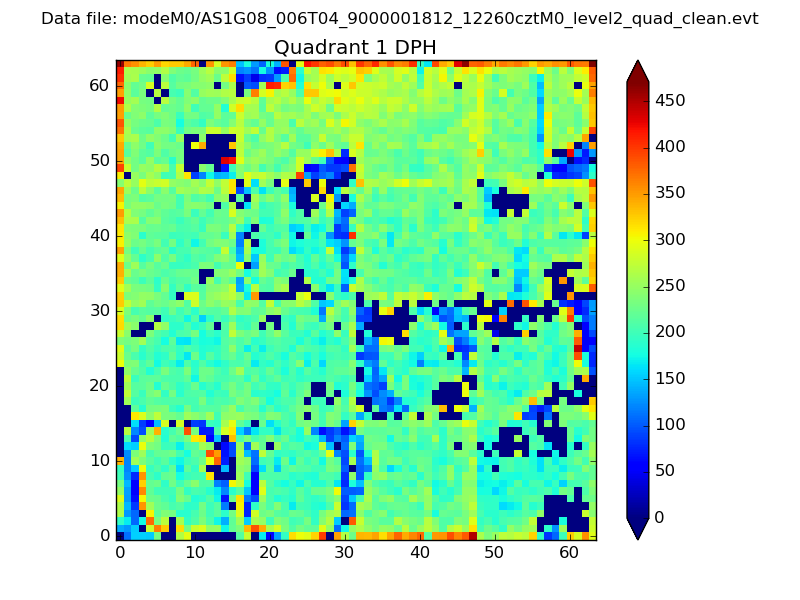 |
Quadrant B |
|---|---|---|---|
| Quadrant D | 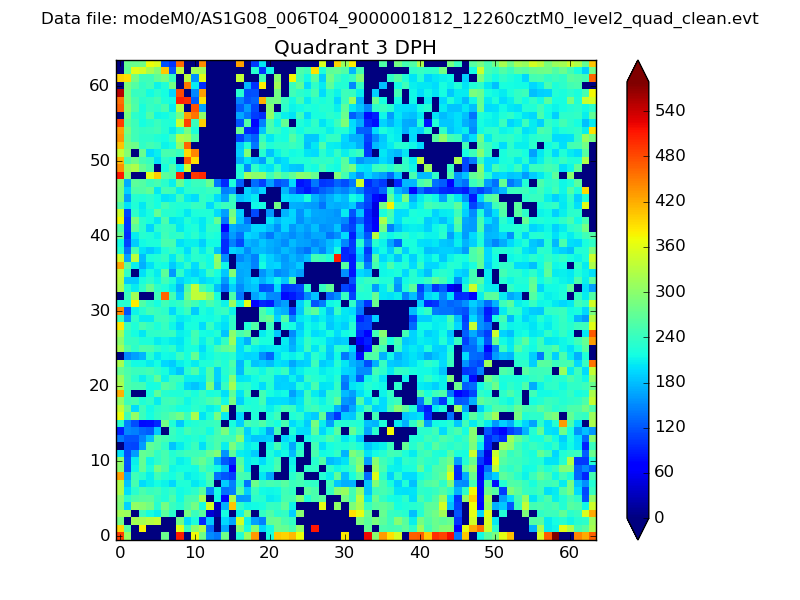 |
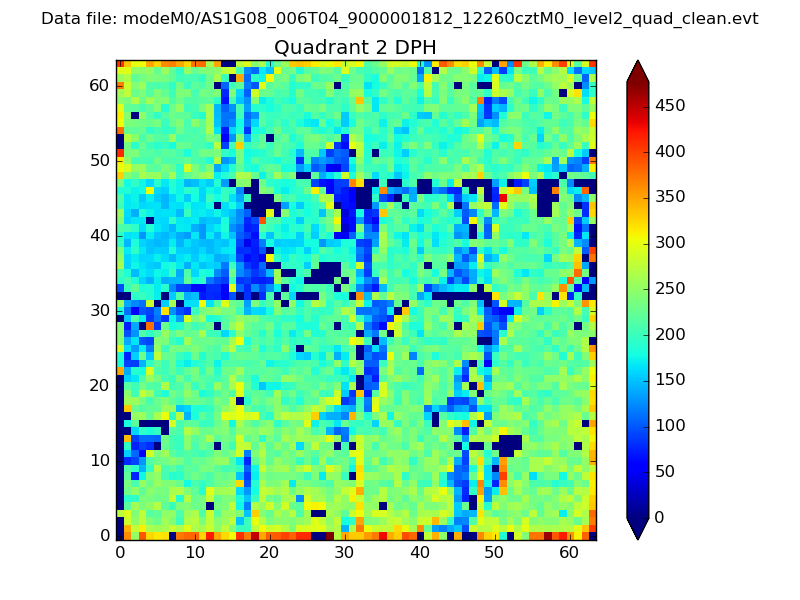 |
Quadrant C |
| Plot type | Count rate plots | Images |
|---|---|---|
| Comparison with Poisson distribution Blue bars denote a histogram of data divided into 1 sec bins. Red curve is a Poisson curve with rate = median count rate of data. |
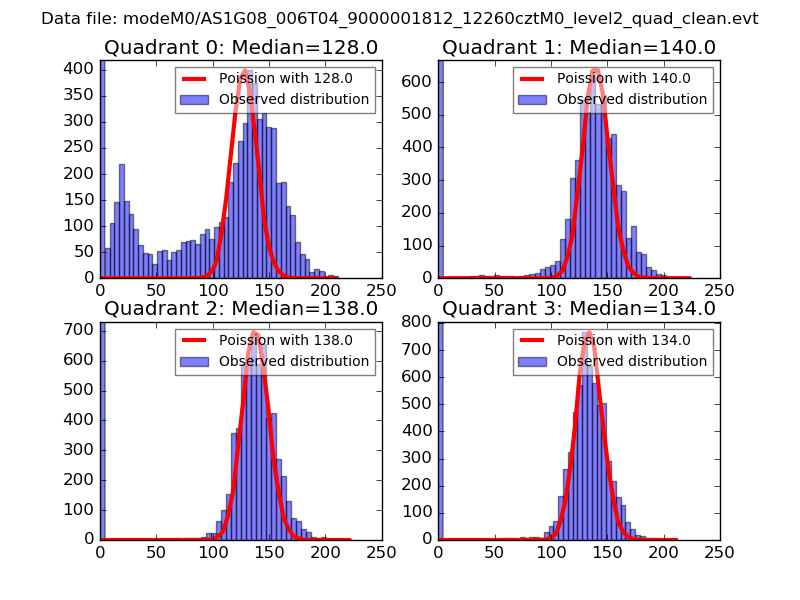 |
 |
| Quadrant-wise count rates Data is divided into 100 sec bins |
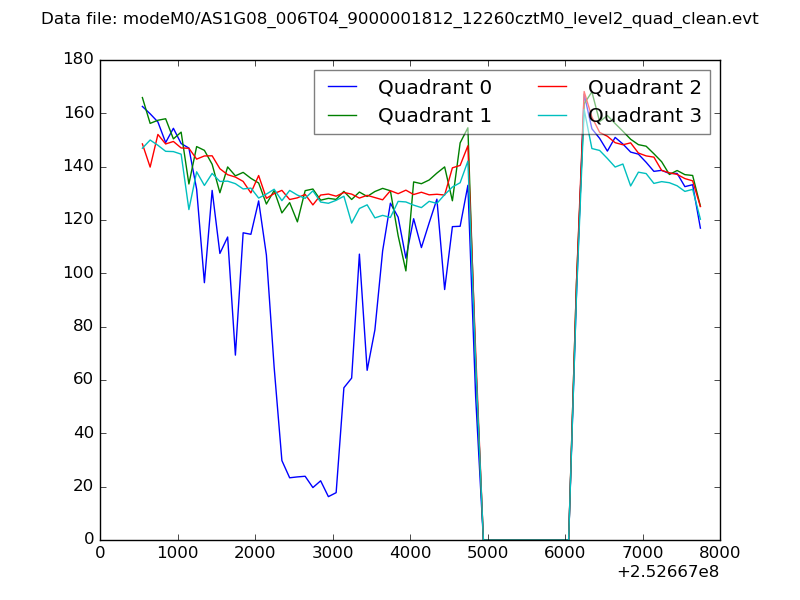 |
|
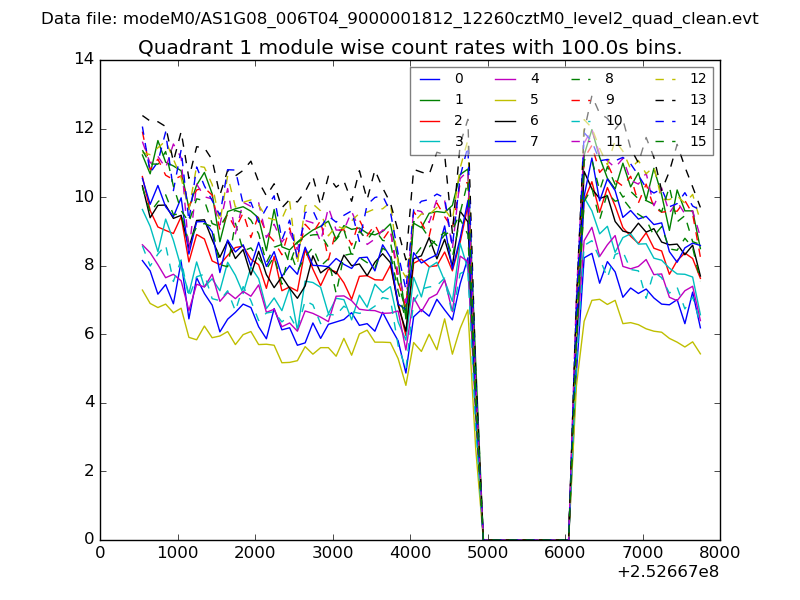
| Module-wise count rates for Quadrant A Data is divided into 100 sec bins |
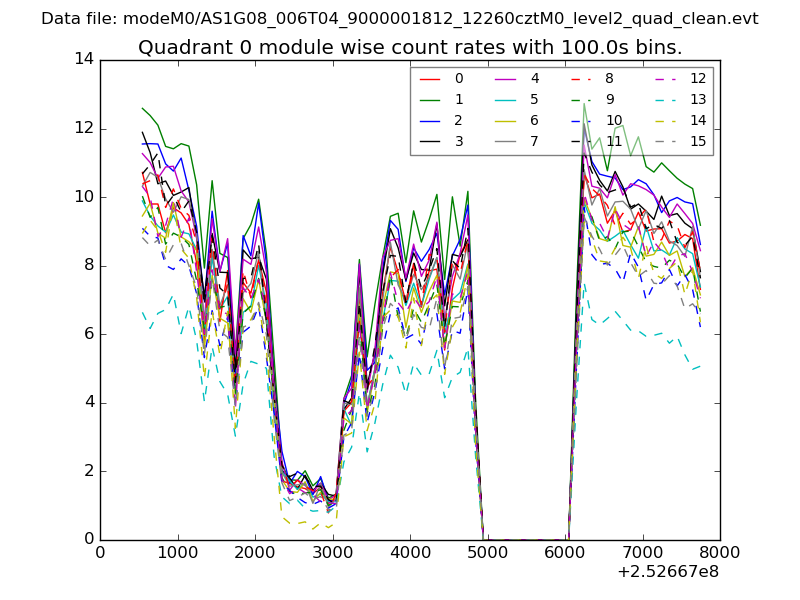 |
 |
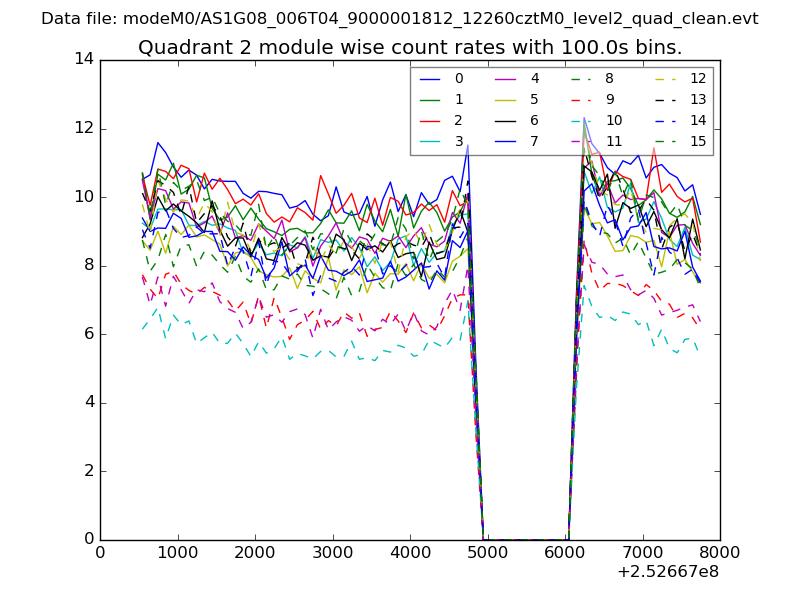
| Module-wise count rates for Quadrant B Data is divided into 100 sec bins |
 |
 |
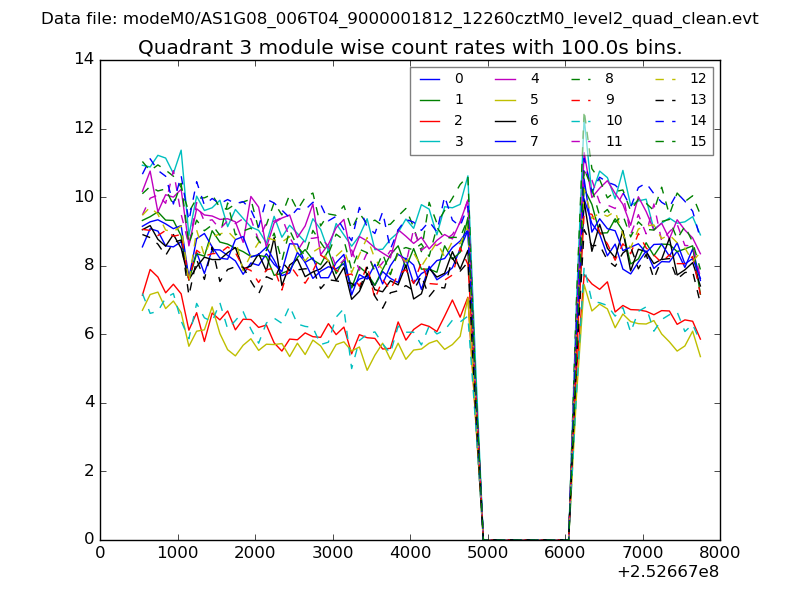
| Module-wise count rates for Quadrant C Data is divided into 100 sec bins |
 |
 |
| Module-wise count rates for Quadrant D Data is divided into 100 sec bins |
 |
 |
| Parameter | Plot |
|---|---|
| CZT HV Monitor | 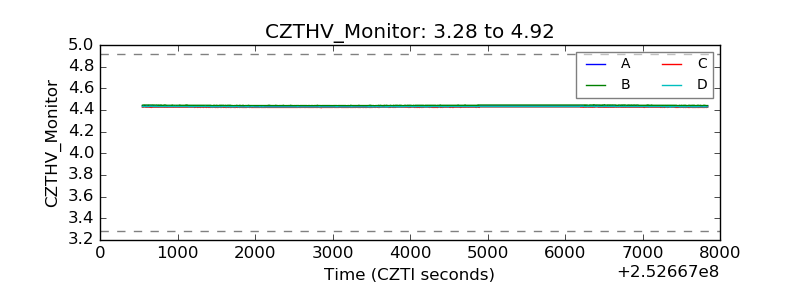 |
| D_VDD | 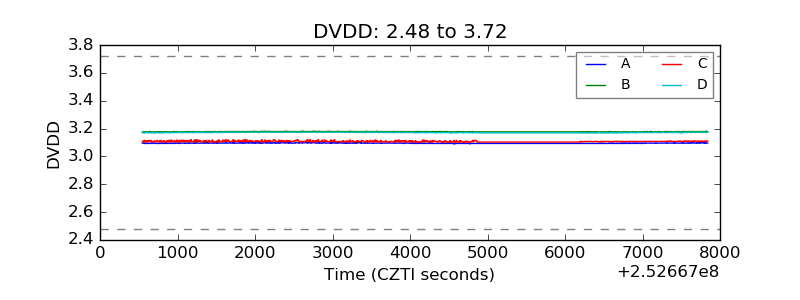 |
| Temperature 1 | 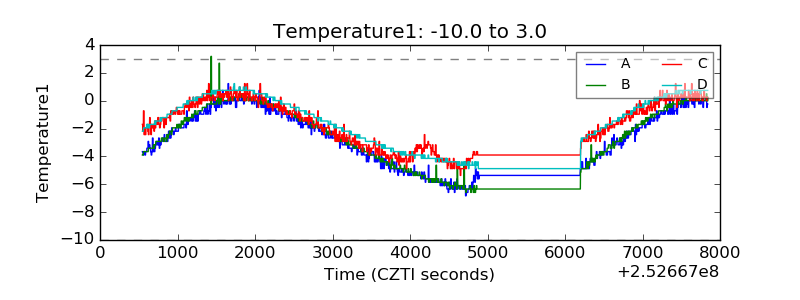 |
| Veto HV Monitor |  |
| Veto LLD | 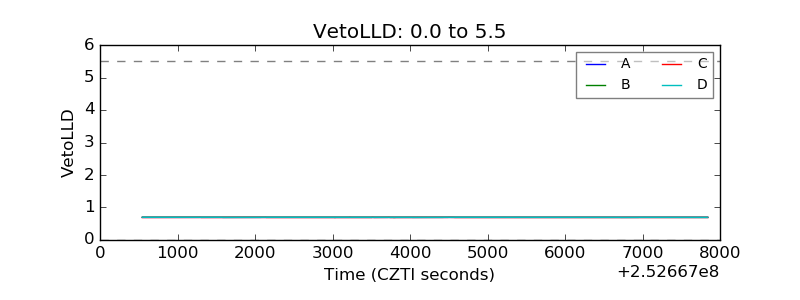 |
| Alpha Counter | 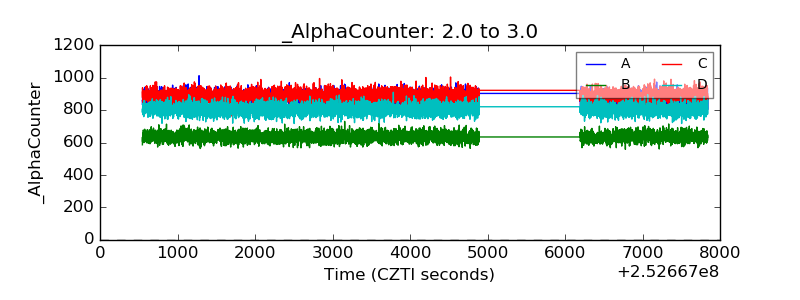 |
| _CPM_Rate | 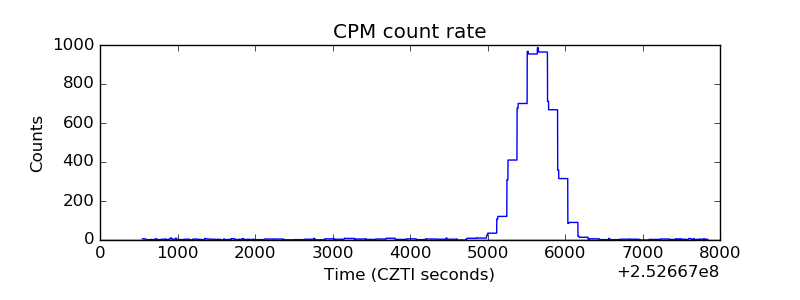 |
| CZT Counter | 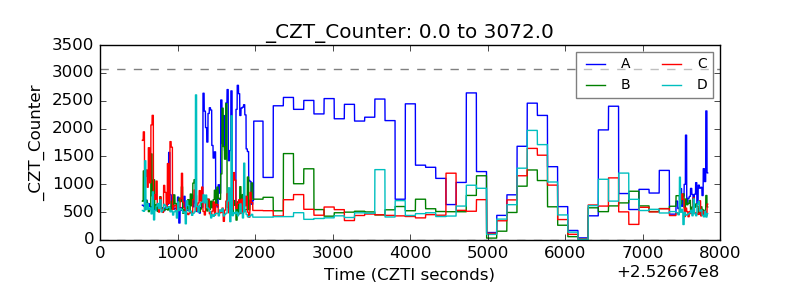 |
| +2.5 Volts monitor |  |
| +5 Volts monitor |  |
| _ROLL_ROT | 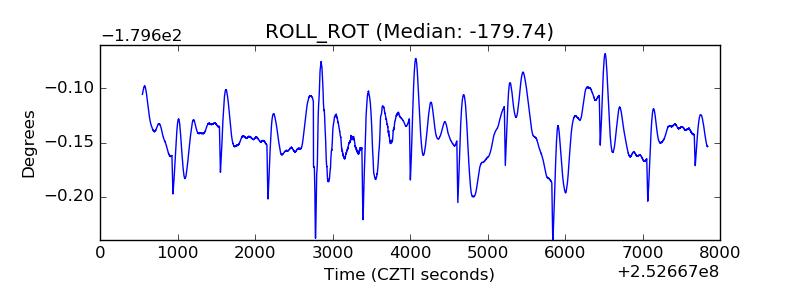 |
| _Roll_DEC | 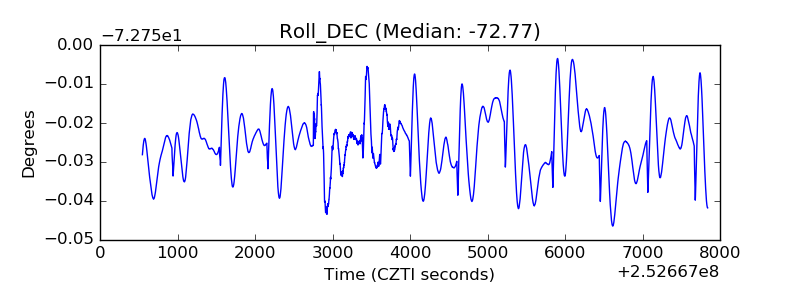 |
| _Roll_RA | 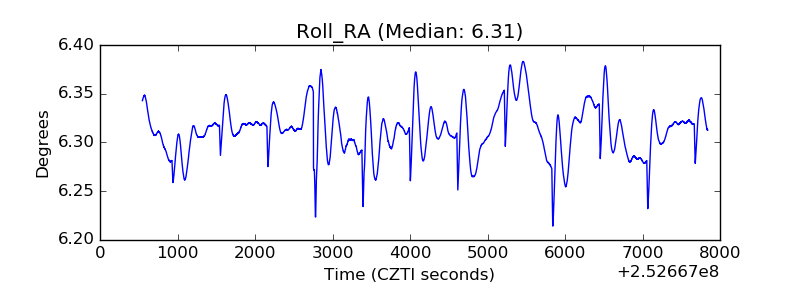 |
| Veto Counter | 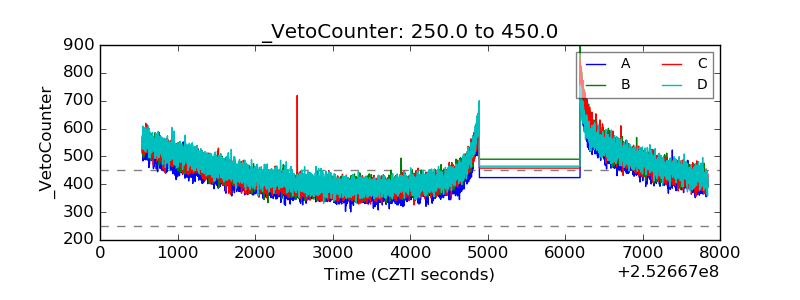 |